


Is there a biology of intelligence which is characteristic of the normal human nervous system wherever it is found? Does it contribute to man's survival as an organism? Is it different in degree, in kind, or in both from that possessed by members of other surviving species? Is it unitary or comprised of multiple factors? More practically, can convenient indices be found which, like blood pressure, accurately reflect the normal and pathological range of variance for the individual? Is there a pathology of biological intelligence which is of significance to psychiatry and to our understanding of normal behavior?
— Ward Halstead (Reference Halstead1947), Brain and Intelligence1. Introduction
“Where in the brain is intelligence?” This question has vexed researchers for at least the last two centuries, as phrenological inquiries (Gall Reference Gall1825) gradually gave way to eloquent studies of particular brain–behavior relationships characterized by the observations of Broca (Reference Broca1861) and Wernicke (Reference Wernicke1874), and the unfortunate case of Phineas Gage (Harlow Reference Harlow1848; Reference Harlow1868), to name a few iconic examples. Subsequently, two richly articulated schools of thought emerged regarding localization of higher cognitive function, including intelligence, within the brain: one implying that the brain works in harmony as a single entity (Flourens Reference Flourens1824; Jackson Reference Jackson1932; Lashley Reference Lashley1929), the other articulating discrete cortical regions underlying higher cognitive functions (Broca Reference Broca1861; Gall Reference Gall1825; Kleist Reference Kleist1934). Pavlov (Reference Pavlov1949) synthesized these previously discordant viewpoints, summarizing brain function as comprising distributed interactions between cortical regions united to perform a common cognitive task, a conceptualization that persists to the present day (Detterman Reference Detterman2000).
This iterative interplay of reductionism and a systems approach provides the conceptual framework that is the basis for most modern neuroimaging studies of intelligence and reasoning. Moreover, this approach expands on earlier studies of whole brain size, which have established the robust, if statistically modest, observation that larger brain size is related to higher intelligence (Jensen Reference Jensen1998). Most of our review is focused on fine-tuning this general observation by identifying the discrete brain regions that are particularly related to individual differences on measures of intelligence and reasoning within the human brain. First, however, we wish to provide a larger context by summarizing the evidence that bigger brains provide some species-general cognitive advantage.
2. Larger brains are “smarter” across species and across evolutionary time
Archeological and anthropological evidence has supported the notion that, within the genus Homo, evolutionary constraints have generally selected for larger brain size relative to body size over time (although see Homo floresiensis). Indeed, Charles Darwin writes in The Descent of Man that,
As the various mental faculties gradually developed themselves the brain would almost certainly become larger. No one, I presume, doubts that the large proportion which the size of man's brain bears to his body, compared to the same proportion in the gorilla or orang, is closely connected with his higher mental powers. (Darwin Reference Darwin1871, p. 37)
Researchers have long attempted to study brain physiology and determine specific correlates of intelligence using technology available during their times. Earliest endeavors (Galton Reference Galton1869) focused on brain size, crudely approximated by measures of head size. All modern studies but one (Tramo & Gazzaniga Reference Tramo and Gazzaniga1999) have found positive correlations between magnetic resonance imaging (MRI) measures of brain volume and intelligence. Indeed, a recent meta-analysis of some 37 neuroimaging studies (McDaniel Reference McDaniel2005) demonstrates a small, yet consistent relationship between whole brain volume and psychometric measures of intelligence (r=.33). Moreover, the relationship between brain size and IQ appears to be rather equally distributed across tissue types, with unweighted mean correlation values of .31 for white matter volume and .27 for gray matter volume (Gignac et al. Reference Gignac, Vernon, Wicket and Nyborg2003).
This relationship between total brain volume and intelligence is compelling in light of the evolutionary record. Two candidate genes have been identified that appear to be important in the regulation of brain size, microcephalin and ASPM (Evans et al. Reference Evans, Gilbert, Mekel-Bobrov, Vallender, Anderson, Vaez-Azizi, Tishkoff, Hudson and Lahn2005; Mekel-Bobrov et al. Reference Mekel-Bobrov, Gilbert, Evans, Vallender, Anderson, Hudson, Tishkoff and Lahn2005). Microcephalin mutation, causing primary microcephaly (severe reduction in brain size, mental retardation, although preserved lobar structure), is found prominently within the germinal matrix of the developing forebrain (Jackson et al. Reference Jackson, Eastwood, Bell, Adu, Toomes, Carr, Roberts, Hampshire, Crow, Mighell, Karbani, Jafri, Rashid, Mueller, Markham and Woods2002), the expression of which results in brain size comparable to early hominids (Wood & Collard Reference Wood and Collard1999). A particular haplotype of the microcephalin locus (i.e., G37995C) was noticed to have a much higher frequency, the age of emergence estimated as being ∼37,000 years ago (Evans et al. Reference Evans, Gilbert, Mekel-Bobrov, Vallender, Anderson, Vaez-Azizi, Tishkoff, Hudson and Lahn2005). A homozygous null mutation of ASPM (i.e., A44871G and C45126A) hypothesized to regulate neural stem cell proliferation/differentiation also is associated with microcephaly; it was estimated by the same group of researchers to have emerged merely 5,800 years ago (Mekel-Bobrov et al. Reference Mekel-Bobrov, Gilbert, Evans, Vallender, Anderson, Hudson, Tishkoff and Lahn2005). Thus, there exists tentative support linking discrete candidate genes, brain size, and the temporal development of cognitive skills associated with relatively modern (i.e., ∼5,800–37,000 years ago) human endeavors over the course of evolutionary history.
Although humans classically have been considered to be the most intelligent species within the scala naturae, they do not possess the largest brain (e.g., sperm whale) or cortical volume (e.g., elephants, whales). What is unique to human brain structure is the relatively large number of cortical neurons (∼11,000 million), and relatively high conduction velocity between those neurons (Roth & Dicke Reference Roth and Dicke2006). Hence, the general notion that “bigger is better” will certainly benefit from a more fine-grained regional analysis of brain–behavior relationships, as reviewed herein. Moreover, whole brain observations also overlook significant connectivity (Schmithorst et al. Reference Schmithorst, Wilke, Dardzinski and Holland2005) and biochemical (Rae et al. Reference Rae, Scott, Thompson, Kemp, Dumughn, Styles, Tracey and Radda1996) contributions within cerebral white matter that may critically constrain the development of intelligence across species and across evolutionary time. Furthermore, the prevailing lore is strongly prejudiced toward the relatively massive (when compared with other species) human frontal lobes as causally related to intelligence. Whereas early researchers found relatively larger frontal cortices in humans compared with other primates (Brodmann Reference Brodmann1912), more contemporary research finds little evidence of proportional differences among primates when great apes are included in the sample (Semendeferi et al. Reference Semendeferi, Lu, Schenker and Damasio2002), except for Brodmann area (BA) 10, which is relatively larger in humans (Semendeferi et al. Reference Semendeferi, Armstrong, Schleicher, Zilles and Van Hoesen2001). This same group has found that gyral white matter (white matter immediately underlying cortical gray matter) was larger than expected in humans in the frontal and temporal lobes (Schenker et al. Reference Schenker, Desgouttes and Semendeferi2005), potentially allowing for increased intracortical connectivity within these brain regions.
Another research group, while focusing on the relatively larger frontal white matter in humans compared to other species, notes the importance of connecting frontal with posterior brain regions to facilitate the evolution of language skill disproportionately evident within the human species (Schoenemann et al. Reference Schoenemann, Sheehan and Glotzer2005). Finally, cortical thickness and white matter microstructure vary substantially across species, with cetaceans (e.g., dolphins and whales) having thinner cortices (Haug Reference Haug1987) and lower levels of myelin thickness (Zhang & Sejnowski Reference Zhang and Sejnowski2000) than primates, in spite of the relatively high level of encephalization (1.8–5.3), total brain size (1,350–9,000 g), and overall number of cortical neurons (5,800–11,000 million) in cetaceans. Thus, the cognitive capacities shared among cetaceans, nonhuman primates, and humans – including self-recognition, symbol-based communication, abstraction, and complex social structures (Marino Reference Marino2002) – are associated with markedly different brain features than mere size alone.
3. Definitions and perspectives from previous reviews
The study of intelligence has labored under various challenges of definition, from “that which intelligence tests measure” (Thorndike Reference Thorndike1921), to finite aspects of cognition consisting of numerous facets or independent abilities (Gardner Reference Gardner1993a; Sternberg Reference Sternberg2000). Others advocate that intelligence is synonymous with working memory (Colom et al. Reference Colom, Rebollo, Palacios, Juan-Espinosa and Kyllonen2004; Kyllonen & Christal Reference Kyllonen and Christal1990), whereas a recent review makes the case for a distinction between working memory/executive functioning and general intelligence (Blair Reference Blair2006). A consensus panel of the American Psychological Association (APA) defined intelligence in this way: “Individuals differ from one another in their ability to understand complex ideas, to adapt effectively to the environment, to learn from experience, to engage in various forms of reasoning, to overcome obstacles by taking thought” (Neisser et al. Reference Neisser, Boodoo, Bouchard, Boykin, Brody, Ceci, Halpern, Loehlin, Perloff, Sternberg and Urbina1996). This view of general intelligence has widespread appeal. In addition, the empirical evidence overwhelmingly supports the concept of a general factor (g) of intelligence, first defined by Spearman (Reference Spearman1904), underlying performance on most (if not all) measures of higher cognitive functioning (Jensen Reference Jensen1998). “General intelligence” more aptly refers to intelligence in general, and it is not the same as g. The neural basis of general intelligence has been the focus of most early neuroimaging/intelligence research; however, as we understand more fully the importance of individual differences across a wide range of cognitive tasks, the neural basis of g has become a more recent focus. Although some neuroimaging studies have specifically tried to assess g (Colom et al. Reference Colom, Jung and Haier2006a; Reference Colom, Jung and Haier2006b; Duncan et al. Reference Duncan, Seitz, Kolodny, Bor, Herzog, Ahmed, Newell and Emslie2000), most studies use single or composite indices of intelligence in general derived from tests such as the Raven's Progressive Matrices Test or Full Scale Intelligence Quotient (FSIQ) scores obtained from the Wechsler Intelligence Scales.
There is a theoretically informative distinction, relevant to the current review, between intelligence in general (e.g., FSIQ) and a general intelligence factor (g). As noted by Jensen, the g-factor should be conceived as a “distillate of the common source of individual differences in all mental tests, completely stripped of their distinctive features of information content, skill, strategy, and the like” (Jensen Reference Jensen1998), p. 74). As noted by Colom et al. (Reference Colom, Jung and Haier2006), whereas the scientific construct of g relies upon the correlations among test scores, intelligence in general is merely a summation of standardized mental test scores. However, the simple sum of various test scores cannot be considered the optimal measure of g, but rather considered a measure of intelligence in general. Intelligence in general means g plus several more specific cognitive abilities and skills. Typical IQ scores comprise a complex mixture of those abilities and skills (Colom et al. Reference Colom, Abad, Garcia and Juan-Espinosa2002). Although IQ scores have high g-factor loadings, IQ scores only approximate g.
Most previous reviews concerned with the neural basis of intelligence have not focused on such distinctions. Rather, they have addressed the biological correlates of intelligence and reasoning from several different perspectives: For example, (1) positron emission tomography (PET) studies of cerebral glucose metabolic rate (Haier Reference Haier and Vernon1993b); (2) the speed and efficiency of brain functioning inferred from reaction time (Jensen Reference Jensen1998) or assessed by electrical propagation of nerve impulses through the brain (Deary & Caryl Reference Deary and Caryl1997); (3) the commonality of frontal lobe recruitment across a wide range of cognitive demands (Duncan & Seitz 2000), including intelligence (Duncan Reference Duncan2005; Duncan et al. Reference Duncan, Burgess and Emslie1995; Kane & Engle Reference Kane and Engle2002); (4) genetic bases underlying the neurobiology of intelligence (Gray & Thompson Reference Gray and Thompson2004; Toga & Thompson Reference Toga and Thompson2005); (5) common fronto-parietal integration underlying a vast array of cognitive demands (Naghavi & Nyberg Reference Naghavi and Nyberg2005); and most recently, (6) an attempt to reconcile concepts of cognitive processing efficiency and general intelligence (Chabris Reference Chabris and Roberts2006).
Summarizing these reviews is well beyond the scope of this paper: Suffice it to say that each of these other reviews has posited discrete brain regions as being associated with intelligence as inferred from the use of noninvasive neuroimaging paradigms, adding incrementally to our understanding of where in the brain intelligence might reside. Our task here is to articulate, for the first time, commonalities across the wide array of neuroimaging studies to date which use a range of measures of intelligence and reasoning, and myriad techniques amenable to structural localization, including structural magnetic resonance imaging (sMRI) and its recent application of voxel-based morphometry (VBM), activation studies of cerebral blood flow and glucose metabolism using positron emission tomography (PET) and functional magnetic resonance imaging (fMRI), chemical inquiries using magnetic resonance spectroscopy (MRS), and measures of water movement using diffusion tensor imaging (DTI).
Due to space limitations, we specifically exclude measures of electroencephalography (EEG) and magnetoencephalography (MEG), both of which provide excellent temporal resolution but, due to the inverse problem (Balish & Muratore Reference Balish and Muratore1990), provide relatively low spatial resolution as compared to other neuroimaging modalities.
4. A discrete parieto-frontal network underlies human intelligence
Following the 100th anniversary of development of the first psychometric test of intelligence by Alfred Binet (see Binet Reference Binet1905), we appear poised to answer the question of where individual differences in intelligence might arise in the human brain. This progress is due to the steady increase, starting in the latter part of the twentieth century, in neuroimaging research designed to correlate measures of higher cognitive functioning with both structural and functional attributes of discrete brain regions. Indeed, in December 2003, a symposium brought together for the first time many researchers engaged in neuroimaging of intelligence (Haier et al. Reference Haier, Thompson, Prabhakaran, Gray, Neubauer, Stough and Jung2003a). That meeting was the genesis of this paper; when the two of us, Jung and Haier, found ourselves independently presenting parallel reviews and hypotheses tentatively locating individual differences in intelligence within a network including both frontal and posterior brain regions. Our comprehensive review here of 37 neuroimaging studies – which include measures of both fluid and crystallized intelligence, measures of reasoning, measures of g, and measures of games of reason (i.e., chess and GO) – identifies several discrete brain regions, distributed across the entire brain, and articulates a surprising commonality of these areas across studies and methods.
We propose a model – the Parieto-Frontal Integration Theory, or P-FIT – that elucidates the critical interaction between association cortices within parietal and frontal brain regions which, when effectively linked by white matter structures (i.e., arcuate fasciculus, superior longitudinal fasciculus), underpins individual differences in reasoning competence in humans, and perhaps in other mammalian species as well (see Fig. 1). We arrive at this model based on the 37 neuroimaging studies of intelligence and reasoning reviewed here and guided conceptually by the recent and extensive review by Cabeza & Nyberg (Reference Cabeza and Nyberg2000) of cognitive neuroimaging research summarizing the functional correlates of brain activity, by lobe, at the level of Brodmann areas.
Brain regions by Brodmann area (BA) associated with better performance on measures of intelligence and reasoning that define the P-FIT model. Numbers=BAs; dark circles= predominant left hemisphere associations; light circles= predominant bilateral associations; white arrow=arcuate fasciculus. This figure is derived from data presented in Figure 5.

The importance of the P-FIT model to intelligence and reasoning can be summarized as follows: (1) We begin with the assumption that humans gather and process cognitively salient information predominantly through auditory and/or visual means (usually in combination) – therefore, particular brain regions within the temporal and occipital lobes are critical to early processing of sensory information: the extrastriate cortex (BAs 18, 19) and fusiform gyrus (BA 37) involving recognition and subsequent imagery and/or elaboration of visual input, and Wernicke's area (BA 22) involving analysis and/or elaboration of syntax of auditory information. (2) We assume this basic sensory/perceptual processing is then fed forward to the parietal cortex, predominantly the supramarginal (BA 40), superior parietal (BA 7), and angular (BA 39) gyri, wherein structural symbolism, abstraction, and elaboration emerge. (3) We further assume the parietal cortex interacts with frontal regions (i.e., BAs 6, 9, 10, 45–47), which serve to hypothesis test various solutions to a given problem. (4) Once the best solution is arrived upon, the anterior cingulate (BA 32) is engaged to constrain response selection, as well as inhibit other competing responses. (5) Finally, we propose that this process is dependent upon the fidelity of underlying white matter necessary to facilitate rapid and error-free transmission of data from posterior to frontal brain regions.
Following our review of the neuroimaging evidence upon which the P-FIT model is based, we will review supporting evidence from brain lesion and genetic imaging studies.
5. Review of neuroimaging literature
5.1. Voxel-based morphometry: Beyond “bigger is better”
Beyond the observation that total brain size weakly correlates with intelligence (Van Valen Reference Van Valen1974), major progress on particular structure-function relationships relied heavily upon lesion analysis (Halstead Reference Halstead1947; Luria Reference Luria1973), and upon groundbreaking work regarding lateral asymmetry (Geschwind & Levitsky Reference Geschwind and Levitsky1968) and cortical disconnection syndromes (Geschwind Reference Geschwind1965). This approach changed dramatically with the introduction of MRI to clinical neurology and psychiatry, offering the possibility of imaging brain structures in both disease and health in living human subjects. In the first study designed to assess the relationship between brain size and intelligence in vivo (Willerman et al. Reference Willerman, Schultz, Rutledge and Bigler1991), total brain volume in 40 college students (mean age±SD=18.9±0.6) was measured with MRI and correlated to performance on four subtests of the Wechsler Adult Intelligence Scale-Revised (WAIS-R). These researchers found a pooled (across sex) correlation of .51 between IQ scores and brain size, although they did note that selection of extreme IQ groups for their sample likely amplified the degree of correlation (estimated r=.35 for a more representative sample). Following Willerman et al., the first so-called in vivo autopsy was conducted to determine brain-intelligence correlates in 67 healthy individuals (mean age±SD=38±16) without a history of medical, neurological, or psychiatric disease. Subjects completed the WAIS-R (mean IQ±SD=116±14) and a standard MRI scan, the results of which indicated modest positive correlations (i.e., .32 to .46) between FSIQ and the volume of specific brain structures including the temporal lobes, hippocampus, cerebellum, and total gray matter (Andreasen et al. Reference Andreasen, Flaum, Swayze, O'Leary, Alliger, Cohen, Ehrhardt and Yuh1993). A subsequent study (Flashman et al. Reference Flashman, Andreasen, Flaum and Swayze1997), in which lobar volumes (i.e.., frontal, temporal, parietal, occipital, cerebellum) were correlated with IQ measures in 90 normal subjects (mean age±SD=27±10), found that volumes of frontal (r=.24), temporal (r=.28), and parietal (r=.24) cortices were predominantly correlated with measures of nonverbal reasoning (i.e., performance IQ). These authors hypothesized that the remaining variance between IQ and brain structure would likely reside in the “quality” rather than “quantity” of brain tissue as found in such variables as circuit complexity, dendritic arbor, myelin thickness, and other neurotransmitter/neurochemical factors.
In spite of the important differences in regional cellular organization reported by Brodmann (Reference Brodmann1912), the brain is not easily segmented into readily identifiable cortical regions. The measurement of discrete cortical and subcortical neuronal-axonal populations required an advance in image analysis, recently realized with voxel-based morphometry (VBM), a method by which standard images may be automatically segmented into tissue compartments (i.e., gray, white, cerebrospinal fluid) using measures of voxel intensity at the millimeter level of resolution (Ashburner & Friston Reference Ashburner and Friston1997). Images from individual subjects are imported into a freely available analysis program (i.e., Statistical Parametric Mapping, or SPM), spatially normalized in stereotactic space (i.e., Montreal Neurological Institute), segmented and smoothed, and subjected to voxel-wise statistical comparisons with either a comparison group or an external variable (Ashburner & Friston Reference Ashburner and Friston2000). This development has resulted in a veritable explosion of clinical VBM studies designed to assess volumetric consequences of various neurological and psychiatric diseases, with more than 200 peer-reviewed research reports containing “voxel-based morphometry” within their abstracts between the years 2000 and 2006. Of note, this methodology is not without controversy (Allen et al. Reference Allen, Bruss, Brown and Damasio2005; Ashburner & Friston Reference Ashburner and Friston2001; Bookstein Reference Bookstein2001; Davatzikos Reference Davatzikos2004), although several recent studies have compared VBM to traditional region-of-interest (ROI) tracing techniques in the same subjects and determined generally good correspondence between methods (Giuliani et al. Reference Giuliani, Calhoun, Pearlson, Francis and Buchanan2005; Good et al. Reference Good, Scahill, Fox, Ashburner, Friston, Chan, Crum, Rossor and Frackowiak2002; Testa et al. Reference Testa, Laakso, Sabattoli, Rossi, Beltramello, Soininen and Frisoni2004).
To date, seven studies have appeared in the literature designed to assess the volumetric correlates of intelligence in the normal human brain (see Table 1). The first study (Wilke et al. Reference Wilke, Sohn, Byars and Holland2003) was of 146 children (mean age±SD=11.7±3.5) of above average intellectual attainment as measured with the Wechsler Intelligence Scales (mean IQ±SD=113.8±13.8). Significant correlations (r=.30) were found between measures of FSIQ and gray matter within the cingulate (BA 32). Our study of 47 adults (age range=18–84) of high average intelligence (mean IQ±SD=116±14.4) found correlations between gray matter volume within frontal (BAs 9, 10, 46), temporal (BAs 21, 22, 37, 42), parietal (BAs 3, 43), and occipital (BA 19) regions, with significant white matter–IQ correlations observed near BA 39 (Haier et al. Reference Haier, Jung, Yeo, Head and Alkire2004). Moreover, these areas differed in young and old adults and also between men and women (Haier et al. Reference Haier, Jung, Yeo, Head and Alkire2005). A third study (Frangou et al. Reference Frangou, Chitins and Williams2004) of 40 young subjects (mean age±SD=14.9±2.6) of average intelligence found correlations with gray matter volume within the cingulate (BAs 24, 31, 32), frontal (BAs 9, 10, 11, 47), and parietal (BAs 5, 7) cortices. Lee et al. (Reference Lee, Lyoo, Kim, Jang, Lee, Jeon, Park and Cho2005) studied 30 older subjects (mean age±SD=61.1±5.18) and found regional correlations between performance IQ and brain volume limited to the posterior lobe of the right cerebellum. A fifth study (Gong et al. Reference Gong, Sluming, Mayes, Keller, Barrick, Cezayirli and Roberts2005) of 55 adults (mean age±SD=40±12) of above average intelligence (mean FSIQ±SD=117 ±11) found gray matter volume correlates with IQ limited to the anterior cingulate (BAs 24, 32) and medial frontal (BAs 8, 9, 10) regions. We have since reanalyzed our VBM data using the method of correlated vectors (i.e., correlating the rank of g-loadings for each test in a group of tests to the rank of the same test correlation to any external variable such as age or brain size; Jensen Reference Jensen1998). We found that g accounted for many of the FSIQ correlations with gray matter in the anterior cingulate (BA 24), frontal (BAs 8, 10, 11, 46, 47), parietal (BAs 7, 40), temporal (BAs 13, 20, 21, 37, 41), and occipital (BAs 17, 18, 19) cortices (Colom et al. Reference Colom, Jung and Haier2006b). Moreover, in a separate analysis, we found a nearly perfect linear relationship between g-loading of each subtest of the WAIS and the amount of gray matter correlated to each subtest score (Colom et al. Reference Colom, Jung and Haier2006a).
Structural neuroimaging studies demonstrating relationships between discrete Brodmann areas (BAs) and measures of intelligence and reasoning

Note: AC/PC=anterior cingulate/posterior cingulate; B=bilateral; L=left lateralized; R=right lateralized; WAIS=Wechsler Adult Intelligence Scale; WISC=Wechsler Intelligence Scale for Children; RCb=right cerebellum; CCFT=Cattell Culture Fair Test; g=general intelligence factor; WPPSI=Wechsler Preschool and Primary Scale of Intelligence; *white matter regions with closest approximate BAs identified; ++women only.
Finally, a newly published study of cortical thickness demonstrates that we are entering the next phase of neuroimaging research on intelligence: longitudinal studies of brain and cognitive development with a large sample size (Shaw et al. Reference Shaw, Greenstein, Lerch, Clasen, Lenroot, Gogtay, Evans, Rapoport and Giedd2006). In this study, 307 normally developing children (mean age at first scan ±SD=13±4.5) were scanned on multiple occasions to determine correlates between measures of cortical thickness and performance on standardized measures of IQ. The strongest and most consistent correlations between cortical thickness and IQ were obtained during late childhood (age range=8.6–11.7 years), with regions throughout the brain showing positive correlations. Using the supplementary Table 1 of their report, we have converted the regional areas identified to Brodmann areas, resulting in distributed brain regions association with intellectual performance in late childhood across frontal (BAs 4, 6, 8, 10, 11, 44–46), parietal (BAs 1–3, 5, 39, 40), temporal (BAs 21, 37), and occipital (BAs 17, 18, 19) cortices. These authors note a striking difference in trajectory of high-IQ subjects compared to their more average counterparts, with “an initial accelerated and prolonged phase of cortical increase, which yields to equally vigorous cortical thinning by early adolescence” (Shaw et al. Reference Shaw, Greenstein, Lerch, Clasen, Lenroot, Gogtay, Evans, Rapoport and Giedd2006). Cortical thickness was correlated with IQ, but there was a clear developmental sequence showing a dynamic relationship between regional brain structure and intelligence as the brain matures through childhood and adolescence. This finding corresponds to our own data showing different, but overlapping brain regions associated with intelligence across young and older adults (Haier et al. Reference Haier, Jung, Yeo, Head and Alkire2004). Similarly, the cortical thinning finding is consistent with some of our earlier observations regarding brain efficiency as evidenced by inverse correlations between brain activity and psychometric intelligence scores (Haier Reference Haier and Vernon1993b; Haier et al. Reference Haier, Siegel, Nuechterlein, Hazlett, Wu, Paek, Browning and Buchsbaum1988; see also Neubauer & Fink Reference Neubauer and Fink2003; Neubauer et al. Reference Neubauer, Fink and Schrausser2002; Reference Neubauer, Grabner, Freudenthaler, Beckmann and Guthke2004).
5.2. White matter studies and intelligence
The relative contribution of white matter to higher cognitive functioning has remained relatively understudied compared to gray matter research linking particular cortical regions to performance. However, several lines of inquiry would suggest that the integrity of myelinated axons plays a critical role in intellectual attainment (Miller Reference Miller1994). For example, myelin thickness is correlated to axonal size (Bishop & Smith Reference Bishop and Smith1964; Friede & Samorajski Reference Friede and Samorajski1967; Mathews Reference Mathews1968), and larger axonal diameter is associated with increased nerve conduction speed (Aboitiz Reference Aboitiz1992). The simultaneous increases in myelination and axonal diameter have been hypothesized to play a critical role in cognitive development. For example, one group has found significant age-related increases in white matter density within the bilateral internal capsule and the posterior aspects of the left arcuate fasciculus (which links anterior and posterior language cortices) in a young (age range=4–17 years) normal cohort (Paus et al. Reference Paus, Zijdenbos, Worsley, Collins, Blumenthal, Giedd, Rapoport and Evans1999). At the other end of the developmental continuum, age-related cognitive decline has been linked to general slowing of brain processes (Hale et al. Reference Hale, Myerson and Wagstaff1987), with concordant linear decreases in myelination initiated around the fourth decade (Bartzokis et al. Reference Bartzokis, Cummings, Sultzer, Henderson, Nuechterlein and Mintz2003). Indeed, reviews of the research literature have found that nearly the entire decline in intellectual functioning observed among the elderly may be accounted for by reductions in processing speed (Lindenberger et al. Reference Lindenberger, Mayr and Kliegl1993; Salthouse & Coon Reference Salthouse and Coon1993).
One technique particularly amenable to the interrogation of white matter neurochemical integrity is magnetic resonance spectroscopy (MRS). This technique predates MRI, although its use in brain research only began in earnest in the latter part of the twentieth century in parallel with the broad application of conventional brain MRI (Bottomley et al. Reference Bottomley, Edelstein, Foster and Adams1985). Two major MRS modalities exist – proton and phosphorous spectroscopy (1H and 31P, respectively), which comprise the vast majority of clinical and normal human studies in the research literature. N-acetylaspartate (NAA), the main metabolite visible within the 1H-MRS spectrum, is found only within neurons and mature oligodendrocytes (Urenjak et al. Reference Urenjak, Williams, Gadian and Noble1993) and has been established as a marker of neuronal density and/or viability in numerous disease states (Barker Reference Barker2001). In the first study linking brain chemistry to intellectual performance in normal subjects using 31P-MRS, Rae et al. (Reference Rae, Scott, Thompson, Kemp, Dumughn, Styles, Tracey and Radda1996) studied 42 boys (age range= 7.4–13.2 years), comparing measures of pH and performance on the Wechsler Intelligence Scale for Children–3rd Edition (WISC-III). They found a significant positive correlation between pH in a large volume spanning the fronto-parietal cortex and IQ (r=.52, p=.0008), the association of which was subsequently determined to be specific to children (Rae et al. Reference Rae, Scott, Lee, Simpson, Hines, Paul, Anderson, Karmiloff-Smith, Styles and Radda2003b). It should be noted that the MRS technique used to date allows only for placement of a single voxel within predominantly white matter regions, and that other brain regions have not been adequately assessed for NAA–IQ relationships. This is a major limitation of this imaging technique, although several groups are implementing spectroscopic imaging techniques that will allow for multi-voxel acquisition across a slab of tissue (Gasparovic et al. Reference Gasparovic, Song, Devier, Bockholt, Caprihan, Mullins, Posse, Jung and Morrison2006), and eventually we may expect full coverage across the entire brain parenchyma.
Using 1H-MRS, our group first studied 26 healthy college students (mean age±SD=22.0±4.6), comparing brain metabolites with performance on the Wechsler Adult Intelligence Scale–3rd Edition (WAIS-3). We obtained measures of NAA from a voxel placed within the left occipito-parietal white matter, a region underlying the angular and supramarginal gyri (BAs 39, 40). In this neurologically and psychiatrically normal cohort, we found a significant, positive relationship between NAA and IQ (r=.52), equally predictive of verbal (r=.48) and nonverbal (r=.45) measures of intellectual performance (Jung et al. Reference Jung, Brooks, Yeo, Chiulli, Weers and Sibbitt1999). We have since replicated and extended these findings in a new normal cohort of 27 college students (mean age±SD=24.8±5.9), showing specificity of the NAA–IQ relationship to left occipito-parietal white matter (when compared to bilateral samples of frontal white matter), as well as stronger NAA–IQ relationships in women compared to men (Jung et al. Reference Jung, Haier, Yeo, Rowland, Petropoulos, Levine, Sibbitt and Brooks2005). A second group (Pfleiderer et al. Reference Pfleiderer, Ohrmann, Suslow, Wolgast, Gerlach, Heindel and Michael2004) studied the relationship between NAA within bilateral dorsolateral prefrontal and left anterior cingulate cortices and the Vocabulary subtest of the WAIS-R (high g-loading) in 62 healthy adults (age range=20–75). They found significant correlations between NAA in voxels underlying left BAs 10 and 46 (r=.53) and 24 and 32 (r=.56) and the Vocabulary subtest scores for women, but not for men. Other groups have since confirmed broader NAA–cognition relationships across a wide array of cognitive tasks in both younger (Yeo et al. Reference Yeo, Hill, Campbell, Vigil and Brooks2000) and older (Ferguson et al. Reference Ferguson, MacLullich, Marshall, Deary, Starr, Seckl and Wardlaw2002; Valenzuela et al. Reference Valenzuela, Sachdev, Wen, Shnier, Brodaty and Gillies2000) experimental cohorts, as well as across myriad neurological and psychiatric patient samples (Ross & Sachdev Reference Ross and Sachdev2004).
A second major modality by which the white matter integrity is measured is diffusion tensor imaging (DTI), an imaging technique that measures the coherence of water movement through the white matter of the brain and that can facilitate in vivo white matter fiber tracking. A single, recent study (Schmithorst et al. Reference Schmithorst, Wilke, Dardzinski and Holland2005) attempts to link measures of white matter status to measures of intelligence in a normal pediatric cohort. This study included 47 children between the ages of 5 and 18 who underwent MRI with DTI and whose intelligence was assessed with the WISC-III. Measures of fractional anisotropy (FA), defined as a measure of white matter fiber “coherence” (i.e., directional organization), were calculated within white matter across all brain regions (frontal, temporal, parietal, and occipital). Results indicated a positive correlation between measures of FA, bilaterally, within frontal and occipito-parietal white matter, a region that the authors concluded to be representative of the arcuate fasciculus. They also noted a stronger correlation between measures of FA and verbal intellectual ability (r=.57) as compared to nonverbal ability (r=.33). Thus, the integrity of white matter connecting Broca's area (BA 44) to Wernicke's area (BA 22) appears to be sensitive to individual differences in intellectual attainment in this young cohort (Schmithorst et al. Reference Schmithorst, Wilke, Dardzinski and Holland2005). We have since used the Talairach coordinates, obtained from Schmithorst et al. (Reference Schmithorst, Wilke, Dardzinski and Holland2005), to determine the nearest gray matter regions overlying the white matter DTI-intelligence regions, which include left hemisphere BAs 13 and 30, right hemisphere BAs 3 and 31, and bilateral BAs 9, 39, and 40 (see Table 1), underlying frontal, parietal, and temporal cortices. Although DTI is an exciting new technique to assess white matter orientation and integrity over the entire brain, the reliability of this technique has yet to be established within discrete white matter tracts (e.g., arcuate fasciculus). That being said, DTI studies potentially may result in substantial contributions linking higher cortical functioning, including intelligence, to white matter fidelity.
5.3. Summary of structural correlates of intelligence
As shown in Table 1 and Figure 2, several commonalities are apparent when assessing structural (i.e., VBM, MRS, DTI) characteristics of the brain that have been associated with intelligence. For example, of the 11 studies reviewed, more than 40% implicate left BA 10 (frontal), 39, and 40 (parietal); specifically, the tissue density and white matter integrity within these regions correlate substantially to performance on the Wechsler Intelligence Scales both in young cohorts (Schmithorst et al. Reference Schmithorst, Wilke, Dardzinski and Holland2005) and within adult samples ranging in age from 18 to 84 (Haier et al. Reference Haier, Jung, Yeo, Head and Alkire2004). Similarly, tissue density and chemical composition for left hemisphere BAs 24 and 32 (cingulate) and 46 (frontal) and right hemisphere BA 9 (frontal) were correlated to FSIQ in more than 30% of the studies. Overall, the structural studies did not tend to implicate common temporal or occipital lobe regions as being correlated to intellectual performance. This may be due to the static nature of structural imaging – participants are not performing tasks while being scanned; rather, their intellectual capacity is assessed and they are scanned on separate occasions. Therefore, it is possible that temporal and occipital lobe relationships to intelligence may be functional and “task dependent” upon the sensory modality (auditory or visual, respectively) employed, as discussed in the next section. However, these structural studies do support frontal (BAs 9, 10, 46), parietal (BAs 39, 40), and anterior cingulate (BAs 24, 32) aspects of the P-FIT model as important to individual differences in performance on standardized intelligence tests such as the WAIS. The combined use of DTI, VBM, and MRS across the entire brain in future studies would allow for simultaneous assessment of water diffusion, tissue density, and chemical composition on a voxel-by-voxel basis, and their simultaneous application would substantially improve our understanding of the structural correlates of intelligence.
Graphical representation of the proportion (Y-axis) of structural neuroimaging studies describing relationships between intelligence and/or reasoning and discrete Brodmann areas by lobe (X-axis).

5.4. Functional imaging studies using PET
William James (Reference James1890, p. 99) first remarked that “blood very likely may rush to each region of the cortex according as it is most active,” a supposition that remained empirically elusive until the introduction of relatively sensitive and accurate measures of regional cerebral blood flow (rCBF) (Lassen et al. Reference Lassen, Hoedt-Rasmussen, Lindbjerg, Pedersen and Munck1963a; Reference Lassen, Hoedt-Rasmussen, Sorensen, Skinhoj, Cronquist, Bodforss and Ingvar1963b). Early research (Ingvar & Risberg Reference Ingvar and Risberg1967; Risberg et al. Reference Risberg, Ancri and Ingvar1968) demonstrated that performance of cognitive tasks was accompanied by increases in regional circulation, hypothesized to correspond to changes in gray matter neuronal activity. One of the earliest imaging techniques had subjects breathe oxygen labeled with the short half-life radioactive isotope 133Xenon, the decay of which could be recorded from detectors surrounding the head. Positron emission tomography (PET) evolved from these early rCBF studies, allowing for greater sensitivity and spatial localization of neuronal uptake through labeling of glucose utilization or blood flow (Sokoloff Reference Sokoloff1981).
The first PET study, designed to formally assess brain–intelligence links in normal subjects in the entire brain, was undertaken in eight young men (mean age±SD=22.4±2.3) by utilizing 18fluoro-2-deoxyglucose (FDG) uptake during performance on a high g-loaded test of nonverbal abstract reasoning, the Raven's Advanced Progressive Matrices (RAPM), over a period of 32 minutes, while subjects worked at their own pace (Haier et al. Reference Haier, Siegel, Nuechterlein, Hazlett, Wu, Paek, Browning and Buchsbaum1988). The most notable finding from this study was widespread inverse correlations between regional glucose metabolic rate (GMR) and performance on the RAPM. Thus, high scores on the RAPM were related to lower GMR, a finding thought possibly to reflect increased “neuronal efficiency” in subjects with better performance (Haier Reference Haier and Vernon1993b; Haier et al. Reference Haier, Siegel, Nuechterlein, Hazlett, Wu, Paek, Browning and Buchsbaum1988). This study used a first-generation PET scanner that imaged only nine axial brain slices, one slice at a time, with relatively poor spatial resolution. (Modern PET scanners image the entire brain simultaneously, with considerably higher spatial resolution.) In this first RAPM study, regional GMR was assessed in only three of the nine axial slices using a stereotactic method, quite primitive by today's standards. In approximate BA terms, the most significant inverse correlations were bilateral in BAs 9/46, 39/40, 22/42, 21/22, and 37/19. A subsequent re-analysis of these data (Haier Reference Haier and Vernon1993b) used a more anatomically refined three-dimensional method of anatomical localization which used all nine axial slices instead of only three individual ones (still primitive by today's standards). Of 32 possible correlations (four areas within each of four lobes, left and right hemisphere), 12 were significant (all negative) – six of these were in temporal and parietal lobes (approximate BAs 21, 22, 37, 38, 39), four in the occipital lobe (BAs 18, 19), and two in the frontal cortex (BAs 9, 10) (Haier Reference Haier and Vernon1993b). At the time, the inverse correlations were surprising, even as the exact anatomical localization of the most significant areas was unsatisfactory. A similar PET study of 16 normal volunteers performing a high g-loaded verbal fluency test, however, also showed significant inverse correlations in frontal, temporal, and parietal lobes (Parks et al. Reference Parks, Loewenstein, Dodrill, Barker, Yoshii, Chang, Emran, Apicella, Sheramata and Duara1988). These authors also interpreted the inverse correlations as an indication of brain efficiency. Hypothesizing that mental retardation may be associated with increased brain inefficiency and greater brain activity, Haier et al. (Reference Haier, Chueh, Touchette, Lott, Buchsbaum, Macmillan, Sandman, Lacasse and Sosa1995) reported higher glucose metabolism throughout the brain in a small group of subjects with IQs between 50 and 75. The regional results of these studies are difficult to convert to BAs; they are discussed in more detail elsewhere (Haier Reference Haier and Nyborg2003).
Although inverse correlations between brain function and cognitive performance also have been reported in EEG studies (Neubauer & Fink Reference Neubauer and Fink2003), most functional imaging studies of cognition compare a task and a control condition and do not examine individual differences in the performance of the task as a variable. In fact, most tasks used in cognitive imaging studies are chosen to minimize performance differences among subjects. Such cognitive tasks are not tests of intelligence per se, but several other studies have linked performance of various “reasoning” tasks to brain activation utilizing PET. One such study (Ghatan et al. Reference Ghatan, Hsieh, Wirsen-Meurling, Wredling, Eriksson, Stone-Elander, Levander and Ingvar1995) using the perceptual maze task (PMT), a measure of frontal lobe function and visuo-spatial reasoning, was performed by eight middle-aged volunteers (mean age=49.1; age range=41–59 years) during [15O] butanol PET. When compared with a motor control “sham” condition, performance of the PMT resulted in increased uptake within bilateral anterior cingulate (BA 32), medial (BAs 6, 8) and right frontal (BAs 4, 49), superior and inferior parietal (BAs 7, 40), inferior temporal (BA 37), and superior occipital (BAs 18, 19) cortices.
Haier and Benbow (Reference Haier and Benbow1995) used FDG PET to study mathematical reasoning in college men (N=22) and women (N=22). Half of each group were selected for high or average mathematical ability on the basis of college entrance SAT-Math scores (SAT-M scores more than 700 for the high groups; between 410 and 540 for the average groups). During the PET procedure, each subject completed a new SAT-M test during the 32-minute FDG uptake period. In men, there were significant correlations between the math score and glucose metabolism in the temporal lobes bilaterally (middle, inferior, and posterior; analogous to BAs 20, 21, 22). There were no correlations in the women, showing a clear sex difference. In a separate PET study of eight normal males, Haier et al. (Reference Haier, Siegel, MacLachlan, Soderling, Lottenberg and Buchsbaum1992a) assessed functional brain changes after the learning of a complex visuo-spatial task (i.e., Tetris), and reported decreased cerebral metabolism after practice. Of interest here, the decreases in several brain areas were larger in the subjects with higher scores on the Raven's Advanced Progressive Matrices (Haier et al. Reference Haier, Siegel, Tang, Abel and Buchsbaum1992b). The regions of decreased metabolism over time were based on a stereotactic method and are not amenable to BA conversion.
Verbal and nonverbal reasoning have also been studied using PET. For example, one group of researchers conducted two studies assessing deductive/inductive reasoning and analysis of verbal syllogisms (Goel et al. Reference Goel, Gold, Kapur and Houle1997; Reference Goel, Gold, Kapur and Houle1998) in samples of 10 (mean age±SD=28.4±4.03) and 12 young adult subjects (mean age±SD=28.2±2.6 years), respectively, measured with [15O]H2O PET. In the first study, compared to baseline, inductive reasoning was associated with activations in the left frontal (BAs 8, 9, 10, 24, 32, 47), temporal (BA 20), and occipital (BA 19) lobes. In the second study, the researchers found activations inclusive of the left frontal (BAs 45, 46, 47), left temporal (BAs 21, 22), and left cingulate (BAs 24, 32) gyri. In a 15O PET study of two frontal lobe nonverbal reasoning tasks – the Wisconsin Card Sorting Test and the Raven's Progressive Matrices Test – Esposito et al. (Reference Esposito, Kirkby, Van Horn, Ellmore and Berman1999) studied 41 healthy volunteers. In their young adult cohort (age range=18–42 years), they found converging bilateral activations across tasks within the dorsolateral prefrontal (BAs 9, 46), inferior parietal (BAs 39, 40), anterior cingulate (BA 32), inferior/lateral temporal (BAs 21, 37), and occipital cortices (BAs 18, 19), suggestive of a common neural network underlying diverse problem-solving tasks and matching key components of the P-FIT.
The understanding of analogical reasoning, a high g ability, has been of keen interest within the cognitive neurosciences for several decades, with at least one group speculating that the left angular gyrus may be “hardwired” for analogical reasoning (Gur et al. Reference Gur, Ragland, Resnick, Skolnick, Jaggi, Muenz and Gur1994). Indeed, several early 133Xenon blood flow studies indicated that verbal analogical reasoning activated predominantly left hemisphere regions, particularly the left inferior parietal cortex and Wernicke's area (Gur & Reivich Reference Gur and Reivich1980; Gur et al. Reference Gur, Gur, Obrist, Hungerbuhler, Younkin, Rosen, Skolnick and Reivich1982; Reference Gur, Gur, Obrist, Skolnick and Reivich1987; Reference Gur, Gur, Skolnick, Resnick, Silver, Chawluk, Muenz, Obrist and Reivich1988; Risberg et al. Reference Risberg, Halsey, Wills and Wilson1975). However, spatial localization was quite primitive when compared to modern PET and fMRI techniques. In the only PET visual analogical reasoning study to date (Wharton et al. Reference Wharton, Grafman, Flitman, Hansen, Brauner, Marks and Honda2000), researchers studied 12 young adult subjects (mean age=26 years) while they observed a source picture comprised of nameable geometric objects (e.g., triangle) and decided whether it was an analog of a target display of geometric objects. When comparing analogical reasoning to literal conditions (i.e., target matches source exactly), Wharton et al. found activations within the left middle frontal (BAs 6, 8) and inferior frontal (BAs 10, 44, 45, 46, 47) gyri, the anterior insula, and inferior parietal cortex (BA 40). These authors concluded that “analogical mapping is produced by an integrated network formed from the left parietal and frontal cortices. Further, it may be that the left parietal and frontal cortices mediate automatic and controlled aspects of mapping respectively” (Wharton et al. Reference Wharton, Grafman, Flitman, Hansen, Brauner, Marks and Honda2000).
In a widely cited study, Duncan et al. (Reference Duncan, Seitz, Kolodny, Bor, Herzog, Ahmed, Newell and Emslie2000) reported [15O] butanol PET activations associated with reasoning performance in 13 young adult subjects (mean age=26 years). Their protocol used high g-correlated and low g-correlated items sampling both verbal and visuo-spatial domains. They focused the interpretation of their results on the predominantly frontal commonality of activation seen in both the verbal and spatial reasoning conditions (BAs 46, 47). However, their “high” g task resulted in activations spread across frontal (BAs 6, 8, 10, 45, 46, 47), parietal (BAs 7, 40), and occipital (BAs 18, 19) cortices. Nonetheless, Duncan et al. concluded that g was almost exclusively related to the frontal lobe, a view at odds with most prior and subsequent neuroimaging studies. Recently, Duncan has modified his view (Duncan Reference Duncan2005; also see a critique of this study by Colom et al. Reference Colom, Jung and Haier2006a).
Finally, Haier et al. (Reference Haier, White and Alkire2003b) assessed whether individuals with higher scores on the high g-loaded test, the Raven's Advanced Progressive Matrices Test (RAPM), process information differently even when no problem solving is explicitly involved in task performance. For this experiment, 22 young adults (mean age±SD=22.1±2.6) were studied with FDG PET as they viewed two videotapes, including narratives, with content consisting of either emotional or no emotional valence. Prior to the PET session, subjects completed the RAPM, with a 40-minute time limit, to assess intellectual functioning. Interestingly, significant positive correlations (common across both conditions) were found between RAPM scores and glucose uptake in several posterior brain regions, including bilateral parietal (BA 7), temporal (BAs 22, 37), and occipital (BAs 18, 19) cortices. Negative correlations were found in left BA 39 and right BA 7, BA 18, and the left parahippocampus (only positive correlations are included in the Table 2, although the interaction of reduced “activation” and function is of increasing interest to the cognitive neurosciences). Moreover, the strongest functional connectivity differentiating high- and low-RAPM subjects was found between BAs 19 and 37 and the left anterior cingulate/medial frontal gyrus. These authors offer several possible hypotheses for the importance of these posterior areas for intelligence, including that “individual differences in the ability to resolve competition among incoming visual stimuli may be a component of g” (Haier et al. Reference Haier, White and Alkire2003b).
Positron Emission Tomography (PET) neuroimaging studies demonstrating relationships between discrete Brodmann areas (BAs) and measures of intelligence and reasoning

Note: AC/PC=anterior cingulate/posterior cingulate; B=bilateral; L=left lateralized; R=right lateralized; RAPM=Raven's Advanced Progressive Matrices; PMT=perceptual maze test; V=verbal; V/S=visuo-spatial; WCST=Wisconsin Card Sorting Test; CCFT=Cattell Culture Fair Test; §=men only.
5.5. Summary of PET correlates of intelligence
One striking element in the summary of PET studies of intelligence is the general gradient of bilateral activations within posterior brain regions and the predominantly left hemisphere activations within the frontal lobes, apparent in Table 2 and Figure 3. Half of the studies reported bilateral activations within BAs 18 and 19 within extrastriate cortex, as well as predominantly left hemisphere activation within either BAs 46 or 47. Forty percent (40%) of studies revealed left greater than right activation within frontal BAs 8 and 10, the anterior cingulate gyrus BA 32, and temporal BAs 21, 22, and 37, comprising the ventral “what” stream of visual information processing (Ungerleider & Mishkin Reference Ungerleider, Mishkin, Ingle, Goodale and Mansfield1982). Interestingly, these activations were not limited to strictly visual tasks (see Goel et al. Reference Goel, Gold, Kapur and Houle1997; Wharton et al. Reference Wharton, Grafman, Flitman, Hansen, Brauner, Marks and Honda2000). Finally, 30% of studies reported activations within predominantly the left lateralized frontal cortex (BA 9) and the bilateral posterior parietal cortex (BAs 7, 40). Overall, these PET studies largely conform to the P-FIT model. The relative invasiveness of PET studies (i.e., exposing subjects to radioactive isotopes), as well as the long period of uptake within the brain (i.e., ranging from 2 minutes to 32 minutes), would tend to limit future research to targeted hypotheses within relatively small subject groups designed to elucidate the entirety of brain networks associated with a given reasoning and/or intelligence task. However, this area of research is critically important to future studies, as it exploits direct precursors limiting the performance of neuronal work (e.g., oxygen/glucose) as opposed to measures hypothesized to be indirectly linked to neuronal work (e.g., blood oxygen level dependent [BOLD] response). In combination with new labeling agents and other imaging modalities possessing millisecond time resolution (e.g., magnetoencephalography), PET studies are likely to continue to contribute to understanding the neural basis of intelligence and reasoning.
Graphical representation of the proportion (Y-axis) of PET neuroimaging studies describing relationships between intelligence and/or reasoning and discrete Brodmann areas by lobe (X-axis).

5.6. Functional imaging studies using fMRI
Functional studies of human cognition required technology unavailable at the beginning of the twentieth century. However, in perhaps the first report on the association between blood flow and cognition in humans, John Fulton, a neurosurgery resident, described a patient who presented with decreasing vision due to an arteriovenous malformation (AVM) in the occipital cortex (Fulton Reference Fulton1928). Surgical removal of the AVM was attempted but unsuccessful, leaving a bony defect in the occipital bone through which a prominent bruit (i.e., rushing of blood) could be heard at auscultation. In a subsequent detailed analysis, Fulton found that the amplitude of the bruit was well correlated with the patient's mental activity. For example, opening of the eyes would elicit a moderate increase in blood flow sounds, whereas reading corresponded to dramatic increases. This initial finding foreshadowed the potential of tools which could make such assessments of blood flow – as later demonstrated by the accumulated work of several Nobel laureates (e.g., Felix Bloch and Edward Purcell [Nobel Prize – 1952], and Paul Lauterbur and Peter Mansfield [Nobel Prize – 2003]), and numerous other, less recognized contributors to the nascent field, in developing imaging technology that would allow visualization of brain parenchyma in vivo. Out of their collective work emerged magnetic resonance imaging (MRI), and later functional MRI (fMRI), a neuroimaging technique that exploits the increase in blood flow to the local vasculature that accompanies neural activity in gray matter regions of the brain.
In the first fMRI study of the neural substrates of reasoning, Prabhakaran et al. (Reference Prabhakaran, Smith, Desmond, Glover and Gabrieli1997) had seven young adult subjects (age range=23–30 years) perform three types of problems (i.e., match, figural reasoning, analytical reasoning) selected from the RAPM while undergoing fMRI. Match problems required the subject to merely match a figure to an identical exemplar. Figural problems required predominantly visuo-spatial analysis to determine the right answer. Analytical problems required abstraction and reasoning beyond mere perceptual analysis. Fluid reasoning (i.e., analytic–figural) resulted in activations within frontal (BAs 6, 9, 44, 45, 46), parietal (BAs 7, 39, 40), temporal (BAs 21, 37), and occipital (BAs 18, 19) cortices, with only the parietal activation limited to the left hemisphere. These authors conclude that the neural network underlying RAPM performance overlaps substantially with verbal working memory networks, even during analytical reasoning regarding nonverbal patterns; therefore, a strong link exists between neural systems underlying working memory and reasoning. Another group (Kroger et al. Reference Kroger, Sabb, Fales, Bookheimer, Cohen and Holyoak2002) used fMRI to study neural correlates of visual reasoning during performance of matrix problems of increasing levels of difficulty by eight young adults (age range=19–32 years). They found that a measure of “relational complexity,” associated with solving matrix problems, resulted in activations within the bilateral frontal (BAs 6, 9, 47), left frontal (BAs 44, 46), bilateral parietal (BA 7), and bilateral anterior cingulate (BA 32) cortices.
Proficiency in the game of chess has long been equated with superior intelligence and keen reasoning skill, and attempts have been successful in creating a computer that can defeat even the most accomplished human opponent (i.e., IBM's Deep Blue). The neural substrates of such games of reason are now under study with neuroimaging. One group of researchers studied fMRI activations associated with the games of chess (Atherton et al. Reference Atherton, Zhuang, Bart, Hu and He2003) and GO (Chen et al. Reference Chen, Zhang, Zhang, Li, Meng, He and Hu2003). In the first experiment, six male novice chess players (age range=24–33 years) were scanned as they determined the best move for white to make in a middle game position. When this condition was contrasted with a condition in which chess pieces were dispersed randomly across the board, significant activations were observed within bilateral regions of the parietal (BAs 7, 39, 40), occipital (BA 19), and left frontal (BAs 6, 8, 9) cortices, as well as the left cerebellum. In the second study, six amateur GO players were scanned under realistic and random game positions. When game conditions were compared with random board conditions, significant activations were observed within the left frontal (BAs 44, 45), bilateral frontal (BAs 6, 9), posterior cingulate (BAs 30, 31), parietal (BAs 7, 40), temporal (BA 37), and occipital (BA 19) cortices. Chen et al. noted the relative “paucity of activation in the frontal lobes” across studies, as well as lack of hemispheric specialization, although both games are considered to be strategic and spatially oriented. They made special note “that the so-called ‘g’ areas in the frontal lobe reported and emphasized by Duncan et al. (Reference Duncan, Seitz, Kolodny, Bor, Herzog, Ahmed, Newell and Emslie2000) are not consistently activated in either GO or chess cognition” (Chen et al. Reference Chen, Zhang, Zhang, Li, Meng, He and Hu2003).
Several studies have been undertaken to study logical reasoning with fMRI. For example, Goel and Dolan (Reference Goel and Dolan2001) used measures of either concrete or abstract “relational reasoning” problems (e.g., “the apples are in the barrel; the barrel is in the barn; the apples are in the barn,” or A>B; B>C; A>C) to measure brain activation in 14 subjects (mean age±SD=28.6±4.6). These authors found that logical reasoning elicited activations within the bilateral frontal (BAs 6, 9), parietal (BAs 7, 40), left (BAs 17, 18) and bilateral occipital (BA 19) cortices, as well as in the bilateral subcortical (e.g., caudate/nucleus accumbens) and cerebellar regions. In a study of 10 male subjects (age range=20–25 years), Luo et al. (Reference Luo, Perry, Peng, Jin, Xu, Ding and Xu2003), used Chinese verbal analogies to assess brain activations associated with reasoning, finding significant activations within the left frontal (BA 9), left parietal (BAs 7, 40), bilateral fusiform (BA 37), and left (BA 18) and bilateral (BA 19) extrastriate cortices. Using an assessment of conditional verbal reasoning, Noveck et al. (Reference Noveck, Goel and Smith2004) studied 16 subjects (mean age±SD=26.7±5.9) using measures of verbal “if-then” statements derived from symbolic logic (e.g., modus ponens/modus tollens). Subtraction of straightforward if-then inferences (e.g., modus ponens) from conditional inferences (e.g., modus tollens) yielded activations within the left frontal (BAs 9, 47), parietal (BA 40), and cingulate (BA 32) cortices. These authors noted that parietal activations were associated with “arbitrary” content such as found with symbolic relations (e.g., if A then B; A// therefore B), whereas frontal activation was observed as the reasoning problems became more similar to conversational exchanges. In a separate study by the same group (Goel & Dolan Reference Goel and Dolan2004) of 16 subjects (mean age±SD=27.5±6.4), the main effect of reasoning was associated with activations in the bilateral frontal (BAs 6, 45), parietal (BAs 7, 40), temporal (BA 37), and occipital (BA 18) cortices.
Another group of researchers have used fMRI in a series of studies to ascertain brain regions associated with deductive reasoning, usually by way of presenting premise statements from which a subject is to draw a “relational” conclusion (e.g., [1] Bob is taller than Bill; [2] Bill is taller than Brian; [3] is Bob taller than Brian?). Knauff et al. (Reference Knauff, Mulack, Kassubek, Salih and Greenlee2002) studied 12 right-handed, male subjects (mean age±SD=23.9±3.3) as they performed verbal or spatial-relational word problems. Activations were observed in the bilateral frontal (BAs 6, 9), anterior cingulate (BA 32), temporal (BAs 21, 22), parietal (BAs 7, 40), and occipital (BA 19) brain regions. This same group (Ruff et al. Reference Ruff, Knauff, Fangmeier and Spreer2003) studied 12 volunteers (mean age±SD=24.0±3.21) using problems of relational inference (e.g., left of, right of, overlaps from the left) that supported either a single conclusion (i.e., “determinate”) or several conclusions (i.e., “indeterminate”), presented in an auditory format. They observed activations within the bilateral frontal (BAs 6, 10) and bilateral posterior cingulate (BA 31) cortices, the right parahippocampus, and the bilateral occipital (BAs 18, 19) cortex. Moreover, performance on the Block Design subtest of the WAIS (high g-loading) covaried negatively with precuneus (BA 7) activations during the reasoning task. A third study by this group (Knauff et al. Reference Knauff, Fangmeier, Ruff and Johnson-Laird2003) used verbal relational reasoning problems (e.g., Bob is taller than Bill, etc.) to study brain activations in 12 German native speakers (age range=21–35 years). These researchers found that performance of all inference problems compared to rest intervals was associated with activations in the left frontal (BAs 46, 47), right frontal (BA 6), bilateral parietal (BA 7), and both bilateral (BA 21) and left (BA 38) temporal cortices. Most recently, this group (Fangmeier et al. Reference Fangmeier, Knauff, Ruff and Sloutsky2006) has hypothesized a three-stage model of deductive reasoning involving (1) premise processing, (2) premise integration, and (3) a validation phase. In 12 subjects (mean age±SD=22.4±1.98), across all reasoning phases (as opposed to maintenance phases analogous to working memory), Fangmeier et al. found that brain activations were significantly predicted by performance of the high g Block Design subtest of the WAIS within the left cingulate cortex (BAs 23, 24, 31), frontal cortex (right BAs 4, 6, 8, 9, 10; left BA 46), bilateral precuneus (BA 7), basal ganglia, and thalamus. They noted a shift of activation from initial temporal-occipital activation, to frontal activation, and finally to parietal activation, the last of which they surmised is central to the reasoning process, as it is active only during reasoning, and not during working memory processes.
Gray et al. (Reference Gray, Chabris and Braver2003) studied the relationship between working memory and intelligence with fMRI in a sample consisting of 48 young adults (age range=18–37 years) who performed the RAPM while outside the scanner, and performed a three-back working memory task, comprised of either recurring words or faces, while undergoing the imaging protocol. “Target” trials consisted of stimuli repeated at three intervals following initial presentation; “lure” trials consisted of trials in which previously viewed stimuli were seen again, although not in the third position from initial presentation. Analysis of the data determined voxels of activation in which the magnitude of brain activity while performing “lure” trials of the three-back test was significantly correlated with performance on the RAPM. Results unconstrained to brain region indicated broad activation on the “lure” trials consisting of frontal (left BAs 45, 46; right BA 4), parietal (right BA 31, left BA 39, bilateral BA 40), and bilateral temporal (BA 22) cortices – areas consistent with earlier studies (Haier et al. Reference Haier, Siegel, Nuechterlein, Hazlett, Wu, Paek, Browning and Buchsbaum1988; Prabhakaran et al. Reference Prabhakaran, Smith, Desmond, Glover and Gabrieli1997), although Gray et al. (Reference Gray, Chabris and Braver2003) do not report evidence of an inverse relationship in these areas between activation and performance. Indeed, when controlling for lure-trial brain activity, activation within three regions including the left lateral prefrontal cortex and bilateral parietal cortex predicted 99.9% of the relationship between fluid intelligence and accuracy on the working memory trials with high interference, the strongest of which was the right medial parietal region (BA 31, r=.60). These authors concluded that fluid intelligence differences in brain activity emerged “almost exclusively” on working memory trials in which high interference was a factor; and that the lateral prefrontal cortex, “a key brain region suspected to support reasoning and novel problem solving ability,” substantially mediates the control over such interference in attaining cognitive goals. This finding appears to contrast with that of the previous study (Fangmeier et al. Reference Fangmeier, Knauff, Ruff and Sloutsky2006), which found reasoning to be associated with late parietal activation and working memory to be associated with frontal activation.
Geake and Hansen (Reference Geake and Hansen2005) used measures of “fluid analogies” comprised of letter sequences in which the one right answer, of four possible choices, is inferred from an example problem and solution (e.g., abc→abd, ijk→?). Twelve subjects (age range=18–54 years) of above average intelligence (mean FSIQ=119) were studied. At least two interesting findings emerged from this study. First, the regions in which fluid analogy problem solving elicited activations were within predominantly bilateral frontal (BAs 8, 10, 12, 45, 47; also left BA 44, right BA 46), parietal (BAs 7, 40), and occipital (BAs 17, 18) regions, as well as the bilateral anterior cingulate cortex (BA 32). Second, these researchers found a linear relationship between a measure of verbal IQ (New Adult Reading Test) and the percentage change in the blood oxygen level dependent (BOLD) signal in several discrete frontal brain regions (BAs 9, 45, 46). Geake and Hansen concluded that their findings are consistent with research highlighting activation of the inferior parietal lobe and precuneus being related to solving visually presented, quasi-spatial problems (Goel & Dolan Reference Goel and Dolan2001; Knauff et al. Reference Knauff, Mulack, Kassubek, Salih and Greenlee2002), and frontal activations being associated with working memory demands (Cabeza & Nyberg Reference Cabeza and Nyberg2000).
Another fMRI study (O'Boyle et al. Reference O'Boyle, Cunnington, Silk, Vaughan, Jackson, Syngeniotis and Egan2005) compared six mathematically gifted males with six average controls (mean age=14.3). Math-gifted participants performed at the 99th percentile on both the Australian version of the SAT math section and on the Raven's Progressive Matrices test; average participants performed at the 50th and 70th percentiles, respectively, across measures. Subjects performed a mental rotation task while undergoing fMRI, and groups did not differ across accuracy or processing-time measures. Whereas both groups activated a similar fronto-parietal network during performance of the mental rotation task (i.e., BAs 6, 7, 9, 40), activations were significantly greater for gifted subjects in three brain regions: the right anterior cingulate (BA 32), left inferior parietal lobe (BA 39), and left premotor cortex (BA 6). Moreover, no significant group differences were found during a simple matching task relative to baseline. O'Boyle et al. noted that gifted individuals recruit a “quantitatively and qualitatively different brain network than [do] those of average math ability,” with more bilateral activation, extensive activation of the parietal lobes, and “selective activation of the anterior cingulate and frontal cortex.” They hypothesized that bilateral activation of the parietal, frontal, and cingulate cortices may be critical components of an “all-purpose” information processing network, “relied upon by individuals who are intellectually gifted, irrespective of the nature of their exceptional abilities.”
Using a similar design, Lee et al. (Reference Lee, Choi, Gray, Cho, Chae, Lee and Kim2006) studied 18 gifted and 18 average Korean adolescents (mean age±SD=16.5±0.8) as they performed g-loaded visual tasks of low and high difficulty. All subjects were administered the RAPM outside of the scanner, as well as the Korean version of the WAIS-R. Gifted subjects had exceptional performance on both the RAPM and the WAIS-R (>99th percentile), whereas average subjects were at the 60th and 63rd percentiles, respectively. The first finding of note was that a positive correlation was found between individual difference in g and cortical activation during a reasoning task, in apparent contrast to previous studies reflecting “neuronal efficiency,” reported in non-gifted subjects (Haier et al. Reference Haier, Siegel, Nuechterlein, Hazlett, Wu, Paek, Browning and Buchsbaum1988), but consistent with other studies which also selected subjects on high and average ability (Haier & Benbow Reference Haier and Benbow1995; Larson et al. Reference Larson, Haier, LaCasse and Hazen1995). There were greater regional activations in the gifted group in the bilateral anterior cingulate (BA 32), prefrontal (BAs 6, 8, 9, 45, 46), parietal (BAs 7, 39, 40) and occipital (BA 19) cortices. When individual difference-based activations were correlated with individual g level, the activations were limited to a bilateral region within the superior parietal lobe (BA 7), the right inferior parietal lobe (BA 40), and the precuneus (BA 19). Lee et al. (Reference Lee, Choi, Gray, Cho, Chae, Lee and Kim2006) interpreted their findings as reflecting the neural underpinnings of superior intellectual ability, with robust activation of a fronto-parietal network, particularly the posterior parietal cortex. Whereas earlier work of one of these authors (Gray et al. Reference Gray, Chabris and Braver2003) focused predominantly on frontal regions underlying intelligence, their current work is consistent with a distributed view and implicates parietal regions consistent with the P-FIT proposed here.
Finally, in what can only be described as an fMRI “tour de force” (Schmithorst & Holland Reference Schmithorst and Holland2006), 323 children between the ages of 5 and 18 (mean age±SD=11.8±3.7) performed a silent verb-generation task while undergoing a “child-friendly” (Holland et al. Reference Holland, Plante, Weber Byars, Strawsburg, Schmithorst and Ball2001; Petersen et al. Reference Petersen, Fox, Posner, Mintun and Raichle1988) functional MRI session. All subjects completed either the WISC or WAIS (mean IQ±SD=111.6±13.9) and underwent fMRI scanning during which they silently generated appropriate verbs (e.g., “throw”) associated with aurally presented nouns (e.g., “ball”). Across both sexes, significant activations were associated with intellectual performance during verb generation within the left frontal region (BAs 6, 44, 45), left anterior cingulate (BAs 24, 32), left (BA 21) and right (BA 22) temporal lobes, and left precuneus (BA 19). Schmithorst and Holland conducted connectivity analyses in which the main effect of FSIQ revealed connections between the precuneus and medial frontal gyrus (relative weighted functional connectivity=1.0), with weaker connections between the medial frontal gyrus and cingulate (relative weighted functional connectivity=.25) and between the precuneus and medial temporal gyrus (relative weighted functional connectivity=.25). Sex differences were also found, although these are beyond the scope of this review. These authors hypothesized a developmental course of functional connectivity between posterior and anterior regions, mediated by sex, during the performance of a “low-g” task. They noted that the lack of activation within the lateral prefrontal and inferior parietal lobes is consistent with the Gray et al. (Reference Gray, Chabris and Braver2003) study which showed activation within these regions related to performance of a high g-correlated working memory task. In contrast, according to Schmithorst and Holland, individual differences in “low-g” information-processing abilities like those studied by Haier et al. (Reference Haier, White and Alkire2003b) appear to mediate the functional connectivity between visual association regions with the anterior cingulate and medial frontal gyri.
5.7. Summary of fMRI correlates of intelligence
As shown in Table 3 and Figure 4, the fMRI studies articulate the most broadly distributed network of regions associated with reasoning measures including tasks similar to the RAPM, visual and verbal analogical reasoning, logical reasoning, and playing reasoning games of chess and GO. Similarly, research in which subjects' performance on high g (i.e., working memory) or low g (i.e., verb generation) tasks was constrained by individual differences on intelligence measures in such a way as to articulate similar aspects of the P-FIT, particularly bilateral regions within the frontal and parietal cortices.
Functional magnetic resonance imaging (fMRI) studies demonstrating relationships between discrete Brodmann areas (BAs) and measures of intelligence and reasoning
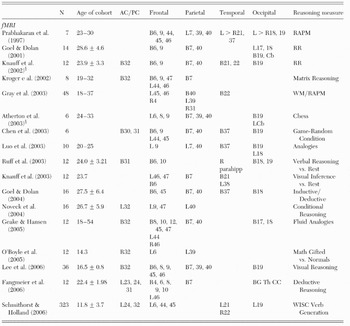
Note: AC/PC=anterior cingulate/posterior cingulate; B=bilateral; L=left lateralized; R=right lateralized; RAPM=Raven's Advanced Progressive Matrices; RR=relational reasoning; WM=working memory; WISC=Wechsler Intelligence Scale for Children; parahipp=parahippocampus; Cb=cerebellum; Th=thalamus; BG=basal ganglia; CC=corpus callosum; §=men only.
Graphical representation of the proportion (Y-axis) of fMRI neuroimaging studies describing relationships between intelligence and/or reasoning and discrete Brodmann areas by lobe (X-axis).

As shown in Figure 4, more than 70% of these studies included activations within BA 7, and more than 60% activations within frontal BA 6 and parietal BA 40, providing strong evidence for posterior parietal lobe involvement across a vast array of reasoning tasks. Substantial bilateral activations (i.e., >40% of studies reviewed) were also observed within the frontal (BA 9) and occipital (BA 19) cortices, again left tending to be greater than right. Other regions in which activations were observed on a consistent basis (i.e., >30% of studies reviewed) included left>right parastriate cortex (BA18), left dorsolateral prefrontal cortex (BAs 45, 46), and the left anterior cingulate cortex (BA 32).
With these summary activation patterns in mind, we must not lose sight of the truism that all neuroimaging research is correlational by nature. However, fMRI has been under increasing scrutiny due to its high reliance upon inferences drawn from blood flow as opposed to neuronal processes per se (Arthurs & Boniface Reference Arthurs and Boniface2002; Logothetis & Wandell Reference Logothetis and Wandell2004). This potential problem is compounded by the rather infrequent reference to lesion studies in fMRI research to support such inferences (Fellows et al. Reference Fellows, Heberlein, Morales, Shivde, Waller and Wu2005). Therefore, following the next section, we pay particular attention to lesion data towards the purpose of supporting the inferences used to define the P-FIT model.
6. Where in the brain is intelligence? A tabulation of 37 neuroimaging studies1
To facilitate identifying common areas across studies, Figure 5 shows the overall tabulation of these brain areas from Tables 1 to 3, separately by hemisphere. Where studies explicitly identified such BAs, as commonly found in fMRI and VBM experiments, they are listed by region including anterior cingulate, frontal, parietal, temporal, and occipital cortices, as well as the cerebellum. In studies where such regional detail is not explicit, as found in some PET, DTI, and MRS studies of white matter, the nearest BA has been estimated.
Graphical representation of the proportion (Y-axis) of all reviewed structural, PET, and fMRI studies describing relationships between intelligence and/or reasoning and discrete Brodmann areas by lobe (X-axis). These studies represent 1,557 subjects.* *Brodmann areas (BAs) in which greater than 25% of studies found significant relationships between intelligence/reasoning and neuroimaging measures were included in Figure 1 as comprising the P-FIT. Furthermore, within a given BA that met this threshold, if hemispheric asymmetry ratio exceeded 10:7, then predominantly left hemisphere asymmetry was assumed. In BAs where the hemispheric asymmetry ratio was less than 10:7, bilateral symmetry was assumed.

Several interesting features are evident within the tables, summarized within Figure 5. For example, of the 37 studies identified, all but 10 found parietal activations/volume correlates with intelligence centered around BAs 7 and 40 but also inclusive of BA 39. Similarly, all but 11 of the studies were associated with frontal lobe activations/volume correlates relatively equally distributed between BAs 6 and 9, with somewhat fewer studies suggesting the addition of BAs 45 to 47. Occipital regions including BAs 18 and 19 were represented consistently across studies more than 30% and 40% of the time, respectively. Temporal BAs 21 and 37 also were well represented, although not quite as consistently. These occipital and temporal areas implicate early sensory processing, especially the ventral “what” and dorsal “where” circuit, which may be more subject to individual differences than previously appreciated (Haier et al. Reference Haier, White and Alkire2003b). Finally, the anterior cingulate (BA 32) was consistently related to intelligence measures across more than 30% of studies reviewed; it remains a strong biological correlate of intelligence, as both volume and activation of this structure were found across several studies. Overall, the network of brain regions that we designate as the P-FIT, summarized in Figure 1, appears to underlie individual differences in intellectual functioning in humans across the preponderance of studies. There is substantial overlap with brain regions associated with language functioning, including Wernicke's area (BA 22), the angular and supramarginal gyri (BAs 39, 40), white matter regions including the arcuate fasciculus, and Broca's area (BAs 44, 45).
The notion that parieto-frontal interaction underpins higher cognitive functioning is not a new one. To be sure, the interplay between parietal and frontal association cortices, evident across both human and nonhuman primates, has been described as both central to behavioral guidance (Kandel et al. Reference Kandel, Schwartz and Jessell2000) and critical to maintenance of neuronal firing beyond the bounds of overt environmental stimulation (Goldman-Rakic Reference Goldman-Rakic1987). Indeed, the very notion of consciousness was hypothesized to be related to interactions between parietal and frontal association cortices linking sensory with motor systems, respectively (Jackson Reference Jackson1932). Recent reviews regarding neuronal underpinnings of higher cognitive functioning, including the constructs of attention, episodic memory, working memory, consciousness, and intelligence, have touched upon various elements of this parieto-frontal integration, with most emphasizing predominantly frontal control over parietal integration (Deary & Caryl Reference Deary and Caryl1997; Duncan & Owen Reference Duncan and Owen2000; Gray & Thompson Reference Gray and Thompson2004; Naghavi & Nyberg Reference Naghavi and Nyberg2005), although the directionality of control and how feedback loops moderate these interactions remain empirical questions.
Finally, on an ideographic note, we observe that a postmortem study found that Albert Einstein's brain was 15% larger than controls in the parietal lobe (Witelson et al. Reference Witelson, Kigar and Harvey1999), although this observation is not without controversy (Galaburda Reference Galaburda1999; Hines Reference Hines1998) and inferences from one exceptional intellect should be treated with caution (Burrell Reference Burrell2005).
7. Perspectives on the P-FIT network
7.1. Brain lesion studies
Lesion studies provide an excellent set of data to help evaluate the model that discrete regions distributed throughout the brain underlie intelligence, as opposed to the brain in its entirety or localization being in only the frontal lobes. The specific model we shall examine predicts that lesions within dorsolateral prefrontal (BAs 9, 45–47) and/or parietal (BAs 7, 40) regions will result in a decline in intelligence, whereas lesions outside of these regions will result in relative intellectual stability. The first test of the model may be inferred from the effects of high-velocity focal missile wounds incurred during the two world wars of the last century (Newcombe Reference Newcombe1969). The advantage of this type of study is the relatively discrete nature of the injury, as opposed to large territory destruction resulting from other traumatic or cerebrovascular etiologies. Indeed, studies by Poppelreuter (Reference Poppelreuter1917), Kleist (Reference Kleist1934), Goldstein (Reference Goldstein1942), Head (Reference Head1926), and Luria (Reference Luria1963) added substantially to the field of behavioral neurology in explicating various structure–function relationships associated with discrete brain lesions. Germane to the current discussion, Weinstein and Teuber (Reference Weinstein and Teuber1957) reported on a sample of 62 men who took the Army General Classification Test both before and after incurring missile wounds. After controlling for the presence of aphasia, only individuals with left parietal or parieto-temporal lesions had lower verbal intelligence than controls (for a review, see Newcombe Reference Newcombe1969). In the largest sample of its kind, 97 servicemen from World War II with missile wounds (53 left hemisphere, 44 right hemisphere) were subjected to an extensive battery of psychometric measures (including the Raven's Progressive Matrices Test) and compared with age- and education-matched controls. Individuals with aphasia were excluded from the analysis. Of the lesion sites evaluated, those within right posterior brain regions were associated with the greatest difference in IQ between patients and controls, although the general conclusion was that missile injury was not associated with intellectual decline (Newcombe Reference Newcombe1969).
Frontal leukotomy was a technique developed by Antonio Egaz Moniz to “calm” neuropsychiatric patients (a finding that won him the Nobel Prize in 1949), later popularized by Walter Freeman and James Watts in the United States. This technique involves severing the fronto-thalamic white matter connections, thus isolating the frontal lobes from other brain regions. Ward C. Halstead (Reference Halstead1947), from whose work the opening epigram of this article is drawn, reviewed several studies in which psychometric measures were used to study patients undergoing prefrontal leukotomy (Freeman & Watts Reference Freeman and Watts1942; Hunt Reference Hunt1940; Hutton Reference Hutton1942; Kisker Reference Kisker1943; Porteus Reference Porteus1944; Porteus & Kepner Reference Porteus and Kepner1944; Strom-Olsen et al. Reference Strom-Olsen, Last, Brody and Knight1943). Indeed, for the Stanford-Binet test, postoperative IQs reported in the literature at that time ranged from 54 to 152, with a mean value of 108; the average drop in IQ postoperatively measured one point across studies. Several subsequent studies have confirmed that minimal if any decline in IQ results from frontal lobotomy (Cochrane & Kljajic Reference Cochrane and Kljajic1979; Cumming et al. Reference Cumming, Hay, Lee and Sachdev1995; Stuss et al. Reference Stuss, Benson, Kaplan, Weir, Naeser, Lieberman and Ferrill1983). Across several decades of study on the subject, the generally accepted doctrine has remained that IQ scores are relatively impervious to damage of the frontal lobes, although more specific neuropsychological skills (e.g., judgment, planning, accommodation of novelty) may be affected adversely. Indeed, when intellectual deficits are reported following frontal lobe lesions, they almost invariably involve dorsolateral (BAs 44–47) cortical lesions.
Several studies have sought to determine the effects of temporal lobectomies on intellectual performance, providing another test of our model. A standard anterolateral temporal lobectomy involves removing 4 to 5 cm of lateral cortex (superior, middle, and inferior temporal gyri) and the parahippocampal formation (parahippocampal gyrus and hippocampus), thus leaving relatively intact the BA 37, as well as posterior aspects of BAs 21 and 22. Pediatric epilepsy is often treated with excision of the “lesioned” tissue, and the location of the lesion has been associated with intellectual deterioration: Children with posterior foci are at some threefold greater risk for intellectual disability than those with frontal or temporal loci (Helmstaedter & Lendt Reference Helmstaedter, Lendt, Jambaque, Lassonde and Dulac2001). In a review of the available literature on intellectual changes following temporal excision, Lah (Reference Lah2004) reports that of 16 studies available, 3 showed a significant change in IQ post-surgery, and that those three studies suggested increased IQ compared to pre-surgical levels (Lewis et al. Reference Lewis, Thompson and Santos1996; Miranda & Smith Reference Miranda and Smith2001; Westerveld et al. Reference Westerveld, Sass, Chelune, Hermann, Barr, Loring, Strauss, Trenerry, Perrine and Spencer2000). This finding is generally borne out in adult studies, which also find stability or even a slight increase in IQ following temporal lobe resection (Alpherts et al. Reference Alpherts, Vermeulen, Hendriks, Franken, van Rijen, Lopes da Silva and van Veelen2004; Suchy & Chelune Reference Suchy and Chelune2001; Wachi et al. Reference Wachi, Tomikawa, Fukuda, Kameyama, Kasahara, Sasagawa, Shirane, Kanazawa, Yoshino, Aoki and Sohma2001). Therefore, removal of the anterior portions of the temporal lobe does not appear to adversely affect intellectual performance.
Finally, we evaluate the P-FIT model with lesions to the dorsolateral and inferior parietal/superior temporal cortices, as often is found in populations suffering from acquired aphasia as a result of stroke. Research regarding the effects of aphasia on intelligence has been murky, with several researchers demonstrating decreased performance of aphasics on the Raven's (Costa et al. Reference Costa, Vaughan, Horwitz and Ritter1969), while others find no such differences (Archibald et al. Reference Archibald, Wepman and Jones1967; Arrigoni & De Renzi Reference Arrigoni and De Renzi1964; Boller & Vignolo Reference Boller and Vignolo1966; De Renzi & Faglioni Reference De Renzi and Faglioni1965; Piercy & Smyth Reference Piercy and Smyth1962), although aphasia type (i.e., expressive versus receptive) likely plays a role. Indeed, in an early study of 111 aphasic patients separated by type (i.e., global, Wernicke's, transcortical, Broca's, conduction), researchers Kertesz and McCabe (Reference Kertesz and McCabe1975) found that individuals with global, transcortical, and Wernicke's aphasias performed significantly worse than those with Broca's or conduction aphasias or the controls on the Raven's Coloured Progressive Matrices (RCPM) test, a finding which they interpreted as reflecting the combined need for comprehension and visuo-spatial relations to perform the task well. Subsequent studies (Gainotti et al. Reference Gainotti, D'Erme, Villa and Caltagirone1986) have confirmed that Wernicke's and global aphasias preferentially affect intellectual performance independent of the effects of unilateral spatial neglect, although apraxia may play a role (Basso et al. Reference Basso, Capitani, Luzzatti and Spinnler1981). Lastly, in an elegant study of the effects of lesion site upon performance of the RCPM in 159 unilateral brain damaged patients in which the presence of aphasia and visual field defects were controlled for, it was found that patients with aphasia performed worse on the task regardless of whether the visual fields were intact or not (Basso et al. Reference Basso, De Renzi, Faglioni, Scotti and Spinnler1973). These authors conclude that
there is one region of the brain, overlapping the language area, which plays a major role in several different intellectual tasks, independent of their specific features. This might mean that several intellectual abilities are focally organized in this area, or, more likely, that the area sub-serves a super-ordinate ability entering into every intelligent performance and identifiable with the factor designated as “g” by psychologists. (Basso et al. Reference Basso, De Renzi, Faglioni, Scotti and Spinnler1973)
We should note at the conclusion of this “lesion” section that the increasing availability of rapid transcranial magnetic stimulation (rTMS) provides a further avenue to explore mechanistic relationships between discrete brain regions and intelligence. More experimental control is possible with rTMS than with lesion studies, the vast majority of which traverse several BAs and involve reorganization of function in patients over time. Although the state of rTMS research largely has been limited to discrete single stimulation points, we are quickly moving towards the ability to perform multichannel rTMS, by which discrete nodes within a network can be “lesioned” temporarily in a sequence guided by information provided by EEG/MEG during performance of a behavioral task. Experiments of intelligence and reasoning carried out with rTMS, then, may provide information regarding the necessary and/or sufficient contribution of discrete nodes, and the time-course of their involvement, within the network identified by the P-FIT as they relate to the manifestation of intelligent behavior.
7.2. Imaging genomics
A major domain of interest regarding biological mechanisms underlying intelligence and reasoning must include genetic inquiries, although this area of research is not without controversy (Gray & Thompson Reference Gray and Thompson2004). Indeed, a gradual evolution has occurred regarding “genetic determinism,” wherein the paradigm has moved away from “one gene equals one protein” to multiple possible transcripts, alternate splicing, multiple proteins, and hence multiplicity of possible functions (Silverman Reference Silverman2004). Environmental factors likely interact with gene expression in a critical and complex interplay, which, at the level of an individual, weakens the notion of genetic determinism. Silverman (Reference Silverman2004) took a strong position on the changing view of genetic determinism based on the extreme disparity between the relatively small number of human genes and the vast number of gene products:
The evolutionary and developmental implications of multiple expression variants are profound and suggest a tectonic shift from sole reliance on single mutations or nucleotide polymorphisms as a source of potential variation. Through combinatorial interactions, these expression variants increase, by a million fold or more, the raw material for evolutionary development. (p. 32)
This exponential variability of genetic variation is a model that offers the requisite number of possibilities for natural selection to occur (on the order of billions as opposed to 30,000), and suggests that microevolutionary events can occur within the scale of human existence, leading to the expression of intelligence associated with massive brain expansion.
That being said, several studies comparing monozygotic twins have indicated a strong heritability of gray matter, white matter, and total brain volume, ranging from .6 to .9 (Winterer & Goldman Reference Winterer and Goldman2003). Moreover, both total brain volume and intelligence have been found to be under substantial genetic influence (Pennington et al. Reference Pennington, Filipek, Lefly, Chhabildas, Kennedy, Simon, Filley, Galaburda and DeFries2000; Posthuma et al. Reference Posthuma, De Geus, Baare, Hulshoff Pol, Kahn and Boomsma2002; Thompson et al. Reference Thompson, Cannon, Narr, van Erp, Poutanen, Huttunen, Lonnqvist, Standertskjold-Nordenstam, Kaprio, Khaledy, Dail, Zoumalan and Toga2001; Tramo et al. Reference Tramo, Loftus, Thomas, Green, Mott and Gazzaniga1995), although two studies do not support such an association (Reiss et al. Reference Reiss, Abrams, Singer, Ross and Denckla1996; Schoenemann et al. Reference Schoenemann, Budinger, Sarich and Wang2000). More specifically, the heritability of white matter volume/intelligence relationships is complicated by the relative lack of localization ability when compared with gray matter volumes. However, in a recent study of 24 monozygotic twin pairs, 31 dizygotic pairs, and 25 sibling pairs (Posthuma et al. Reference Posthuma, De Geus, Baare, Hulshoff Pol, Kahn and Boomsma2002), researchers found that the observed volume/intelligence correlations were roughly equal across both gray and white matter volumes (r=.25 and .24, respectively). Recalling our earlier discussion of two genes associated with total brain size which have recently emerged (Evans et al. Reference Evans, Gilbert, Mekel-Bobrov, Vallender, Anderson, Vaez-Azizi, Tishkoff, Hudson and Lahn2005; Mekel-Bobrov et al. Reference Mekel-Bobrov, Gilbert, Evans, Vallender, Anderson, Hudson, Tishkoff and Lahn2005), we would also anticipate that the ASPM and microcephalin genes are strong candidates for mediating the relationship between gray and white matter volumes within discrete brain regions identified within the general P-FIT.
Specific to regional gray matter volumes, one important study outlining genetic contribution to brain volume was carried out in 40 individuals: 10 monozygotic and 10 dizygotic twin pairs (Thompson et al. Reference Thompson, Cannon, Narr, van Erp, Poutanen, Huttunen, Lonnqvist, Standertskjold-Nordenstam, Kaprio, Khaledy, Dail, Zoumalan and Toga2001). These researchers found that frontal gray matter volume was most related to FSIQ (F=9.37, p<.0176 corrected for multiple comparisons). Interestingly, they found that gray matter volume was under “significant genetic control” in regions including frontal and language-related cortices. More specifically, gray matter volumes of monozygotic twins were correlated 95% to 100% in frontal lobe (BAs 9 and 46), linguistic areas including Broca's (BA 45) and the supramarginal region of Wernicke's areas (BA 22), and parieto-occipital association cortices. Fraternal twins had 90% to 100% convergence in gray matter volumes in the supramarginal (BA 40), angular (BA 39), and Wernicke's (BA 22) areas of the brain. These regions largely overlap the major regions identified by the P-FIT model, which suggests the possibility of major genetic contributions to intellectual functioning associated with dorsolateral, linguistic, and parieto-occipital association gray matter volume. It should be noted that correlations between measures of FSIQ and gray matter volume were significant only for the frontal lobes when whole brain size was controlled statistically; however, the relatively low statistical power may have limited the ability to detect such relationships in other brain regions (e.g., temporal gray matter volume in this study reflected a statistical trend of p=.06).
The mechanisms by which genetic factors interact with environmental constraints to affect gray matter volume within the P-FIT (and thus intelligence) are currently unknown. We are not aware of any studies combining neuroimaging, genetics, and assessment of individual differences in intelligence simultaneously. Future studies using broad measures of cognitive functioning, from which a measure of g might be extracted, in large samples of monozygotic and dizygotic twins, undergoing various neuroimaging paradigms, will be important. Such studies would be powerful in providing data to address which aspects of greater cortical volume are salient for the reported relationships with intelligence.
8. Concluding remarks
Despite the sometimes contentious controversy about whether intelligence can or should be measured, the array of neuroimaging studies reviewed here demonstrates that scores on many psychometrically based measures of intellectual ability have robust correlates in brain structure and function. Moreover, the consistencies demonstrated among studies further undermine claims that intelligence testing has no empirical basis. Schizophrenia research in the 1970s moved beyond controversies of whether it was a brain disease or a social construct following studies of genetic and biological correlates. Intelligence research also now can move beyond skepticism of psychometrics to detailed explorations of individual differences in the brain. In fact, the cognitive problems associated with schizophrenia and the loss of cognitive abilities that characterizes dementia are the other side of the coin to understanding the neural basis of normal intelligence.
Most of the neuroimaging research on intelligence is in a nascent stage. As shown here, various image-acquisition methods are available, each with relative strengths and weaknesses. Similarly, various image-processing and statistical techniques also are available, each requiring different assumptions. The technical issues raised by each approach are quite numerous and complex and, therefore, were not detailed in this review. They include, for example, how best to correct for multiple comparisons, and how and when to correct for whole brain size. There are also different approaches to assessing intelligence, the g factor, and reasoning. Study designs also differ; some compare tasks that are differently related to intelligence measures, whereas others compare subjects who differ on intelligence measures.
Despite these issues, there is much neuroanatomical consistency among results, which we have described as defining a specific frontal/posterior network we term “the P-FIT model.” We emphasize that this is very much still a hypothesis and much additional research will be needed to further explicate the neural basis of intelligence. The provisional empirical support we have reviewed may become more compelling as new neuroimaging studies of intelligence are completed using much larger sample sizes, and which incorporate experimental research designs to help determine the relationships between the salient brain areas and the cognitive processes they enable or control. Many of the areas implicated by the P-FIT, for example, have been related to fundamental cognitive processes including working memory and attention (Cabeza & Nyberg Reference Cabeza and Nyberg2000; Chabris Reference Chabris and Roberts2006; Naghavi & Nyberg Reference Naghavi and Nyberg2005), although a comprehensive discussion of this literature is beyond the scope of this review.
It must also be noted that there are likely other brain regions critical to intelligence and the implementation of intelligent behavior, including regions identified in studies of discrete cognitive processes, such as the basal ganglia, thalamus, hippocampus, and cerebellum. Based on the research designs of the neuroimaging studies reviewed, we believe that the P-FIT regions are those in which individual differences account for intellectual performance, especially areas of association cortex which serve to integrate information among brain areas. That is to say, other brain regions are so critical to brain functioning in general that individual differences in chemical composition, diffusion anisotropy, volume, and blood flow are minimized to ensure reliability across fundamental functions. What the P-FIT likely represents are brain areas in which individual differences are expressed less encumbered by day-to-day housekeeping or maintenance operations. Such a differentiation is somewhat similar to one based on a systematic study of the effects of lesions on problem-solving performance in rats (Thompson et al. Reference Thompson, Crinella and Yu1990). Thompson et al. showed that six brain areas loaded on a g factor extracted from performance on many problem-solving tasks), whereas eight areas were important for performance on all problems. The former areas (parietal cortex, occipitotemporal cortex, posterior cingulate, dorsal hippocampus, posterolateral hypothalamus, superior colliculus) were termed necessary for “psychometric” intelligence; the latter eight areas (substantia nigra, ventral lateral thalamus, globus pallidus, dorsal caudatoputamen, median raphe area, superior colliculus, pontine reticular formation, ventral tegmental area) were termed “biological” intelligence (see also Haier Reference Haier and Detterman1993a).
Although we have chosen not to include data from EEG and MEG studies in this review due to space limitations, it is important to recognize that only by integrating the spatial localization provided by the studies reviewed herein with the temporal resolution possible with EEG/MEG, may we truly talk about “networks” in the brain underlying intelligence, reasoning, and higher cognitive functioning. For example, we have hypothesized that some activations within certain experimental paradigms might be “task dependent.” By integrating spatio-temporal information (e.g., simultaneous EEG-fMRI or cross-platform fMRI-MEG experiments) one might expect to see a clarification of the relationships between performance and brain function/structure both within and outside of the network identified in the P-FIT. Indeed, several newer studies are beginning to integrate fMRI with MEG information to exploit their relative spatial and temporal strengths (Huang et al. Reference Huang, Lee, Miller, Thoma, Hanlon, Paulson, Martin, Harrington, Weisend, Edgar and Canive2005). We would expect that the integration of spatial and temporal techniques will be an area of keen interest to intelligence research, as it may shed light upon the interactions of reaction time with g (Thoma et al. Reference Thoma, Yeo, Gangestad, Halgren, Davis, Paulson and Lewine2006), further our understanding of “neural efficiency” in the brain (Grabner et al. Reference Grabner, Neubauer and Stern2006), and may even outline productive genetic inquiries regarding mechanisms by which intelligence is manifested in the brain.
Although this review emphasizes the consistencies among studies, there are important inconsistencies and potential conflicts to resolve. For example, as noted by Haier et al. (Reference Haier, Jung, Yeo, Head and Alkire2004), higher intelligence appears to be related both to increased gray matter and to decreased GMR under certain conditions, the latter finding often interpreted as evidence of brain efficiency (Haier et al. Reference Haier, Siegel, Nuechterlein, Hazlett, Wu, Paek, Browning and Buchsbaum1988; Neubauer et al. Reference Neubauer, Fink and Schrausser2002). Brain efficiency (i.e., lower GMR in subjects with higher intelligence) may result because the availability of more gray (or white) matter resources in finite areas reduces the overall brain work required to address a specific problem. A related issue of great importance is whether gray matter increases as a result of practice and learning, as suggested in recent research (Draganski et al. Reference Draganski, Gaser, Kempermann, Kuhn, Winkler, Buchel and May2006). Such plasticity would challenge some of the relatively simple ideas about how the genetic contributions to intelligence may work, especially as a limiting factor, and lead to rethinking genetic determinism, as suggested by Silverman (Reference Silverman2004).
Another central issue of potential inconsistency relates to possible sex differences regarding the strength and/or applicability of the P-FIT. Indeed, our group of researchers has found that sex differences exist with regard to PET activations during mathematical reasoning (Haier & Benbow Reference Haier and Benbow1995), with respect to relative tissue volume correlates of intelligence (Haier et al. Reference Haier, Jung, Yeo, Head and Alkire2005), and with regard to the strength of chemical correlates of intelligence within frontal lobe white matter (Jung et al. Reference Jung, Haier, Yeo, Rowland, Petropoulos, Levine, Sibbitt and Brooks2005). Several other groups have noted sex differences related to intelligence and higher cognitive functioning (e.g., Gur et al. Reference Gur, Turetsky, Matsui, Yan, Bilker, Hughett and Gur1999; Pfleiderer et al. Reference Pfleiderer, Ohrmann, Suslow, Wolgast, Gerlach, Heindel and Michael2004). Sex differences were not noted in the recent Shaw et al. (Reference Shaw, Greenstein, Lerch, Clasen, Lenroot, Gogtay, Evans, Rapoport and Giedd2006) study of brain development and cortical thickness, although strong sex differences were found in our structural study of adults (Haier et al. Reference Haier, Jung, Yeo, Head and Alkire2005) and in Schmithorst and Holland's (2006) fMRI study of young people. Although most research shows no sex difference in FSIQ, there is some suggestion that there may be a small difference favoring males (Nyborg Reference Nyborg2005), so whether the P-FIT applies equally to both males and females is an open question, and we expect that the P-FIT will be modified as more data become available. At this point, it does appear that, across several studies and groups, the relationship of intelligence to white matter volumes, chemical composition, and perhaps water diffusivity may be higher in women than in men.
9. The future
In addition to age and sex analyses in larger samples, future studies should also use multiple measures of cognitive skill and intellectual ability so the g factor can be extracted separately from measures of general intelligence and from specific cognitive abilities. Finally, individual differences in intelligence measures among subjects must be studied as they relate to differences in brain characteristics not easily assessed with current technology, such as the size or efficiency of specific networks or characteristics of individual neurons (e.g., mitochondria activity). Once the relevant parameters are established, drug challenges to excite or inhibit specific pathways in combination with neuroimaging techniques may provide the experimental data necessary to identify specific neurochemical mechanisms that underlie intelligence (Mozley et al. Reference Mozley, Gur, Mozley and Gur2001). These studies may be particularly informative in groups defined by neurological conditions such as mental retardation, as well as for those in the normal range of intelligence. This new phase of research will move beyond the current correlational limitations of neuroimaging studies, which address questions of individual differences and of “where” in the brain is intelligence. Rather, this next generation of research will engage individual differences in a direct manner, perhaps articulating for the first time “how” intelligence evolved, how brain development influences intelligence, and how neurological and psychiatric diseases cause cognitive decline. As neuroimaging and molecular techniques advance, each generating hypotheses to inform the other, the scientific study of intelligence is poised to exceed the hopes of pioneers such as Spearman, Binet, and Halstead.
ACKNOWLEDGMENTS
This material is based upon work supported by the Department of Energy under Award Number DE-FG02-99ER62764 to The Mental Illness and Neuroscience Discovery (MIND) Institute. The authors would like to thank the International Society for Intelligence Research, which, in 2003, brought together researchers involved in neuroimaging of intelligence for the first time in Newport Beach, California, allowing us the opportunity to form a very productive collaboration.



