





Policy Significance Statement
Existing governance frameworks, from World Bank indicators to Sustainable Development Goal (SDG) monitoring, rarely capture the fiscal risks generated by measurement inaccuracy. The National Product Uncertainty Loss (NPUL) model addresses this critical blind spot by demonstrating how minor technical deviations accumulate into systemic economic loss, eroding institutional trust and weakening policy foresight in emerging economies. In Albania, NPUL acts as an anticipatory governance instrument, directly linking calibration and traceability quality to EU accession benchmarks, where credible data integrity is as essential as legal alignment. It operationalizes a clear proposition: measurement reliability is a precondition for fiscal legitimacy. NPUL advances the core concerns of Data & Policy by integrating trust, interoperability, and digital sovereignty into quantifiable economic indicators. By reframing GDP as both a measure of growth and a ledger of hidden loss, the framework positions measurement accuracy as a cornerstone of resilient governance across regions with fragmented data ecosystems. Recent scholarship underscores that transparent data governance and AI-driven accountability mechanisms are foundational to institutional credibility. By embedding these principles, NPUL turns measurement science from a technical function into a strategic enabler of evidence-based reform and AI-assisted fiscal governance. Without such a framework, governments continue to underestimate fiscal exposure and design reforms without full visibility into the economic impacts of data unreliability.
1. Introduction
Public policies increasingly depend on the credibility of quantitative evidence. In data-driven governance systems, economic indicators shape fiscal expectations, regulatory enforcement, and institutional trust. Gross Domestic Product (GDP) remains the dominant benchmark of economic performance; however, its interpretative authority depends on the reliability, coherence, and traceability of the measurements embedded in national accounts. When measurement systems are weakly calibrated or fragmented, indicators may appear precise while concealing underlying governance risks, leading to fiscal misallocation and reduced public trust (OECD, 2019).
These concerns intersect with the “Beyond GDP” debate, which questions the capacity of conventional indicators to capture structural vulnerabilities and institutional performance (Stiglitz et al., Reference Stiglitz, Sen and Fitoussi2010; Costanza et al., Reference Costanza, Kubiszewski, Giovannini, Lovins, McGlade, Pickett, Ragnarsdóttir, Roberts, De Vogli and Wilkinson2016; OECD, 2020). At the same time, research in digital governance shows that policy legitimacy increasingly depends on the credibility of data infrastructures and measurement systems (Zuiderwijk and Hinnant, Reference Zuiderwijk and Hinnant2020; Kitchin, Reference Kitchin2021). Recent contributions in Data & Policy emphasize that trustworthy data systems are foundational to governance legitimacy and accountability (Kitchin and Lauriault, Reference Kitchin and Lauriault2022). However, while these strands challenge what GDP measures, they pay limited attention to how reliably GDP itself is measured.
This study addresses this gap by introducing the National Product Uncertainty Loss (NPUL) model, a governance-oriented framework that integrates metrological uncertainty into macroeconomic interpretation. The model quantifies how unverified or weakly calibrated measurements embedded in sectoral GDP components generate hidden fiscal risks that remain unaccounted for in conventional indicators. Its methodological logic is based on sector-specific measurement efficiency coefficients (ε m,i) and calibration alignment parameters (α i), linking technical uncertainty with macroeconomic governance performance (JCGM, 2008).
The empirical analysis focuses on Albania as a critical case study, complemented by comparative insights from Western Balkan economies (European Commission, 2023). Preliminary results suggest that calibration gaps may generate measurable deviations in national output, consistent with evidence on the role of quality infrastructure (UNIDO and Sida, 2023; World Bank, 2023). Rather than proposing an alternative metric, NPUL strengthens the interpretability of GDP by integrating measurement uncertainty into economic governance.
2. Methodological framework
This study adopts a governance-oriented methodological perspective that integrates measurement uncertainty into the interpretation of macroeconomic indicators. Rather than treating statistical error as a purely technical limitation, the framework conceptualizes uncertainty as an institutional variable influencing fiscal credibility, regulatory predictability, and policy effectiveness. Recent research in data governance highlights that the reliability of economic statistics depends on the traceability and quality assurance of underlying measurement systems (Kitchin, Reference Kitchin2021; European Commission, 2023). Within this context, the proposed approach bridges metrological principles with macroeconomic analysis to capture latent risks embedded in policy-relevant data.
The National Product Uncertainty Loss (NPUL) model is developed as a complementary analytical layer applied to conventional GDP accounting. Conceptually grounded in uncertainty theory and quality-infrastructure research (Pendrill, Reference Pendrill2019; OECD, 2022), the model estimates how sector-level measurement deviations propagate into systemic fiscal distortions. By assigning sector-specific measurement efficiency coefficients (ε m,i) and calibration alignment parameters (α i), the framework operationalizes how unverified measurements generate hidden governance risks when interpreted as stable economic signals.
Methodologically, the model draws on uncertainty propagation principles articulated in the Guide to the Expression of Uncertainty in Measurement (JCGM, 2008), extending their application to macroeconomic interpretation. In contrast to standard assumptions of measurement consistency, empirical evidence shows that weaknesses in calibration governance introduce structural bias into economic indicators (Salicone and Jetti, Reference Salicone and Jetti2022).
The empirical design follows a case-study strategy centered on Albania and complemented by comparative insights from Western Balkan economies (Yin, Reference Yin2018). Albania is selected as a critical case study where measurement deficiencies are sufficiently pronounced to enable analytical observation of their impact on fiscal reliability and governance performance. Particular attention is given to measurement-intensive sectors such as energy, healthcare, construction, and hydrocarbons (UNIDO and Sida, 2023; World Bank, 2023).
Within this framework, NPUL functions as a dual analytical lens, revealing both recorded output and hidden losses associated with uncertainty-affected data, thereby strengthening the interpretability of GDP as a governance instrument.
2.1. Conceptual foundations of measurement-driven governance risk
The methodological logic of the NPUL model is grounded in the premise that macroeconomic indicators are not neutral statistical aggregates, but institutional constructs shaped by measurement practices, calibration regimes, and data governance arrangements. Within this perspective, GDP is interpreted as a composite of measured quantities whose credibility depends on the reliability and traceability of underlying measurement systems. Measurement uncertainty is thus conceptualized not only as a technical limitation, but as a latent governance risk influencing fiscal projections, regulatory decisions, and market expectations (Stiglitz et al., Reference Stiglitz, Fitoussi and Durand2018; Kitchin, Reference Kitchin2021).
The NPUL framework operationalizes this premise through sector-specific measurement efficiency coefficients (ε m,i) and a systemic calibration alignment parameter (α i). These parameters capture both the extent of deviation from traceable measurement conditions and the degree to which such deviations propagate into macroeconomic aggregates. In doing so, the model translates metrological variability into a quantifiable governance variable, enabling the estimation of hidden fiscal exposure associated with technically uncertain data (Janssen and van den Hoven, Reference Janssen and van den Hoven2022; OECD, 2022).
Unlike conventional uncertainty approaches confined to laboratory settings (JCGM, 2008), NPUL evaluates the institutional relevance of measurement uncertainty by linking sectoral measurement practices to broader economic outcomes. Empirical evidence shows that weaknesses in calibration governance can introduce structural bias into economic indicators and undermine fiscal credibility (Pendrill, Reference Pendrill2019; OECD, 2023; World Bank, 2023).
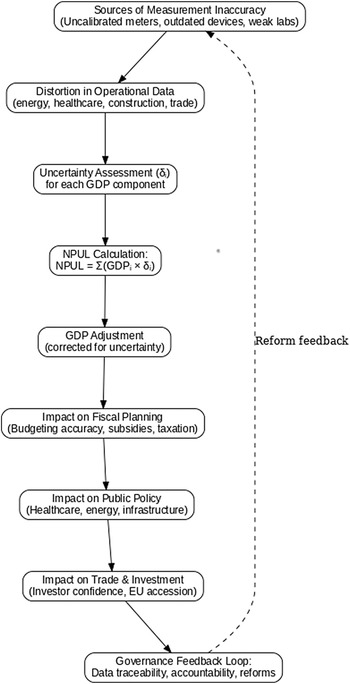
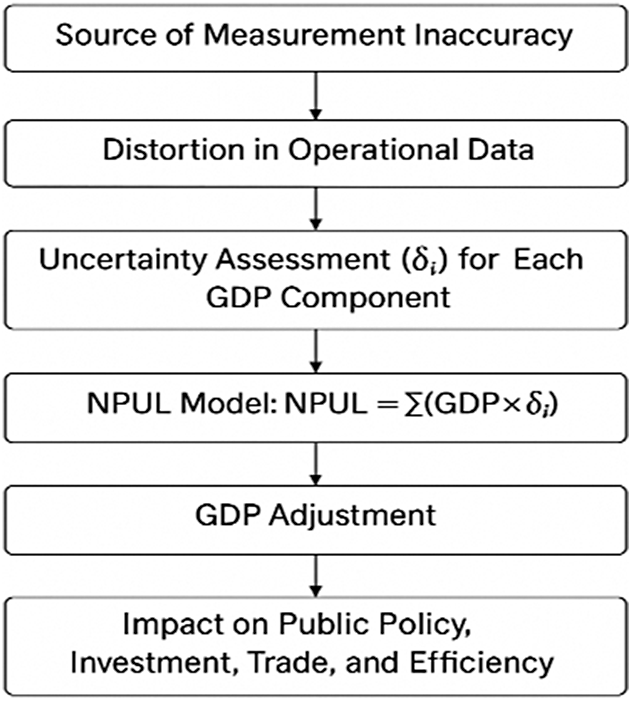
At its core, NPUL functions as a dual analytical lens, capturing both recorded economic output and the hidden losses associated with uncertainty-affected data across GDP components (C, I, G, X, M). This approach reframes data reliability as an economic variable, linking measurement conditions directly to governance performance. The transmission mechanism from technical uncertainty to fiscal risk is illustrated in Figure 1.
Dual-layer NPUL framework: from technical uncertainty to fiscal risk. Note: The figure presents the NPUL conceptual framework, where measurement inaccuracies are captured through measurement efficiency (εm,i) and calibration alignment (αi) and propagated across GDP components (C, I, G, X, M). These generate NPUL estimates that reveal hidden fiscal exposure, while the feedback loop illustrates how improved calibration and data governance reduce systemic risk and strengthen institutional credibility. Source: Author’s elaboration based on the NPUL conceptual framework developed in this study.

Figure 1. Long description
The flowchart consists of nine sequential nodes connected by solid downward arrows, with a final dashed arrow returning to the start.
* The first node at the top is Sources of Measurement Inaccuracy including uncalibrated meters, outdated devices, and weak labs.
* The second node is Distortion in Operational Data across energy, healthcare, construction, and trade.
* The third node is Uncertainty Assessment delta for each G D P component.
* The fourth node is N P U L Calculation where N P U L equals the summation of G D P sub i times delta sub i.
* The fifth node is G D P Adjustment corrected for uncertainty.
* The sixth node is Impact on Fiscal Planning affecting budgeting accuracy, subsidies, and taxation.
* The seventh node is Impact on Public Policy regarding healthcare, energy, and infrastructure.
* The eighth node is Impact on Trade and Investment concerning investor confidence and E U accession.
* The ninth node at the bottom is Governance Feedback Loop focusing on data traceability, accountability, and reforms.
A dashed line labeled Reform feedback originates from the Governance Feedback Loop and points back to the initial Sources of Measurement Inaccuracy node, completing the cycle.
2.2. Structure of the NPUL analytical model
Within the NPUL approach, national output is interpreted as a composite function of sectoral economic contributions conditioned by measurement reliability and data-governance arrangements. In this perspective, Gross Domestic Product (GDP) is treated not as a fixed statistical aggregate, but as a measurement-dependent construct whose interpretability is shaped by calibration quality, traceability, and verification practices (Stiglitz et al., Reference Stiglitz, Fitoussi and Durand2018; OECD, 2022).
Formally, the NPUL model is defined at the macro level as:

where GDPtotal represents total national output, ε m denotes measurement efficiency reflecting the extent to which statistical systems capture calibrated and traceable values, and α i captures systemic calibration alignment, expressing the degree of institutional coherence in applying metrological standards. This formulation follows the analytical structure detailed in the NPUL technical supplement and ensures consistency between macroeconomic aggregates and measurement conditions.
At the sectoral level, the model is extended as:

where GDPi denotes sectoral output, ε m,i represents sector-specific measurement efficiency, and α i captures sectoral calibration alignment. This dual-level formulation allows the model to trace how localized measurement deviations propagate into aggregate economic outcomes.
Conceptually, this structure enables NPUL to interpret measurement uncertainty as a structural multiplier of hidden fiscal risk rather than as an isolated statistical variance. While conventional macroeconomic accounting assumes data inputs are sufficiently robust, research in data governance and digital statistical systems suggests that weak measurement infrastructures may generate cumulative distortions that affect fiscal credibility and policy effectiveness (Kitchin, Reference Kitchin2021; Janssen and van den Hoven, Reference Janssen and van den Hoven2022).
Operationally, the model evaluates how deviations in measurement efficiency and calibration alignment interact across sectors to influence GDP interpretation. The parameter α i is particularly relevant in transitional governance environments, where institutional responses to uncertain data, including precautionary budgeting, delayed investment decisions, and adaptive regulatory behavior, may amplify the macroeconomic impact of measurement inaccuracies (Andrews et al., Reference Andrews, Pritchett and Woolcock2020; European Commission, 2023).
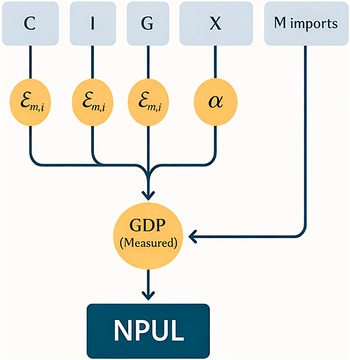
In this sense, NPUL functions as a governance-oriented analytical instrument that translates technical uncertainty into traceable fiscal-risk signals. Figure 2 illustrates the transmission mechanism linking sectoral measurement deviations to macroeconomic reliability outcomes.
Analytical structure of the NPUL model: from measurement efficiency to fiscal risk. Note: The figure presents the NPUL equation logic, where sectoral measurement efficiency (εm,i) and calibration alignment (αi) are applied across GDP components (C, I, G, X, M) to assess how measurement conditions affect aggregate output and generate hidden fiscal exposure. Source: Author’s elaboration based on the analytical structure of the NPUL model developed in this study.

2.3. Sectoral uncertainty mapping and data architecture
Sectoral measurement efficiency coefficients (ε m,i) are estimated through a triangulated procedure combining calibration traceability records, conformity-assessment evidence, and institutional quality-infrastructure indicators documented in the NPUL supplementary dataset. This approach reflects established metrological principles, where measurement reliability depends on calibration continuity, laboratory accreditation, and verification coverage across measurement-intensive sectors (JCGM, 2008; Pendrill, Reference Pendrill2019).
Empirical inputs are structured across three analytical levels. At the micro level, measurement instruments and monitoring systems generate data subject to calibration variability. At the meso level, verification regimes, including accreditation and regulatory audits, determine data credibility and comparability (OECD, 2022; World Bank, 2023). At the macro level, these data are aggregated into national accounts, shaping fiscal interpretation. Within this architecture, NPUL models how deviations in measurement efficiency and calibration alignment propagate across levels, influencing macroeconomic reliability (Kitchin, Reference Kitchin2021; European Commission, 2023).
This approach links measurement conditions to institutional performance by integrating sectoral coefficients (ε m,i) and calibration alignment (α i) into GDP structures, enabling the identification of hidden fiscal vulnerabilities.
By modeling uncertainty as a structural variable, the approach links measurement reliability to fiscal predictability, regulatory confidence, and investment expectations. Figure 3 illustrates this transmission mechanism from measurement conditions to macroeconomic interpretation.
Sectoral measurement-uncertainty architecture with the NPUL framework. Note: The figure illustrates the NPUL measurement architecture, where sectoral measurement efficiency (ε m,i) and calibration alignment (α i) shape the transformation of measurement data into macroeconomic indicators. Resulting deviations propagate through verification and statistical aggregation processes, influencing the reliability of GDP-based policy interpretation. Source: Author’s elaboration based on the NPUL measurement-uncertainty architecture developed in this study.

Figure 3. Long description
The pyramid is divided into four horizontal layers connected by upward-pointing arrows.
* At the base is the Primary Measurement Systems layer, which includes a sub-section for Sectoral uncertainty (delta sub i). Above this are icons representing Energy metering, Healthcare diagnostics, Construction quantities, Hydrocarbon volumes, Trade measurement, and Trade systems.
* The second layer is the Traceability and Calibration Chain, which lists Calibration laboratories, Accreditation systems, Verification procedures, and Statistical validation mechanisms.
* The third layer is G D P Component Interpretation, which lists Consumption (C), Investment (I), Government expenditure (G), Exports (X), and Imports (M). An arrow labeled Aggregation effect points upward within this section.
* The apex is Macro-Fiscal Governance Outcomes. To the right of the apex, a graphic of a government building and a document is accompanied by text describing Hidden fiscal exposure, Distorted budget signals, and Regulatory uncertainty leading to reduced investor confidence and credibility.
* Upward arrows between each layer indicate the propagation of measurement data and uncertainty from the technical base to the macroeconomic policy level.
The architecture in Figure 3 illustrates how measurement deviations translate into governance-relevant macroeconomic signals. By linking measurement conditions with institutional verification and statistical aggregation, the NPUL framework clarifies the transmission pathway through which uncertainty affects fiscal interpretation and policy coordination. This perspective highlights that the credibility of economic indicators depends not only on statistical computation, but also on the robustness of calibration and verification systems, particularly in transitional governance environments.
2.4. Baseline parameter selection and sensitivity assumptions
The baseline parameter configuration of the NPUL model is established through a transparent analytical procedure combining sectoral calibration evidence, institutional quality-infrastructure indicators, and sensitivity simulations documented in the NPUL supplementary dataset. Sector-specific measurement efficiency coefficients (ε m,i) are derived from calibration traceability coverage, verification practices, and instrument conditions in measurement-intensive sectors, in line with established metrological guidance (JCGM, 2008; Pendrill, Reference Pendrill2019) and recent evidence on the economic role of quality infrastructure (UNIDO and Sida, 2023; World Bank, 2023).
The systemic sensitivity parameter (α i) captures the extent to which sectoral measurement conditions propagate into macroeconomic interpretation. Rather than a purely statistical coefficient, α i is operationalized as a policy-transmission parameter reflecting how measurement uncertainty influences fiscal projections, regulatory decisions, and institutional trust (Kitchin, Reference Kitchin2021; Janssen and van den Hoven, Reference Janssen and van den Hoven2022).
Baseline values for ε m,i and α i are derived from observed calibration coverage, institutional verification data, and conservative scenario assumptions, ensuring empirical grounding. Sensitivity analysis is conducted by varying these parameters within bounded intervals to simulate alternative governance conditions, including improved calibration regimes and reduced traceability gaps.
This approach does not aim to estimate laboratory-level error precisely, but to reveal the magnitude and direction of hidden fiscal risk embedded in technically uncertain economic data.
2.5. Institutional operationalization of NPUL (governance embedding)
Embedding the NPUL framework within economic governance requires a clearly defined institutional architecture capable of translating measurement reliability into operational policy instruments. In this study, the Albanian quality-infrastructure ecosystem is examined as a pilot configuration through which the analytical logic of NPUL can be institutionally anchored. The selection of five public agencies reflects their functional role within the measurement–verification–policy nexus rather than institutional uniqueness. This configuration is not presented as a unique national arrangement, but as a replicable governance architecture applicable to similar institutional environments undergoing transition and EU convergence processes (OECD, 2022; European Commission, 2023).
The Directorate of Metrology (DPM) provides the technical foundation by generating sector-specific measurement efficiency coefficients (ε m,i) through calibration and measurement audits. The Directorate of Accreditation (DA) ensures international traceability through ISO/IEC 17025, ISO/IEC 15189, and ISO/IEC 17020 frameworks, linking national practices to globally recognized standards (JCGM, 2008; Pendrill, Reference Pendrill2019).
At the governance interface, the Public Procurement Agency (APP) integrates NPUL parameters into procurement oversight, while the National Agency for Information Society (AKSHI) enables their digital integration within public data systems. The Directorate of Standardization (DPS) ensures alignment with European standards and acquis-related requirements (Kitchin, Reference Kitchin2021; Janssen and van den Hoven, Reference Janssen and van den Hoven2022).
Together, these institutions form a coordinated governance architecture through which measurement uncertainty is translated into policy-relevant risk signals, supporting fiscal reliability, regulatory coherence, and EU convergence. Figure 4 illustrates this institutional interaction.
Institutional compass of the NPUL framework. Note: The figure illustrates the institutional embedding of the NPUL model within a coordinated quality-infrastructure ecosystem. Metrology (DPM), Accreditation (DA), Standardization (DPS), Digital Governance (AKSHI), and Public Procurement (APP) jointly form a governance architecture through which measurement reliability is translated into fiscal integrity, regulatory coherence, and alignment with European Union policy frameworks. Source: Author’s elaboration based on the NPUL institutional governance framework integrating metrology, accreditation, standardization, digital governance, and public procurement.

International experience, particularly from advanced quality-infrastructure systems such as Japan, indicates that measurement reliability and calibration capacity are critical institutional enablers of effective policy design and macroeconomic stability.
2.6. Operationalization, scalability, and transferability of NPUL
Although first implemented in Albania, the NPUL architecture is designed for scalability across emerging economies confronting similar patterns of data fragmentation and weak quality infrastructure. In many regions, including the Western Balkans, Africa, Central Asia, and Latin America, measurement gaps, uncalibrated instruments, and fragmented statistical systems undermine fiscal reliability and policy foresight (UNESCO, 2021; United Nations, 2025). By quantifying hidden distortions and translating them into fiscal-risk indicators, NPUL establishes a transferable analytical framework adaptable to diverse institutional contexts. The model aligns with global governance agendas, including the OECD transparency framework, UNIDO’s “Metrology for Development” initiative, and the European Union’s Data Governance Act, operationalizing principles such as trust, interoperability, and traceability into measurable economic variables (European Commission, 2023; OECD, 2023). Figure 5 illustrates this progression from a national pilot to a scalable framework, situating Albania as an initial implementation case and mapping potential regional and global expansion pathways.
NPUL scalability map: from Albania pilot to global implementation. Note: The map situates Albania as the NPUL pilot case, extending through regional cooperation in the Western Balkans and broader transfer to Africa, Central Asia, and Latin America. It highlights the model’s adaptability and contribution to global data governance. Source: Author’s elaboration based on the NPUL scalability and transferability framework developed in this study.

Operationally, the NPUL model follows a structured analytical process that links metrological integrity to fiscal and governance outcomes. The framework is implemented through the following interconnected stages:
-
1. Identification of sectoral data flows: mapping GDP components (C, I, G, X, M) and identifying the measurement systems and institutional sources that generate them.
-
2. Calibration and measurement efficiency assessment: deriving sector-specific measurement efficiency coefficients (ε m,i) based on calibration traceability, institutional verification practices, and standards compliance, including ISO/IEC 17025, ISO 15189, ISO/IEC 17020, and EURAMET guidance (JCGM, 2008; EURAMET, 2022).
-
3. Application of the NPUL Model: computing NPUL through the integrated formulation NPUL = Σ (GDPi × ε m,i × α i), where ε m,i captures measurement efficiency and α i reflects systemic calibration alignment, ensuring consistency with the formal model specification.
-
4. Translation into fiscal-risk indicators: converting NPUL outputs into policy-relevant metrics, including adjusted budget baselines, procurement-risk indicators, and uncertainty-informed fiscal projections.
-
5. Integration into governance cycles: embedding NPUL indicators into budgeting processes, procurement oversight mechanisms, and EU convergence frameworks, transforming measurement uncertainty into a visible and actionable governance variable.
This structured process ensures that NPUL remains technically rigorous, institutionally grounded, and policy-relevant. By linking data reliability to fiscal credibility, this approach establishes a continuous feedback loop between measurement systems, economic indicators, policy outcomes, and institutional systems (PTB, 2022; OECD, 2023). In this perspective, NPUL does not replace GDP, but strengthens its interpretability by revealing the measurement conditions that underpin its credibility. Figure 6 illustrates NPUL as a conceptual bridge between scientific measurement and governance application, showing how data reliability evolves into fiscal credibility and institutional trust.
From data trust to fiscal credibility: NPUL as a bridge between science and governance. Note: The figure illustrates how NPUL links data trust, interoperability, and measurement reliability with fiscal outcomes such as credibility, policy legitimacy, and EU convergence. It highlights the role of measurement integrity as a foundation for governance performance. Source: Author’s elaboration based on the NPUL framework linking measurement reliability, data trust, and fiscal governance.

2.7. Methodological workflow
The NPUL model is implemented through a structured analytical workflow designed to ensure methodological transparency and reproducibility. The process consists of five sequential stages:
-
1. Parameter definition: identification of sector-specific measurement efficiency (ε m,i) and calibration alignment (α i) based on observed measurement conditions;
-
2. Sectoral mapping: allocation of GDP components (C, I, G, X, M) to measurement-intensive sectors;
-
3. Coefficient estimation: derivation of sectoral parameters using calibration coverage, traceability evidence, and institutional verification data;
-
4. Scenario simulation: evaluation of baseline and alternative parameter configurations to assess uncertainty propagation;
-
5. Policy translation: conversion of NPUL outputs into fiscal-risk indicators relevant for governance and policy design.
This workflow clarifies the operational logic of the model, linking parameter selection, data structure, and simulation outputs within a coherent analytical process. It ensures that NPUL remains empirically grounded, analytically consistent, and directly applicable to governance contexts.
3. From framework to empirical application and policy contribution
The NPUL framework moves beyond conceptual formulation to empirical application. In Albania and across the Western Balkans, sustained underinvestment in quality infrastructure has contributed to measurement inconsistencies and data fragmentation. NPUL provides an analytical approach for examining how measurement conditions influence macroeconomic interpretation. Applied to sectors, such as energy, healthcare, and construction, the model estimates GDP deviations associated with sector-specific measurement efficiency coefficients (ε m,i) and calibration alignment parameters (α i).
The analysis draws on sectoral parameters and scenario-based simulations from national data and the NPUL dataset. This enables identification of baseline output deviations under conservative assumptions, illustrating how measurement inefficiencies propagate into macroeconomic indicators and affect fiscal reliability. These findings align with recent evidence linking data quality and measurement reliability to macroeconomic performance and fiscal transparency (World Bank, 2023; IMF, 2024).
By embedding the economic cost of measurement inaccuracy into macroeconomic interpretation, NPUL departs from conventional development indicators that implicitly assume data reliability. Instead, it positions measurement reliability as a structural determinant of governance performance (Kitchin, Reference Kitchin2021; Janssen and van den Hoven, Reference Janssen and van den Hoven2022). This perspective is reinforced by international policy literature demonstrating that investments in metrology contribute to economic resilience, fiscal transparency, and investor trust (UNESCO, 2021; OECD, 2023; IMF, 2024).
3.1. Empirical results, regional comparison, and policy implications
The empirical application of the NPUL framework demonstrates that fiscal distortions in emerging economies may originate not only from macroeconomic shocks, but also from persistent measurement inefficiencies embedded in routine statistical systems. Using Albania as a pilot case, the model estimates GDP deviations based on sector-specific measurement efficiency coefficients (ε m,i) and calibration alignment parameters (α i), derived from sectoral data and scenario-based simulations. Under conservative baseline assumptions, these deviations correspond to a measurable share of national output, while upper-bound scenarios indicate that cumulative sectoral losses may approach ~0.3–0.4 percent of GDP, highlighting the macroeconomic relevance of calibration and traceability gaps (IMF, 2024).
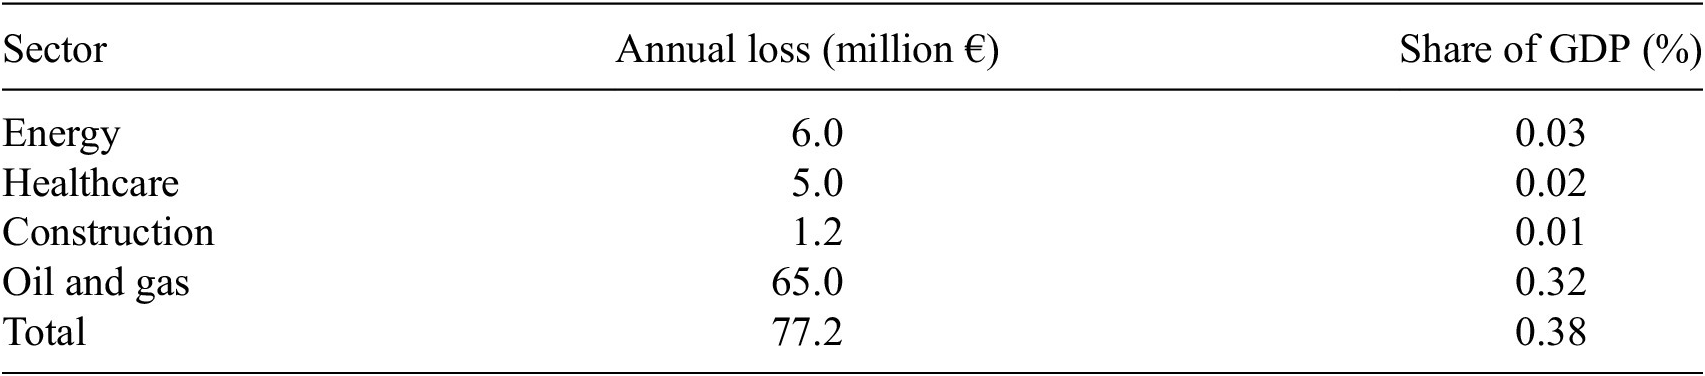
At the sectoral level, the results reveal concentrated and policy-relevant patterns. In the energy sector, even minor measurement biases across high-volume output translate into substantial annual financial discrepancies (INSTAT and OSHEE, 2023). In hydrocarbons, incomplete verification of fuel quantities generates recurrent leakage; in healthcare, noncalibrated diagnostic systems are associated with inefficiencies in treatment pathways (WHO, 2022); and in construction, the use of nonaccredited measurement instruments correlates with budget overruns and project inconsistencies. These findings suggest that measurement deficiencies are not isolated technical problems, but indicators of institutional fragility with direct fiscal implications (Table 1).
Estimated economic losses by sector (Albania)

Table 1. Long description
The table consists of three columns: Sector, Annual loss in million Euro, and Share of G D P in percentage.
* Energy: 6.0 million Euro, 0.03 percent of G D P.
* Healthcare: 5.0 million Euro, 0.02 percent of G D P.
* Construction: 1.2 million Euro, 0.01 percent of G D P.
* Oil and gas: 65.0 million Euro, 0.32 percent of G D P.
* Total: 77.2 million Euro, 0.38 percent of G D P.
The source is listed as Author's calculations based on I N S T A T 2023, P T B 2022, W H O 2022, U N I D O and Sida 2023, and D P M 2023. A note indicates these figures represent a baseline scenario where cumulative sectoral deviations correspond to approximately 0.38 percent of G D P.
Source: Author’s calculations based on INSTAT (2023), PTB (2022), WHO (2022), UNIDO and Sida (2023), and DPM (2023).
Note. This table reflects the baseline scenario used in the empirical application, where cumulative sectoral deviations correspond to ~0.38% of GDP. The upper-bound scenario (1–2.2 percent GDP deviation) is treated as a stress-test estimate under adverse parameterization.
By translating these distortions into quantifiable indicators, NPUL connects measurement reliability directly to policy credibility. Embedding such indicators into national budgeting, procurement oversight, and macroeconomic forecasting enables a transition from reactive administration to anticipatory, evidence-based governance aligned with EU fiscal and data-governance standards (OECD, 2023; European Commission, 2024).
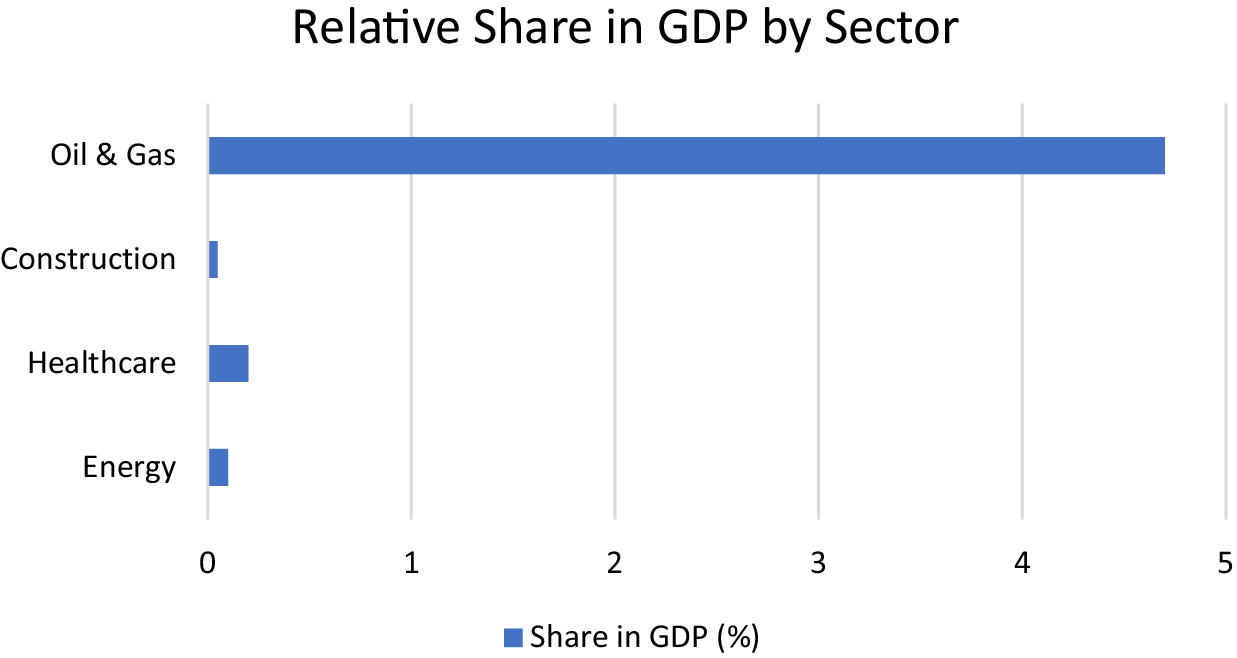
At the regional level, comparative analysis across Western Balkan economies reveals similar structural patterns. Fragmented metrological systems, uneven calibration coverage, and under-resourced laboratories contribute to reduced statistical comparability and weakened fiscal foresight. As illustrated in Figure 7, sectors with high measurement intensity, particularly energy, healthcare, and manufacturing, exhibit the highest exposure to uncertainty-related GDP distortions, underscoring the systemic nature of measurement risk.
Sectoral impact of measurement uncertainty on GDP loss in Albania and the Western Balkans. Note: The figure presents the asymmetric GDP losses linked to measurement inaccuracies. Energy, healthcare, and manufacturing bear the largest burdens, reflecting persistent calibration and traceability gaps. Source: Author’s elaboration (2025) based on EURAMET (2022) and UNIDO and Sida (2023).

These sectoral findings clarify that underinvestment in quality infrastructure does not merely affect technical compliance; it also shapes the credibility of fiscal planning and public decision-making. Further analytical integration demonstrates how sector-specific measurement efficiency (ε m,i) and calibration alignment (α i) propagate through GDP components, including consumption (C), investment (I), government expenditure (G), exports (X), and imports (M). When aggregated through the NPUL framework, these deviations reveal a previously unobserved layer of fiscal vulnerability embedded within conventional GDP accounting. In this sense, NPUL functions both as an analytical engine and a decision-support tool, identifying priority areas where investments in calibration infrastructure may yield the highest institutional return (ISO, 2017; EURAMET, 2022) (Figure 8).
From measurement uncertainty to GDP correction: the NPUL Framework. Note: The figure shows how sector-specific measurement efficiency (ε m,i) and calibration alignment (α i) propagate through GDP components, affecting macroeconomic interpretation and revealing hidden fiscal exposure. Source: Author’s elaboration based on the NPUL methodological framework linking measurement uncertainty to macroeconomic interpretation and fiscal-risk assessment.

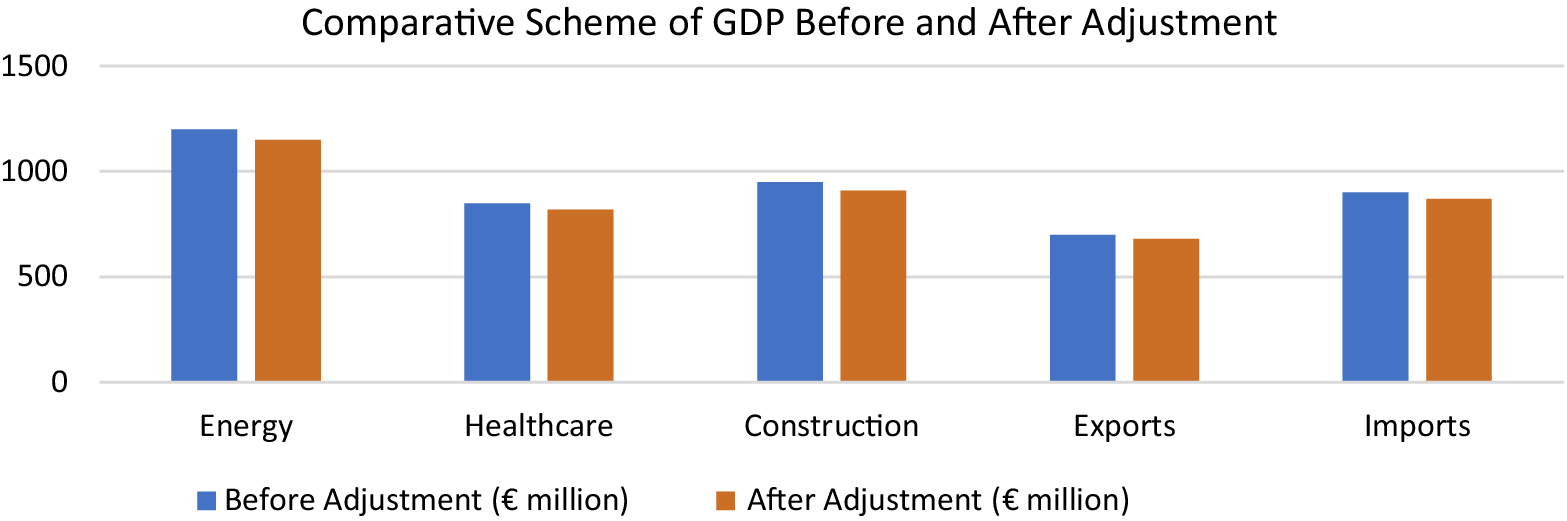
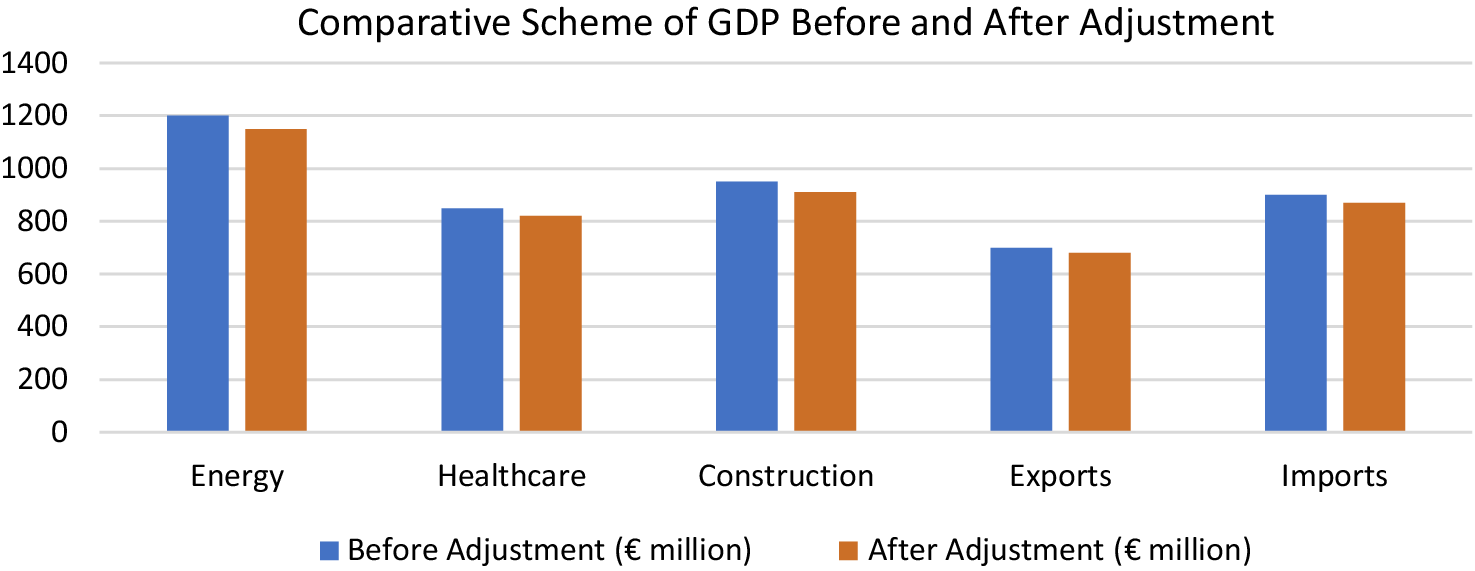
The regional comparison also gains further support from Figure 9, which visualizes nominal and NPUL-adjusted GDP across selected sectors. The visible reduction between pre-adjustment and adjusted values quantifies the fiscal burden of uncalibrated data and reinforces the model’s value as a fiscal risk-diagnostic tool. These patterns are consistent with broader evidence on the economic consequences of weak statistical and metrological systems (World Bank, 2023; EBRD, 2024).
Sectoral GDP adjustment under the NPUL framework. Note: This figure compares nominal GDP with NPUL-adjusted GDP across five macroeconomic sectors: energy, healthcare, construction, exports, and imports. The contrast between pre-adjustment and adjusted values illustrates how technical inaccuracies aggregate into measurable distortions at the national level. Source: Author’s elaboration (2025) based on INSTAT (2023), PTB (2022), EURAMET CG-11 (2022), UNIDO and Sida (2023), and World Bank (2023).

Figure 9. Long description
The chart is titled Comparative Scheme of G D P Before and After Adjustment. The Y axis represents value in Euro millions with increments of 500 from 0 to 1500. The X axis lists five sectors from left to right. Each sector has two adjacent bars: a blue bar for Before Adjustment and an orange bar for After Adjustment.
* Energy: The blue bar is at approximately 1200 and the orange bar is slightly lower at approximately 1150.
* Healthcare: The blue bar is at approximately 850 and the orange bar is slightly lower at approximately 820.
* Construction: The blue bar is at approximately 950 and the orange bar is slightly lower at approximately 910.
* Exports: The blue bar is at approximately 700 and the orange bar is slightly lower at approximately 680.
* Imports: The blue bar is at approximately 900 and the orange bar is slightly lower at approximately 870.
Across all categories, the N P U L adjustment results in a consistent downward shift in G D P valuation.
Taken together, the empirical and regional findings highlight the potential for policy convergence through shared calibration programs, regional proficiency testing schemes, and harmonized uncertainty-reporting frameworks. These initiatives, already promoted by EURAMET (2022) and UNIDO (2024), provide a pathway for strengthening data comparability and enhancing fiscal transparency across the Western Balkans.
Overall, the results demonstrate that measurement reliability constitutes a foundational component of economic governance. By integrating metrological accuracy into fiscal systems, NPUL enables policymakers to identify hidden inefficiencies, strengthen institutional trust, and align national economic frameworks with European integration objectives. In this context, precision is not merely a technical attribute, but a core principle of fiscal integrity and democratic accountability.
3.2. Implications for EU integration and policy reform
In Albania and across the Western Balkans, weaknesses in metrological governance constitute a structural constraint on fiscal performance. Limited traceability, inconsistent verification practices, and fragmented institutional coordination introduce systematic uncertainty into economic data, reducing the reliability of macroeconomic indicators. Evidence from the Albanian Supreme Audit Institution (KLSH, 2022) indicates that such deficiencies contribute to inefficiencies in budget execution and weaken the effectiveness of public investment.
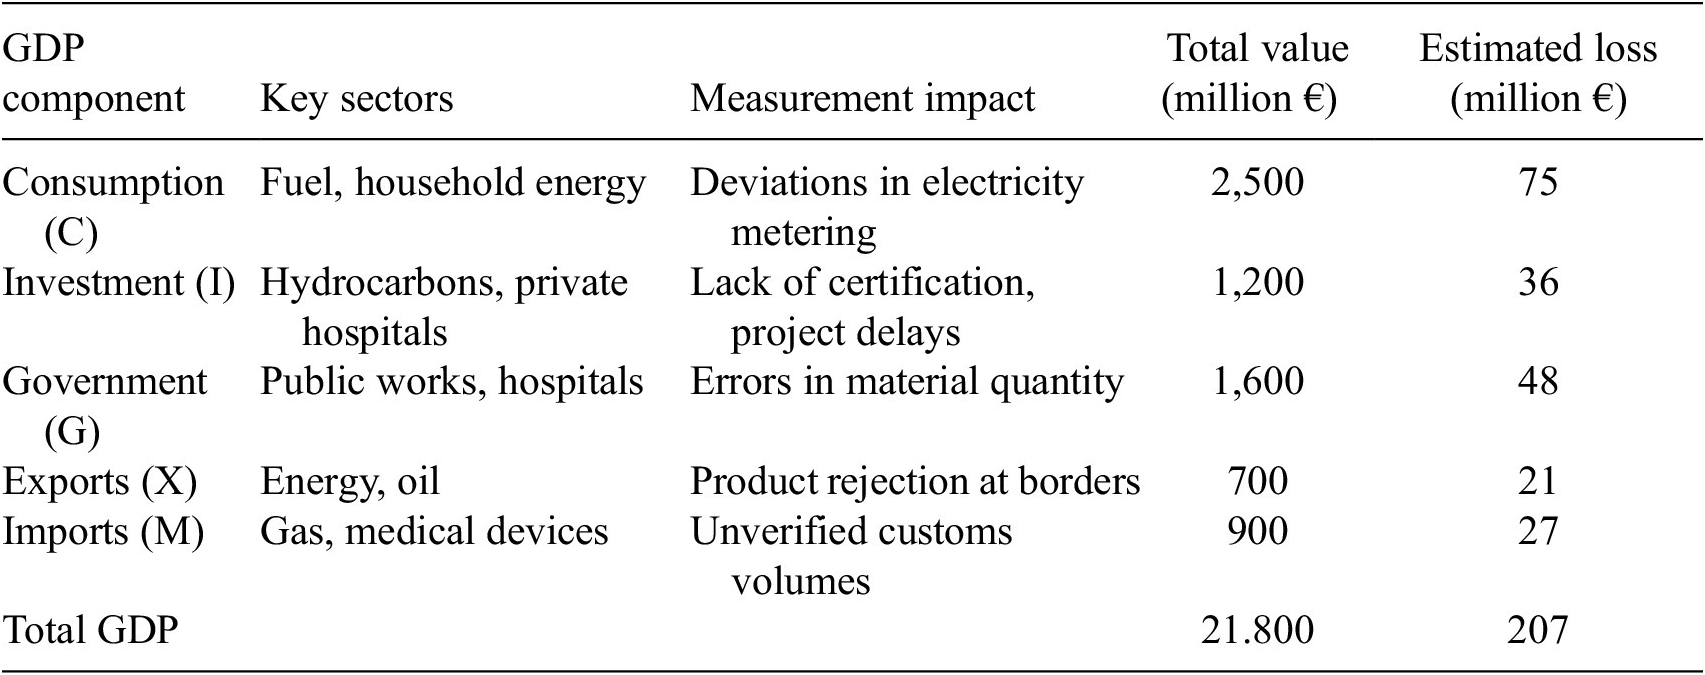
Within this context, the NPUL framework provides a structured mechanism for integrating measurement reliability into fiscal interpretation. As defined in Section 2, sectoral measurement efficiency (ε m,i) and calibration alignment (α i) are aggregated to estimate the scale of hidden fiscal exposure embedded in national accounts. Applied to Albania, the model identifies ~200 million € in potential annual GDP deviation, concentrated in energy, healthcare, and industrial production (PTB, 2022; INSTAT, 2023; UNIDO and Sida, 2023). These estimates indicate that measurement conditions materially affect the interpretability of economic performance (Table 2).
Estimated economic impact of measurement inaccuracies across GDP components (Albania, 2023)
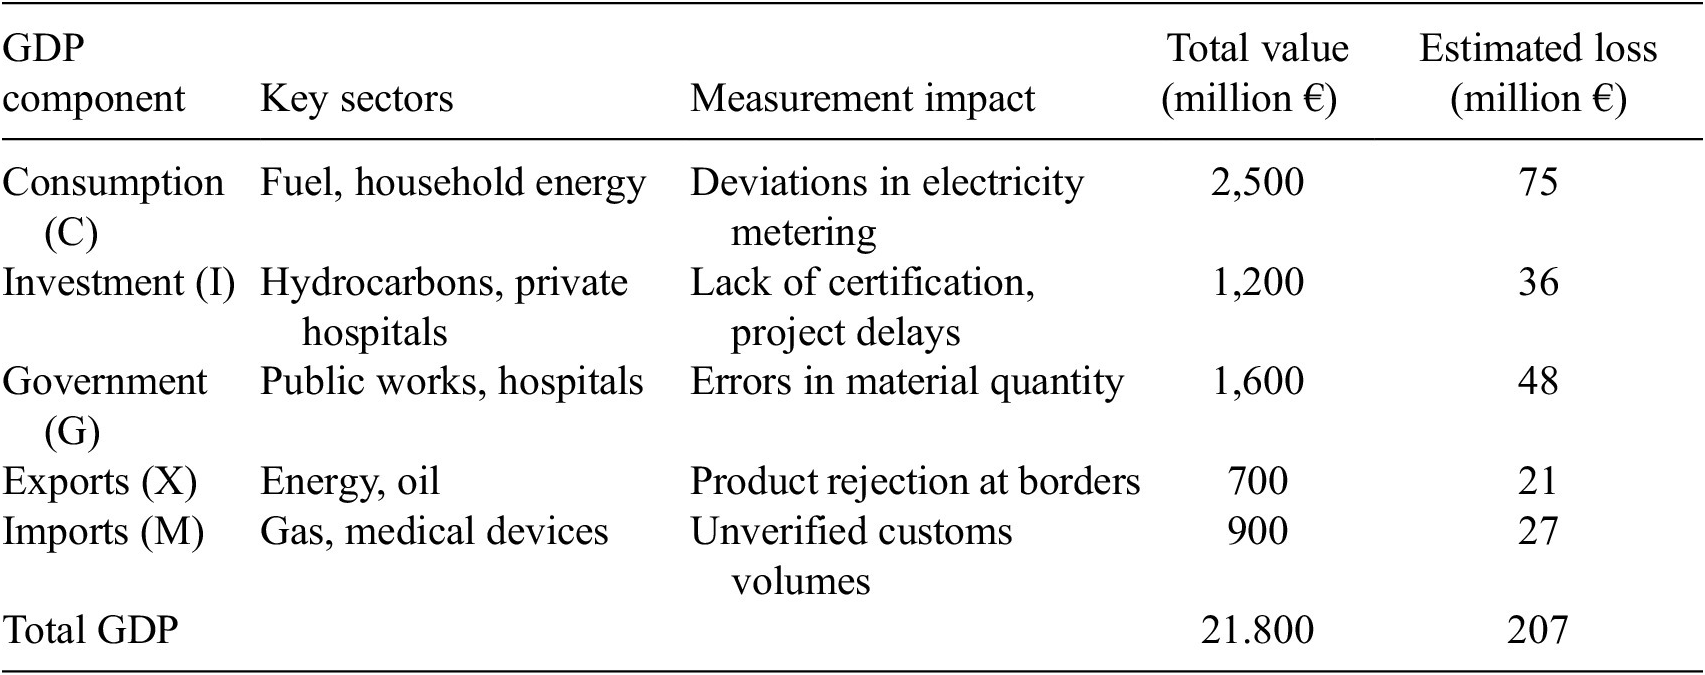
Table 2. Long description
The table consists of five columns: G D P component, Key sectors, Measurement impact, Total value in million Euro, and Estimated loss in million Euro.
* Consumption C: Key sectors include Fuel and household energy. Measurement impact is deviations in electricity metering. Total value is 2,500. Estimated loss is 75.
* Investment I: Key sectors include Hydrocarbons and private hospitals. Measurement impact is lack of certification and project delays. Total value is 1,200. Estimated loss is 36.
* Government G: Key sectors include Public works and hospitals. Measurement impact is errors in material quantity. Total value is 1,600. Estimated loss is 48.
* Exports X: Key sectors include Energy and oil. Measurement impact is product rejection at borders. Total value is 700. Estimated loss is 21.
* Imports M: Key sectors include Gas and medical devices. Measurement impact is unverified customs volumes. Total value is 900. Estimated loss is 27.
* Total G D P: Total value is 21,800. Total estimated loss is 207.
The policy implications extend beyond Albania. Across the Western Balkans, similar structural gaps in calibration capacity and statistical verification constrain fiscal credibility, limit comparability of economic data, and reduce access to EU funding mechanisms. Weak measurement systems therefore represent not only a technical limitation, but a governance risk affecting convergence with EU standards.
The NPUL framework addresses this gap by translating measurement conditions into policy-relevant indicators that can be integrated into budgeting, procurement oversight, and macroeconomic monitoring systems. This approach supports alignment with the EU acquis, particularly Chapters 1 (Free Movement of Goods), 5 (Public Procurement), 20 (Enterprise and Industrial Policy), and 28 (Consumer and Health Protection), where traceability, conformity assessment, and standardization are critical.
International evidence reinforces this interpretation. Studies by EURAMET (2022), PTB (2022), OECD (2023), and UNIDO and Sida (2023) show that investments in metrology and quality infrastructure generate measurable economic returns and improve fiscal transparency. In sectors such as energy and construction, improved calibration and verification systems reduce losses, enhance regulatory compliance, and strengthen investor confidence (World Bank, 2023).
Overall, the results indicate that measurement reliability is a prerequisite for credible economic governance. By integrating metrological conditions into macroeconomic interpretation, NPUL provides a policy-relevant framework for strengthening fiscal integrity, improving institutional coordination, and accelerating EU convergence.
3.3. Sectoral diagnosis and strategic implications through NPUL
At this stage, the NPUL framework functions as a diagnostic instrument linking measurement conditions to macroeconomic outcomes. It quantifies how measurement inefficiencies, typically unobserved in conventional GDP accounting, translate into measurable fiscal losses across strategic sectors. In doing so, NPUL establishes a direct analytical connection between metrological integrity and economic governance, positioning measurement reliability as a determinant of fiscal credibility.
Using Albania as a reference case, the model applies sector-specific measurement efficiency coefficients (ε m,i) and calibration alignment parameters (α i) derived from national calibration audits and institutional traceability reports. The analytical formulation follows:

Equation (3) follows directly from the formal specification introduced in Section 2.2 and is applied here strictly for sectoral estimation purposes, ensuring consistency between the methodological framework and empirical analysis.
Where GDPi represents sectoral output, ε m,i captures measurement efficiency, and α i reflects the sensitivity of each sector to calibration deficiencies.
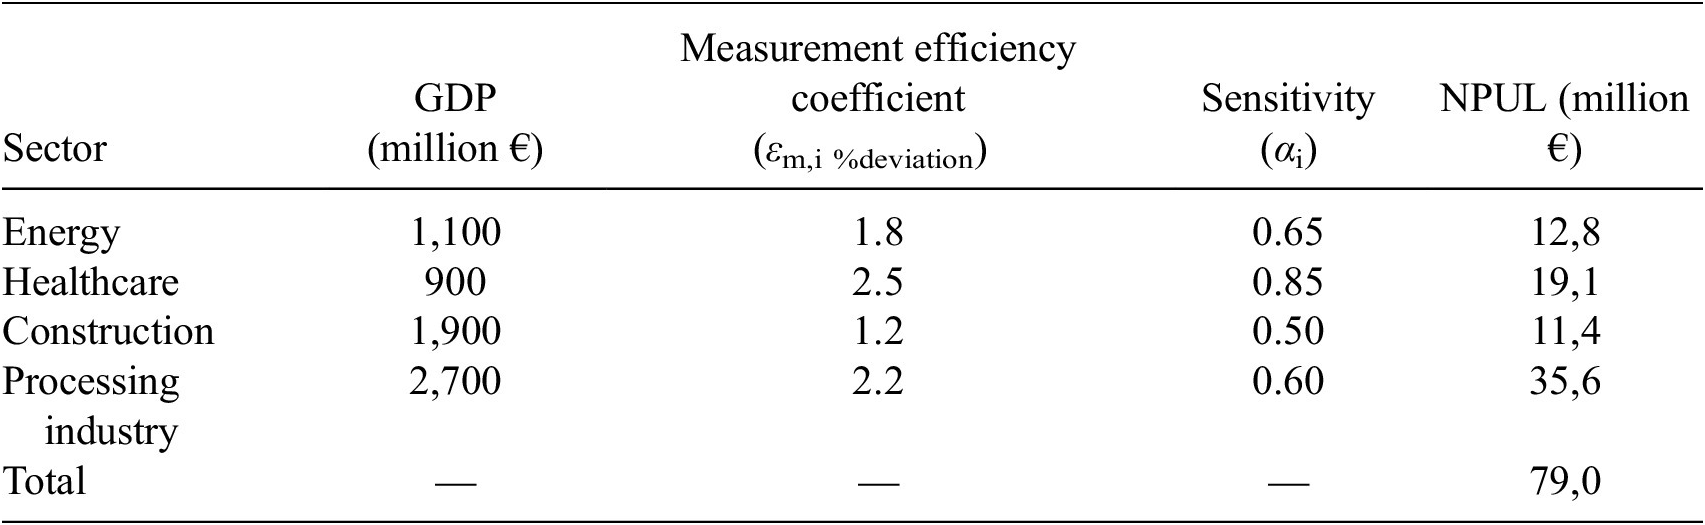
Empirical results indicate that energy, healthcare, construction, and the processing industry are the sectors most affected by systemic measurement gaps. Calibration deficiencies, outdated instruments, and fragmented traceability systems generate distortions that reduce GDP reliability and weaken fiscal transparency. These findings are consistent with evidence highlighting the role of traceability and calibration systems in supporting statistical credibility and governance performance (EURAMET, 2022; UNIDO, 2024) (Table 3).
Economic losses attributable to measurement inefficiencies across strategic sectors (Albania, 2023)
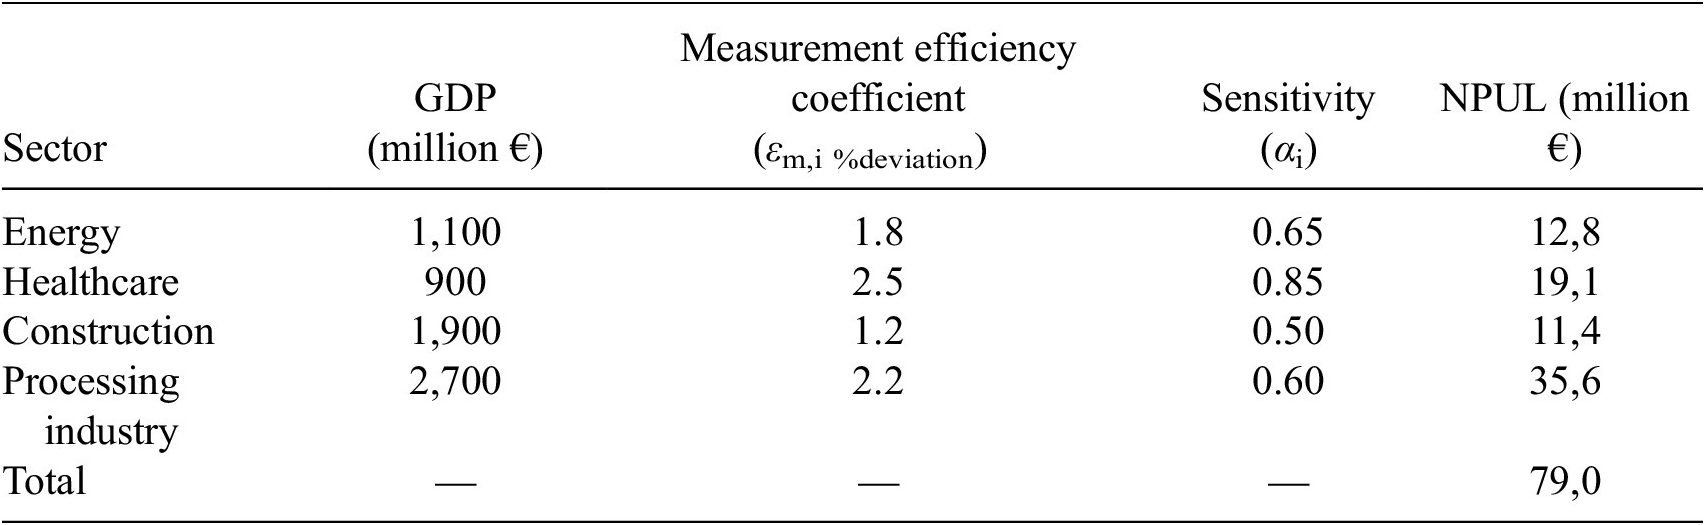
Table 3. Long description
The table consists of five columns: Sector, G D P in million Euro, Measurement efficiency coefficient (epsilon sub m comma i percent deviation), Sensitivity (alpha sub i), and N P U L in million Euro.
* Energy: G D P 1,100; Efficiency 1.8; Sensitivity 0.65; N P U L 12,8.
* Healthcare: G D P 900; Efficiency 2.5; Sensitivity 0.85; N P U L 19,1.
* Construction: G D P 1,900; Efficiency 1.2; Sensitivity 0.50; N P U L 11,4.
* Processing industry: G D P 2,700; Efficiency 2.2; Sensitivity 0.60; N P U L 35,6.
* Total: N P U L 79,0.
Note: Measurement efficiency represents sector-specific calibration gaps, and alpha sub i captures the sensitivity of each sector to measurement deviations within the N P U L model.
Source: Author’s calculations based on INSTAT (2023), PTB (2022), UNIDO and Sida (2023), WHO (2022), and World Bank (2023).
Note. Measurement efficiency (εm,i) represents sector-specific calibration gaps expressed as a coefficient, while α i captures the sensitivity of each sector to measurement deviations within the NPUL model, where higher (εm,i)values indicate greater measurement inefficiency rather than proportional shares.
The processing industry and healthcare sectors account for the largest share of losses, exceeding 50 million € annually. These results demonstrate that measurement inefficiencies directly affect fiscal transparency, procurement effectiveness, and investment outcomes. Figure 10 translates these losses into a comparative visual form by showing the difference between nominal GDP and NPUL-adjusted GDP across the most exposed sectors.
Comparative chart of GDP before and after NPUL adjustment. Note: This figure compares nominal GDP with NPUL-adjusted GDP across five macroeconomic sectors. The adjusted values reflect the integration of sector-specific measurement efficiency (ε m,i) and calibration alignment parameters (α i), showing how technical deficiencies materialize as fiscal shortfalls. The visible reduction across sectors illustrates the aggregate cost of weak measurement systems and the importance of stronger national calibration capacity. Source: Author’s elaboration based on INSTAT (2023), PTB (2022), and EURAMET CG-11 (2022).

Figure 10. Long description
The y-axis represents G D P in millions of Euros, ranging from 0 to 1400 in increments of 200. The x-axis lists five sectors: Energy, Healthcare, Construction, Exports, and Imports. A legend at the bottom indicates that blue bars represent Before Adjustment and orange bars represent After Adjustment.
* Energy: The blue bar is at 1200 and the orange bar drops to approximately 1150.
* Healthcare: The blue bar is at 850 and the orange bar drops to approximately 820.
* Construction: The blue bar is at 950 and the orange bar drops to approximately 910.
* Exports: The blue bar is at 700 and the orange bar drops to approximately 680.
* Imports: The blue bar is at 900 and the orange bar drops to approximately 870.
Across all sectors, the orange bars are consistently shorter than the blue bars, illustrating the fiscal shortfall identified by the N P U L adjustment.
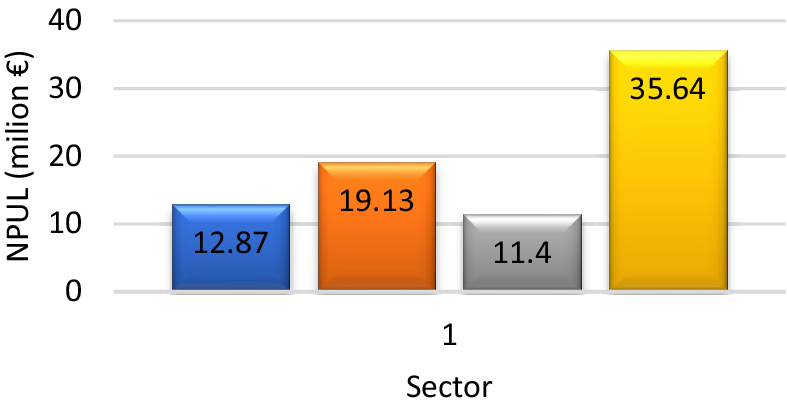
Figure 11 further disaggregates this pattern by isolating the relative contribution of each sector to total GDP deviation. This step is analytically important because it shows where calibration and traceability weaknesses exert the strongest fiscal pressure and where corrective investment would likely generate the highest institutional return.
Sectoral impact of measurement uncertainty on GDP loss. Note: This figure isolates the contribution of each strategic sector to GDP deviation. Processing industry and healthcare display the largest distortions, indicating that fragmented measurement governance undermines fiscal accuracy, procurement discipline, and investor confidence most visibly in these domains. Source: Author’s elaboration based on INSTAT (2023), PTB (2022, EURAMET CG-11 (2022), UNIDO and Sida (2023), and WHO (2022).

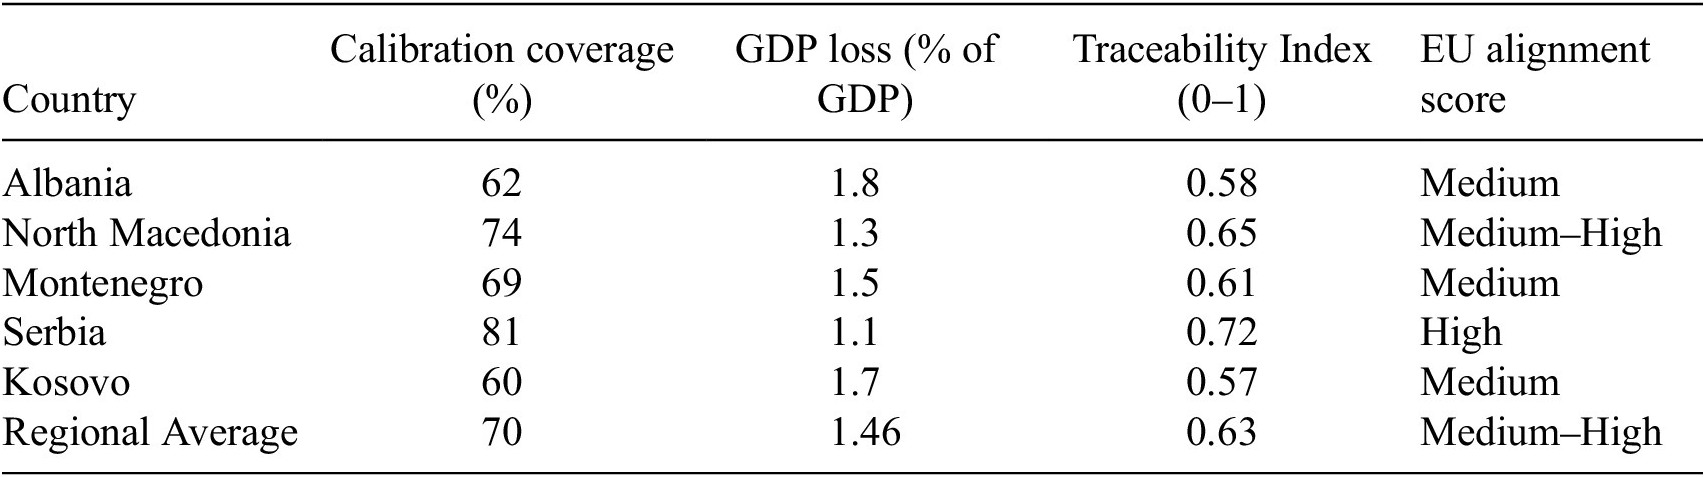
To place these findings in a wider policy context, comparative analysis across Western Balkan economies reveals similar structural patterns. Calibration coverage, traceability systems, and uncertainty-adjusted GDP indicators jointly shape fiscal reliability and alignment with EU standards (Table 4).
Comparative indicators of measurement governance in the Western Balkans (2023)

Table 4. Long description
The table consists of five columns: Country, Calibration coverage (%), G D P loss (% of G D P), Traceability Index (0–1), and E U alignment score.
* Albania: 62% coverage, 1.8% G D P loss, 0.58 Traceability Index, Medium alignment.
* North Macedonia: 74% coverage, 1.3% G D P loss, 0.65 Traceability Index, Medium–High alignment.
* Montenegro: 69% coverage, 1.5% G D P loss, 0.61 Traceability Index, Medium alignment.
* Serbia: 81% coverage, 1.1% G D P loss, 0.72 Traceability Index, High alignment.
* Kosovo: 60% coverage, 1.7% G D P loss, 0.57 Traceability Index, Medium alignment.
* Regional Average: 70% coverage, 1.46% G D P loss, 0.63 Traceability Index, Medium–High alignment.
The data indicates that higher calibration coverage and traceability values correlate with lower G D P losses and higher E U alignment.
Source: Author’s elaboration based on INSTAT (2023), Eurostat (2023), PTB (2022), OECD (2023), World Bank (2023), and EURAMET (2022).
Note. Higher calibration coverage and traceability values are associated with lower uncertainty-adjusted GDP losses and improved alignment with EU governance standards.
The comparative evidence indicates that higher calibration coverage and stronger traceability systems are associated with lower GDP-adjusted uncertainty and closer alignment with EU reference frameworks. Serbia and North Macedonia demonstrate relatively stronger performance, while Albania and Kosovo remain more exposed to measurement-related fiscal risks due to weaker traceability continuity and institutional fragmentation.
Overall, the findings confirm that measurement reliability is a structural determinant of economic governance. Where calibration systems are fragmented, fiscal planning becomes increasingly detached from technical reality. By embedding measurement conditions into macroeconomic evaluation, the NPUL framework provides a consistent analytical basis for improving fiscal accuracy, strengthening institutional trust, and supporting convergence with European governance frameworks.
3.4. Comparative regional analysis and policy convergence
The comparative regional perspective reinforces the governance relevance of the NPUL framework by demonstrating how measurement conditions shape fiscal reliability across the Western Balkans. Rather than reflecting isolated technical deficiencies, gaps in metrology, standardization, and accreditation constitute structural constraints that affect economic integration, investor confidence, and alignment with the EU acquis (EURAMET, 2022; OECD, 2023; European Commission, 2024).
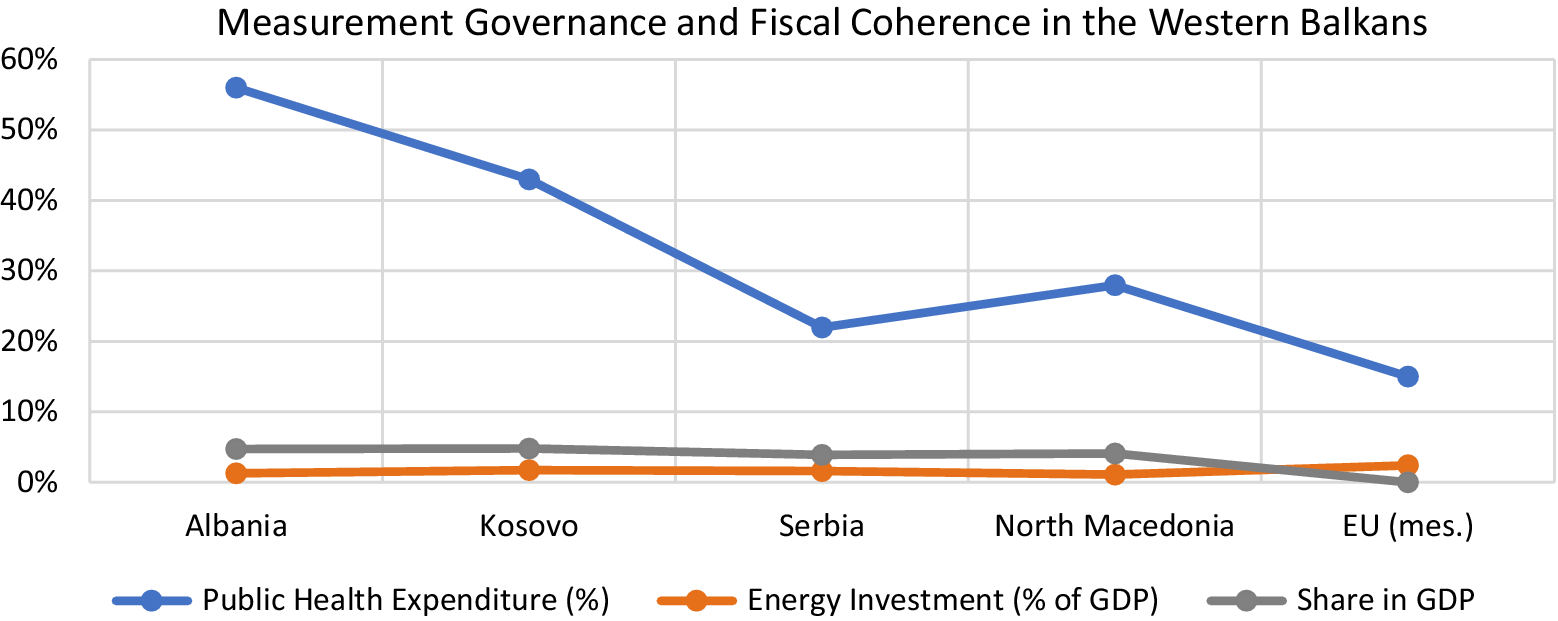
Within this context, Albania provides an analytically relevant baseline. Despite relatively high sectoral expenditures, including comparatively elevated public health allocations, outcome variability remains significant. This inconsistency reflects the absence of calibrated auditing systems and measurement-based performance criteria, suggesting that resource allocation alone is insufficient without corresponding measurement reliability.
A similar pattern is observable in logistics and trade-related indicators. Albania’s performance in the World Bank’s Logistics Performance Index (LPI) remains below that of several regional comparators, pointing to inefficiencies in technical inspections, customs verification, and traceability systems. These dimensions are closely linked to measurement governance capacity and highlight the role of calibration and verification systems in supporting efficient economic flows.
Across the region, countries with more developed measurement governance frameworks tend to demonstrate higher logistics performance, improved resource allocation efficiency, and more stable fiscal outcomes. This relationship suggests that measurement reliability operates as an enabling condition for broader economic coordination rather than as a purely technical function.
Figure 12 illustrates these dynamics by visualizing the interaction between public expenditure patterns, energy investment, and trade dependency within a measurement-governance context. The observed variation across countries reinforces the argument that differences in calibration capacity and traceability systems contribute to uneven macroeconomic reliability and policy effectiveness.
Structural correlation between measurement governance and fiscal coherence in the Western Balkans. Note: The figure compares selected governance-sensitive indicators across Western Balkan economies, illustrating how measurement governance conditions may influence fiscal coherence, public healthcare expenditure statistics, energy investment, and broader economic performance. Source: Author’s elaboration based on World Bank (2023), WHO (2022), and national statistical authorities.

Figure 12. Long description
The X-axis lists five economies from left to right: Albania, Kosovo, Serbia, North Macedonia, and E U (mes.). The Y-axis represents percentages ranging from 0 percent to 60 percent in increments of 10.
* Public Health Expenditure (blue line with circles): Starts at its highest point in Albania at approximately 56 percent, shows a linear decrease to Kosovo at 43 percent, drops sharply to Serbia at 22 percent, rises slightly to North Macedonia at 28 percent, and ends at its lowest point in E U (mes.) at 15 percent.
* Energy Investment as a percentage of G D P (orange line with circles): Remains nearly flat and stable across all economies, fluctuating minimally between 1 percent and 3 percent.
* Share in G D P (gray line with circles): Maintains a low, steady trend around 4 percent to 5 percent for Albania, Kosovo, Serbia, and North Macedonia, before dropping to 0 percent at the E U (mes.) data point.
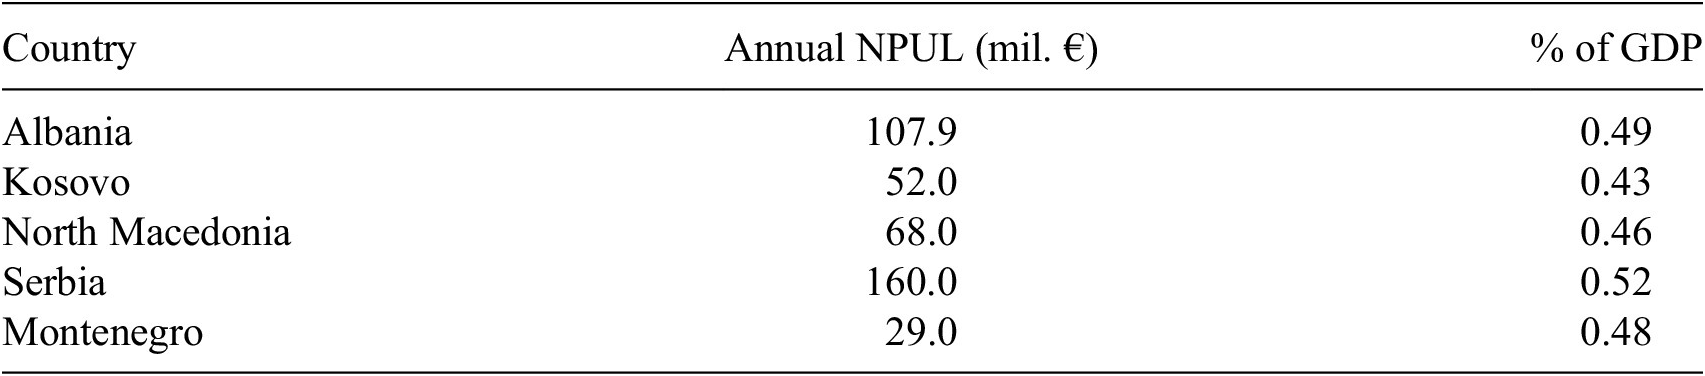
Beyond structural indicators, the NPUL framework provides a harmonized metric for comparing hidden fiscal losses across the region. By integrating measurement efficiency (ε m,i) and calibration alignment (α i) into GDP interpretation, the model quantifies the macroeconomic impact of measurement uncertainty across countries (Table 5).
NPUL as a share of GDP in Western Balkans (2023)

Table 5. Long description
The table consists of three columns: Country, Annual N P U L (mil. Euro), and percentage of G D P. The data rows are as follows:
* Albania: 107.9 million Euro, 0.49 percent of G D P.
* Kosovo: 52.0 million Euro, 0.43 percent of G D P.
* North Macedonia: 68.0 million Euro, 0.46 percent of G D P.
* Serbia: 160.0 million Euro, 0.52 percent of G D P.
* Montenegro: 29.0 million Euro, 0.48 percent of G D P.
The source is noted as author calculations based on national statistical reports, E U R A M E T 2022, U N I D O, Sida 2023, and World Bank 2023.
Source: Author’s calculations based on national statistical reports, EURAMET (2022), UNIDO and Sida (2023), and World Bank (2023).
Note. The table presents estimated NPUL values and their relative share of GDP across selected Western Balkan economies. The results indicate a consistent presence of measurement-related fiscal exposure across countries, with variations reflecting differences in calibration coverage, traceability systems, and quality-infrastructure maturity.
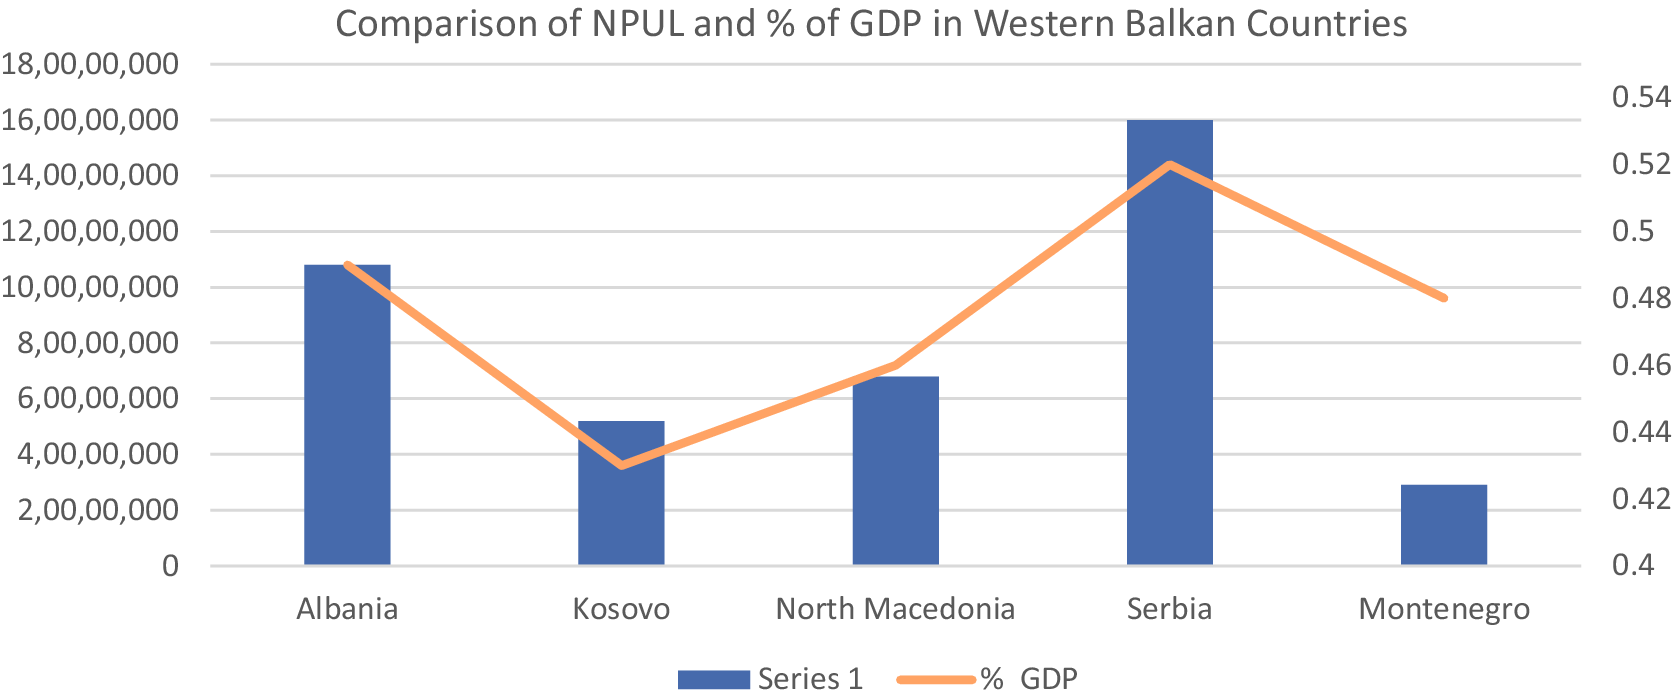
Figure 13 visualizes NPUL intensity across countries, showing that relative measurement-related losses remain broadly comparable despite differences in economic size. This pattern suggests persistent gaps in calibration capacity and limited convergence in measurement governance across the region.
NPUL-to-GDP ratio across Western Balkan economies. Note: The figure compares NPUL values in absolute and relative terms, illustrating the consistent presence of measurement-related fiscal losses across the region. Source: Author’s elaboration based on EURAMET (2022), UNIDO and Sida (2023), and World Bank (2023).

Figure 13. Long description
The chart features a primary vertical axis on the left ranging from 0 to 18,00,00,000 representing N P U L values, and a secondary vertical axis on the right ranging from 0.4 to 0.54 representing percentage of G D P. The horizontal axis lists five countries. A blue bar chart (Series 1) represents absolute N P U L values, while an orange line graph represents the percentage of G D P.
* Albania: Blue bar at approximately 10,80,00,000; orange line point at 0.49.
* Kosovo: Blue bar at approximately 5,20,00,000; orange line point at 0.43.
* North Macedonia: Blue bar at approximately 6,80,00,000; orange line point at 0.46.
* Serbia: Blue bar at the highest point of 16,00,00,000; orange line point at its peak of 0.52.
* Montenegro: Blue bar at the lowest point of approximately 2,90,00,000; orange line point at 0.48.
The data shows a general correlation where higher absolute N P U L values correspond with a higher percentage of G D P, with Serbia having the highest in both metrics and Kosovo having the lowest percentage of G D P.
Overall, the evidence confirms that measurement reliability is a key determinant of fiscal coherence and policy effectiveness. Weak traceability and fragmented calibration systems introduce persistent distortions in economic data, affecting budget accuracy and institutional credibility. Within this model, NPUL operates as a policy-support tool, enabling the quantification of hidden inefficiencies and the prioritization of calibration investments. By linking measurement conditions to fiscal outcomes, it provides a practical pathway for strengthening economic governance and supporting convergence with EU standards.
3.5. Policy pathways for EU integration through NPUL
The integration of the NPUL framework into policy design provides a structured pathway for aligning measurement reliability with EU governance standards. Across Albania and the Western Balkans, fragmented quality-infrastructure systems constrain fiscal transparency, regulatory consistency, and investor confidence. NPUL addresses this gap by translating measurement conditions into policy-relevant indicators that support institutional reform.
Embedding NPUL within public financial management systems enables the incorporation of uncertainty-aware metrics into budgeting, procurement, and monitoring processes, strengthening compliance with EU acquis requirements (European Commission, 2024). By linking calibration practices with fiscal oversight, NPUL reframes measurement reliability as a governance variable. Figure 14 illustrates this integration through a coordinated governance cycle.
The NPUL governance cycle: from calibration to policy credibility. Note: The figure shows the integration of calibration, accreditation, standardization, procurement, and digital interoperability within a governance cycle linking measurement reliability to fiscal transparency and policy coordination. Source: Author’s elaboration (2025) based on PTB (2022), EURAMET (2022), and OECD (2023).

At the operational level, the model supports the development of digital tools that embed measurement reliability within statistical platforms and decision-support systems, enabling a transition toward anticipatory governance. As illustrated in Figure 15, the NPUL Observatory functions as a policy-translation platform that connects data analytics with institutional decision-making processes.
The NPUL governance and policy translation cycle. Note: The figure illustrates how measurement data are transformed into governance-relevant indicators supporting fiscal monitoring, policy evaluation, and regional coordination. Source: Author’s elaboration (2025) based on PTB (2022), EURAMET (2022), and OECD (2023).

Figure 15. Long description
A circular diagram enclosed by two large curved arrows. The top arrow is labeled Continuous Recalibration and Monitoring. The bottom arrow is labeled Institutional Learning.
Inside the circle, the process flows as follows:
* At the top, two dark blue ovals labeled Calibration and Traceability point downward to a teal oval.
* The teal oval is labeled N P U L Modeling and simulation. It points down to a central text block.
* The central text block reads Data Conversion Into Fiscal Intelligence.
* To the right, three yellow ovals represent outputs: Policy Alignment with E U Acquis, Evidence-Based Budgeting, and Transparency and Accountability Metrics.
* To the left, three stacked labels represent inputs: Risks Assessment, Data Conversion into Fiscal intelligence, and Policy Dashboards.
* Below the central text is a light blue oval labeled N P U L Observatory.
* At the bottom base, two text labels are positioned: Fiscinal Planning Units and Netiional Risk Registers.
* On the far left exterior, a label reads Fiscal Planning Units.
Regionally, NPUL facilitates comparability by standardizing the interpretation of measurement-related risks, supporting convergence through coordinated calibration programs and harmonized reporting practices (OECD, 2023; UNIDO and Sida, 2023).
Overall, NPUL functions as a policy-enabling framework that links technical precision with institutional performance, supporting a transparent and evidence-based pathway toward EU integration.
Policy highlights
-
• The NPUL framework converts measurement uncertainty into quantifiable fiscal-risk indicators that can be integrated into public financial management systems, including digital dashboards and procurement oversight tools (OECD, 2023; IMF, 2024).
-
• It supports a transition from reactive correction mechanisms toward anticipatory governance, enabling early identification of systemic inefficiencies in economic data and budget execution.
-
• By aligning calibration, accreditation, and digital infrastructures, NPUL strengthens compliance with EU acquis requirements on transparency, traceability, and accountability (UNIDO, 2023; European Commission, 2024).
-
• The framework is transferable across institutional contexts, particularly in regions characterized by fragmented data ecosystems, including the Western Balkans, Africa, and parts of Asia, where measurement gaps affect fiscal performance and policy reliability.
-
• NPUL provides a structured analytical pathway for linking technical precision with institutional credibility, supporting evidence-based policymaking and strengthening the integrity of economic governance systems.
-
• Strengthening measurement systems emerges as a prerequisite for credible economic governance, reinforcing the role of quality infrastructure as a core component of fiscal resilience and EU convergence.
4. Conclusion and policy outlook
The findings demonstrate that the NPUL framework operates as more than an analytical extension of GDP accounting. By translating measurement uncertainty into quantifiable fiscal-risk indicators, it establishes a governance-oriented approach in which technical precision supports institutional credibility and public trust. In emerging economies, measurement inefficiencies can systematically affect fiscal forecasting, procurement outcomes, and investor confidence. From a policy perspective, NPUL positions data reliability as a necessary condition for credible economic governance. Integrating measurement-efficiency parameters into macroeconomic interpretation enables governments to strengthen budgeting processes, reduce hidden inefficiencies, and ensure that fiscal decisions are grounded in verifiable evidence. This supports a transition from reactive correction toward anticipatory governance, where systemic risks can be identified at an early stage.
Operationally, NPUL can be embedded as an analytical layer within national data infrastructures, supporting traceability and accountability in public decision-making (European Commission, 2020; OECD, 2023). Its design is scalable, enabling cross-country benchmarking and harmonized reforms across the Western Balkans. In this context, Albania can be positioned not only as a beneficiary of EU integration, but also as a methodological contributor to governance modernization. Beyond the regional context, the framework demonstrates that reliable measurement systems are fundamental to fiscal transparency and institutional performance (UNESCO, 2021; IMF, 2024). Strengthening measurement systems and quality infrastructure is therefore essential for improving policy effectiveness and supporting long-term convergence with European standards.
Supplementary material
The supplementary material for this article can be found at http://doi.org/10.1017/dap.2026.10082.
Data availability statement
This study follows principles of methodological transparency and reproducibility. All model assumptions, parameter definitions, and computational procedures are explicitly documented and made accessible through the Supplementary Materials. The NPUL framework is designed to enable independent verification, replication, and adaptation across different institutional contexts.
All data used in this study originate from publicly accessible statistical sources, including INSTAT, PTB, WHO, UNIDO, and the World Bank. The NPUL coefficients, fiscal adjustments, and aggregation outputs were generated within the analytical workflow of this research. The complete dataset and Supplementary Materials required to reproduce the results are publicly available in Zenodo: Hakrama (Reference Hakrama2026). Dataset and Supplementary Materials for “GDP Without Calibration: How Invisible Errors Undermine Governance in Fragmented States and the NPUL Model Response.” Zenodo. https://doi.org/10.5281/zenodo.20726066
The Zenodo repository contains the full computational workbook (NPUL_Integrated_Workbook_2023_FULL_v5.xlsx), technical documentation, model parameters, formulas, uncertainty estimates, sectoral calculations, and Supplementary Materials necessary to reproduce the analyses and results presented in this article.
Acknowledgments
The author used generative artificial intelligence tools solely for language editing, grammar refinement, and formatting support during manuscript preparation. All conceptual development, methodology, analysis, interpretation, and conclusions remain the sole responsibility of the author.
Author contribution
Conceptualization-Equal: K.H.; Data Curation-Equal: K.H.; Formal Analysis-Equal: K.H.; Investigation-Equal: K.H.; Methodology-Equal: K.H.; Project Administration-Equal: K.H.; Visualization-Equal: K.H.; Writing – Original Draft-Equal: K.H.; Writing – Review & Editing-Equal: K.H.
Funding statement
This research was conducted independently and received no financial support from any public, commercial, or not-for-profit organization. The study was self-funded as part of the NPUL Research Initiative.
Competing interests
The author declares no financial or nonfinancial conflicts of interest related to the design, execution, or publication of this study. The views and conclusions expressed are solely those of the author.
Ethical approval
This study did not involve human participants, personal data, or confidential records. All data sources are publicly available and appropriately cited.




 Open access


Comments
No Comments have been published for this article.