Introduction
Embryonic stem (ES) cells with pluripotency offer a powerful approach for differentiating into all adult cell types and are a promising source of progenitors for cell replacement therapy and tissue regeneration [Reference Murry and Keller1, Reference Wobus and Boheler2]. ES cells can be derived to differentiate into a wide spectrum of cell types, such as neural cells, cardiomyocytes, hepatic, and endothelial cells, by forming embryoid bodies (EBs) [Reference Murry and Keller1]. The size of EBs is a key factor in determining cell fate and promoting differentiation toward cardiomyocytes [Reference Burridge, Anderson, Priddle, Barbadillo Muñoz, Chamberlain, Allegrucci, Young and Denning3], chondrocytes [Reference Messana, Hwang, Coburn, Elisseeff and Zhang4], or neural lineages [Reference Ng, Davis, Stanley and Elefanty5]. A number of engineered microstructures have been developed that can control over size of EBs, such as hanging drop (HD) [Reference Huang, Liao, Yang, Chen, Hwang, Hung, Chang and Sung6], multiwell plates [Reference Ng, Davis, Azzola, Stanley and Elefanty7], micropatterning hydrogel [Reference Moon, Ju, Park, Bae, Chung and Lee8, Reference Cha, Bae, Sadr, Manoucheri, Edalat, Kim, Kim, Kwon, Hwang and Khademhosseini9, Reference Sasaki, Shimizu, Masuda, Kobayashi, Itoga, Tsuda, Yamashita, Yamato and Okano10], laser direct-write [Reference Dias, Unser, Xie, Chrisey and Corr11], micropatterned chips [Reference Mohr, Zhang, Azarin, Soerens, de Pablo, Thomson, Lyons, Palecek and Kamp12, Reference Choi, Chung, Lee, Khademhosseini, Kim and Lee13, Reference Sakai, Yoshiura and Nakazawa14], and three-dimensional (3D) printed scaffold [Reference Vijayavenkataraman, Zhang, Lu and Fuh15, Reference Bruyas, Lou, Stahl, Gardner, Maloney, Goodman and Yang16]. The HD method allowed single cells spontaneously to self-assemble but the formed EBs are not spherical because of the cell spreading on the flat substrate. Various micropatterned methods provided external forces or confined geometry to control the diameters and homogeneity of EB formation, but the yield of EBs so far has shown limitations of precise diameters. In addition, most of these patterned devices were not able to satisfy the engineering factors at the same time: porosity and uniformity that provide sufficient diffusion of nutrients and growth factors for stem cell cultures as well as the precise control of EBs. Meanwhile, cells must be pipetted manually into each pore of the devices such as multiwell chips, which is time-consuming and increases the likelihood of contamination during the process. Overall, these techniques have provided advances, but the goal of highly reproducible, efficient, and scalable hepatic differentiation has not been obtained.
The effect of EB sizes on directing ES cell fate has been investigated widely [Reference Messana, Hwang, Coburn, Elisseeff and Zhang4, Reference Cha, Bae, Sadr, Manoucheri, Edalat, Kim, Kim, Kwon, Hwang and Khademhosseini9, Reference Mohr, Zhang, Azarin, Soerens, de Pablo, Thomson, Lyons, Palecek and Kamp12, Reference Choi, Chung, Lee, Khademhosseini, Kim and Lee13, Reference Hwang, Chung, Ortmann, Hattori, Moeller and Khademhosseini17]. Kamp’s group studied cardiac differentiation of EBs in a wide range of sizes and geometries, 100–500 μm in lateral dimensions and 120 μm in depth [Reference Mohr, Zhang, Azarin, Soerens, de Pablo, Thomson, Lyons, Palecek and Kamp12]. It was concluded that the 300 μm microwells produced highest percentage of contracting EBs, and the smaller EBs are less likely to form contracting EBs; however, those contracting EBs formed a similar percentage of cardiomyocytes compared to larger EB sizes. Zhang determined an optimal size of EBs for chondrogenic differentiation by dividing predifferentiated EBs into three groups, <100 μm, 100 μm ∼150 μm, and >150 μm [Reference Messana, Hwang, Coburn, Elisseeff and Zhang4]. Small EBs were found more significantly to express the specialized chondrogentic markers. Hwang determined that cardiogenesis was enhanced in larger EBs (450 μm in diameter), and in contrast, endothelial cell differentiation was increased in smaller EBs (150 μm in diameter) [Reference Hwang, Chung, Ortmann, Hattori, Moeller and Khademhosseini17]. Therefore, it has been proved that the lineage specific differentiation from EBs for cardiac and neural fates are highly influenced by the size, which is essential for application in tissue engineering and regenerative medicine to generate predictable and consistent results. Yet, among large amount genesis of organs and tissues for which cell therapies are being pursued, the liver is an organ that lacks effective therapies for liver failure and a large quantity of liver cells generated from stem cells are always on demand [Reference Hwang, Chung, Ortmann, Hattori, Moeller and Khademhosseini17, Reference Michalopoulos18]. In this paper, we utilized inverted colloidal crystal (ICC) scaffolds [Reference Wang, Bahng, Che, Han and Kotov19, Reference Lee, Cuddihy, Cater and Kotov20, Reference Carpenter, Kwak, Peyton and Lee21] for the efficient formation of size-controlled EBs and investigated whether there is the optimum size of EBs for hepatic differentiation. ICC scaffolds provide a nearly perfect tool to study the optimal size of EBs for specific differentiation because of its unique features with uniformly sized pores in ICC cell matrixes, which can afford a high yield production of controlled size spheroids in wide range, and at the same time, its biomimetic 3D structure can provide efficient nutrient transport and cell–cell interaction to enhance the quality and viability of EBs [Reference Griffith and Swartz22, Reference Duarte, Mano and Reis23, Reference Goral, Hsieh, Petzold, Clark, Yuen and Faris24]. When utilizing the nanostructured coatings, these and other scaffolds represent the example of convergent technologies that can predictively control cell development using nano–bio interactions [Reference Lee, Cuddihy, Cater and Kotov20, Reference Wang, Jan, Cuddihy, Bahng and Kotov25, Reference Podsiadlo, Kaushik, Shim, Agarwal, Tang, Waas, Arruda and Kotov26]. The selected pore sizes of scaffolds were 90, 170, 210, 280, and 400 μm, and HD method was used as a control method. Here, we examine the process of how the size-controlled EBs differentiate into hepatocyte-like cells and the degrees of differentiation in each diameter were compared.
Results and discussion
ES cells and EBs cultured in ICC scaffolds
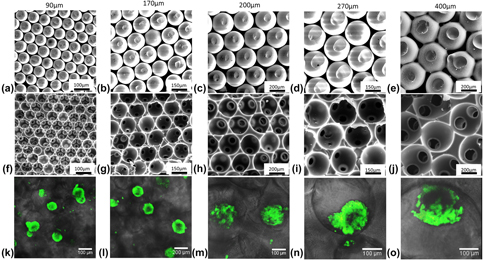
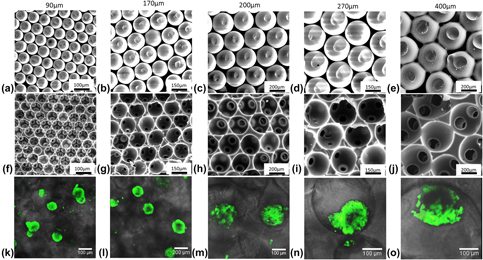
Polyacrylamide hydrogel ICC scaffolds were prepared by utilizing colloidal crystals (CCs) as templates [Figs. 1(a)–1(e)]. To control the pore sizes of scaffolds, we fabricate the templates using glass beads with five diameters: 90, 170, 200, 270, and 400 μm for this study. Regardless of the bead sizes, 3D structure of CC with high connection was achieved, which in turn was transferred into ICC geometry high porosity as previous method [Reference Lee, Cuddihy, Cater and Kotov20] [Figs. 1(f)–1(j)]. To culture ES cells within porous 3D structures, the cells were seeded into scaffolds, allowing the cells to settle within the caves. One major feature of ICC scaffolds is that the resulting size and shape of EBs are similar to the 3D structure in which they are grown. In addition, EBs in scaffolds can contact with each other due to the highly porous connection, in contrast to previously reported concave microwell or micropatterned chips [Reference Ng, Davis, Azzola, Stanley and Elefanty7, Reference Mohr, Zhang, Azarin, Soerens, de Pablo, Thomson, Lyons, Palecek and Kamp12, Reference Choi, Chung, Lee, Khademhosseini, Kim and Lee13, Reference Sakai, Yoshiura and Nakazawa14, Reference Hwang, Chung, Ortmann, Hattori, Moeller and Khademhosseini17].
ICC scaffold and EBs formation. (a–e) SEM images of highly ordered CCs with different sized glass beads of 90, 170, 200, 270, and 400 µm as template. (f–j) SEM images of dehydrated hydrogel ICC scaffolds with different pore sizes and magnifications. Pore dimensions were reduced during the dehydration process for SEM sample preparation. ES cells were seeded in the scaffolds and formed EBs stained with 5-chloromethylfluorescein diacetate (CMFDA) as green color (k–o).

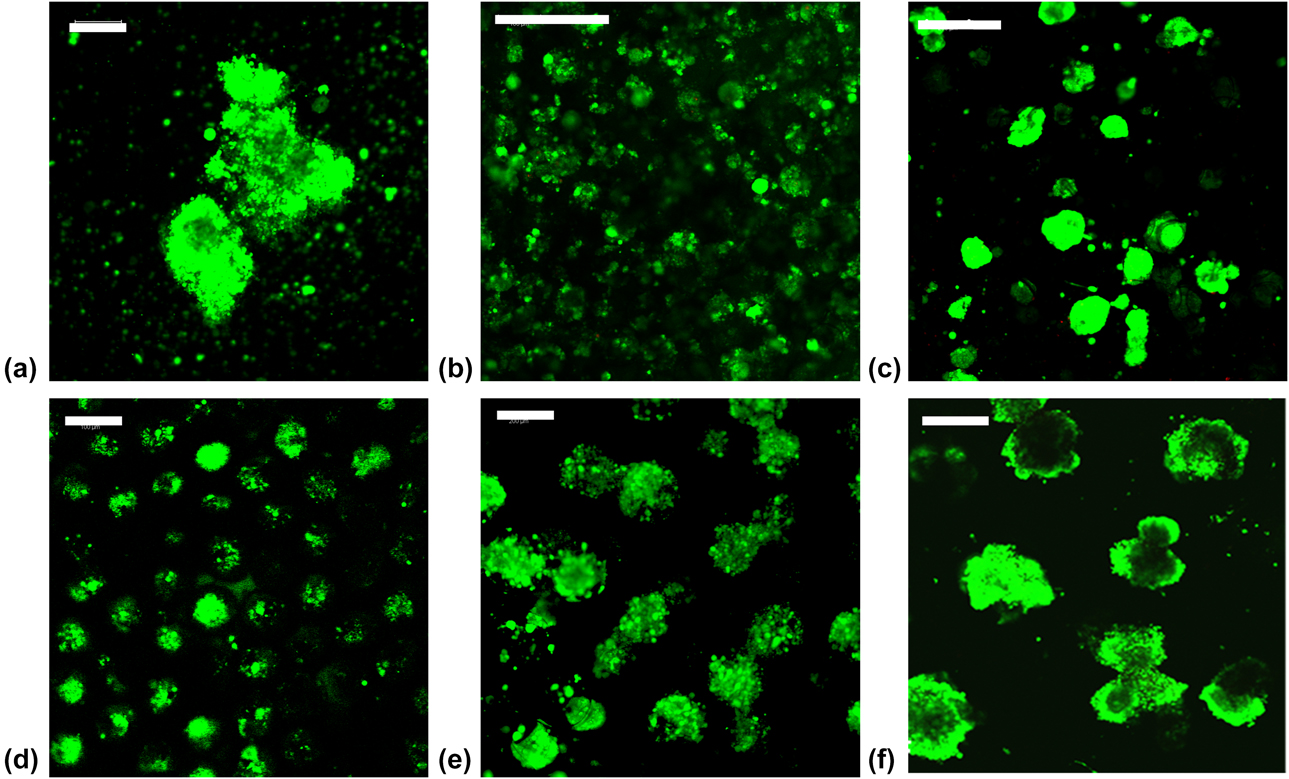
EBs were harvested after culturing for 6 days within ICC scaffolds [Figs. 1(k)–1(o)]. ES cells cultured within ICC scaffolds were physically constrained and formed EBs that were homogenous in size. The viability of EBs was checked by standard live/dead cell viability assays which consisted of calcein AM and ethidium homodimer (EthD-1) addressing plasma membrane integrity and esterase activity, respectively [Fig. 2]. The live cells were stained as green and the dead ones were red. In live/dead assay test, cell viability analysis demonstrated that cells cultured for 6 days remained viable regardless of the difference in diameters, which indicated that the well biocompatibility allows ICC scaffolds potentially useful tool for culturing ES cells and also for further differentiation in vitro.
Confocal images (a–f) of live/dead stained EBs formed in ICC hydrogel scaffolds on day 6. Green indicates live cells and red indicates dead cells. EBs obtained by HD as a control (a). EBs induced by ICC scaffolds with diameters of 100, 170, 200, 270, and 400 µm (b–f). Scale bar: 200 μm.

Diameter distribution of size-controlled EBs in ICC scaffolds
To study how the pore sizes of ICC scaffolds control EBs formation in diameter with desirable precision, the scaffolds with five different diameters (90, 170, 200, 270, and 400 μm) were prepared and seeded with the same initial number of ES cells. EBs were retrieved after culturing for 6 days from ICC scaffolds and the distribution of their diameters was analyzed. In contrast to EBs formed by HD method as control [Fig. 2(a)], spherical EBs formed and exhibited relatively homogenous sizes [Figs. 2(b)–2(f)] directly related to the initial pore sizes of ICC scaffolds.
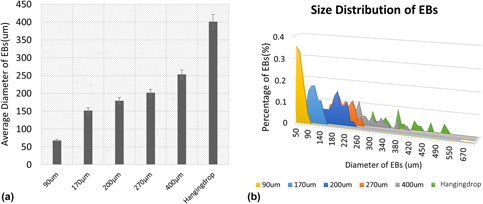
The dependence of spheroid diameter and uniformity of their size on the ICC pore size was quantified using image analysis. The average sizes of EBs on day 6 of culture by HD method and in scaffolds with different pore diameters were, respectively, 401.5 ± 163.4 µm, 67.8 ± 9.9 µm, 152.0 ± 21.5 µm, 179.6 ± 27.0 µm, 201.6 ± 29.6 µm, and 253.2 ± 46.2 µm [Fig. 3(a)]. The size distribution of EBs [Fig. 3(b)] further confirmed that the porous structure with controllable size of ICC scaffolds constrained led ES cells forming predictable, uniform-sized EBs with narrower distribution, particularly for the smaller-sized pores, in contrast to more heterogenous EB sizes resulting from unconstrained, conventional culture in larger-sized pores of ICC scaffolds, and especially from HD method. When the size of pores becomes larger than 270 µm, other factor such as nutrient delivery to the interior cells of EBs is a more critical issue than physical restriction, and thus, the sizes of EBs become less dependent on the pore size of ICC scaffolds.
EBs size control corresponding to pore dimensions of ICC. (a) ES cells were seeded in each ICC scaffolds having 90, 170, 200, 270, and 400 µm pore dimensions to get the average diameters of EB size after 6-day culturing. (b) Diameters distribution of day 6 EBs.

Effect of EB size on hepatic differentiation
Once predictable EB size distributions had been obtained from size-controlled ICC scaffolds, ES cells were differentiated into hepatic fate for another 2 weeks following the existing protocol and the differentiation media was made referred to previous [Reference Fineout-Overholt, Levin and Melnyk27, Reference Solter and Knowles28]. The effect of EB sizes on hepatic differentiation was examined.
First stage of differentiation
Differentiation of EBs in ICC scaffolds at the first stage was checked on day 3 and day 6 by immunocytochemical staining against pluripotency markers, Oct-3/4 and SSEA-1. Oct-3/4 is a master regulator of pluripotency and has been shown to be critical for maintaining ES cell character [Reference Fineout-Overholt, Levin and Melnyk27, Reference Matoba, Niwa, Masui, Ohtsuka, Carter, Sharov and Ko29, Reference Vassilieva, Guan, Pich and Wobus30], and it also governs three distinct fates of ES cells for the initial formation of a pluripotent founder cell population in the mammalian embryo. A less than 2-fold increase in expression causes differentiation into primitive endoderm and mesoderm, which includes the early stage of hepatic fate [Reference Ng, Davis, Stanley and Elefanty5]. SSEA-1 is a marker expressed on murine embryonal carcinoma cells, ES cells, and primordial germ cells. Murine SSEA-1 expression decreases with progress of differentiation in the early stage [Reference Solter and Knowles28, Reference Vassilieva, Guan, Pich and Wobus30, Reference Marani, van Oers, Tetteroo, Poelmann, van der Veeken and Deenen31].
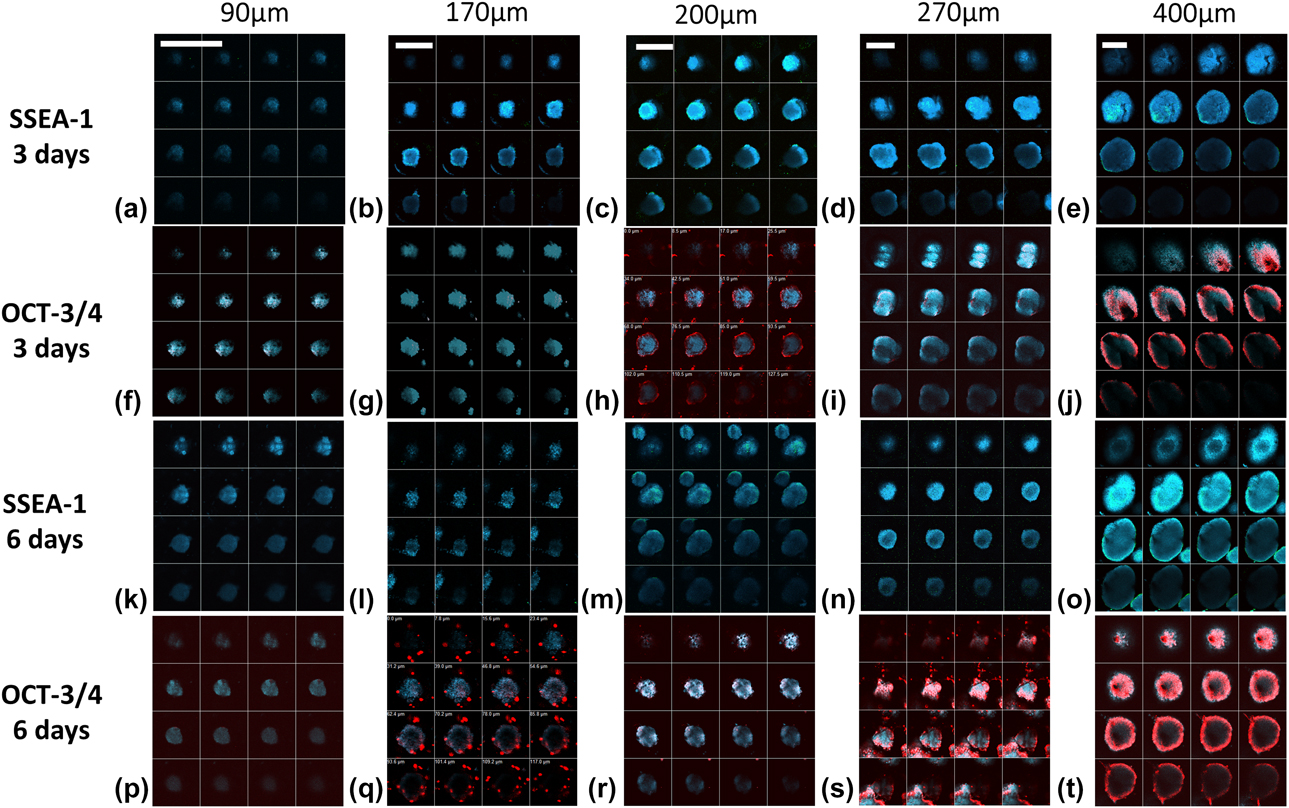
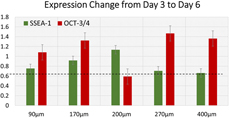
In the EBs immune-labeled on day 3 and day 6 of culture, images of representative EBs from scaffolds with pore size of 90–400 µm [Fig. 4] exhibited similar ratios of SSEA-1 expression on individual cell surface in EBs detected in ICC scaffolds with all the pore sizes except 90 µm, in agreement with the expression of Oct-3/4. Smallest EBs have limited expression of SSEA-1 and Oct3/4, which means ES cells in ICC scaffolds within smallest pore size could not maintain their pluripotency. Quantitative study of the change for expressions of protein markers from day 3 to day 6 [Fig. 5] showed that SSEA-1 decreased more significantly in the groups with a larger size of 270 and 400 µm while no obvious change was observed in other groups. This agreed with the previous results that larger EBs tend to differentiate into primitive germ layers [Reference Choi, Chung, Lee, Khademhosseini, Kim and Lee13]. In another aspect, Oct-3/4 expression of most groups increased slightly with the sizes of EBs except the one with a diameter of 200 µm. The peak of increase appears at the group of 270 µm, which approached 1.5-fold, the level toward endoderm and mesoderm differentiation [Reference Niwa, Miyazaki and Smith32], while the expression of Oct-3/4 in other groups was within 0.5–1.5-fold, which indicated the ES cells still maintained pluripotency no matter the expression increases or decreases. Overall, according to the evaluation of early differentiation, larger EBs have better functionality for further induction of specific lineage and the size of 270 µm shows the highest the potential for hepatic fate developed from endoderm.
Confocal microscopy images differentiated EBs on days 3 and 6. EBs were stained for markers of differentiation at first stage. SSEA-1 (a–e, k–o) is shown in green, and Oct-3/4 (f–j, p–t) is shown in red, while the cell nuclei, counterstained with DAPI, are in blue. Each image is z-stack from top to bottom of an EB in scaffolds with different pore sizes. Scale bar: 200 μm.

First stage of differentiation. Endoderm and mesoderm development were indicated by Oct3/4 level change. Decrease of SSEA-1 expression indicated the progress of differentiation process.

Analysis of hepatic differentiation by immunofluorescence
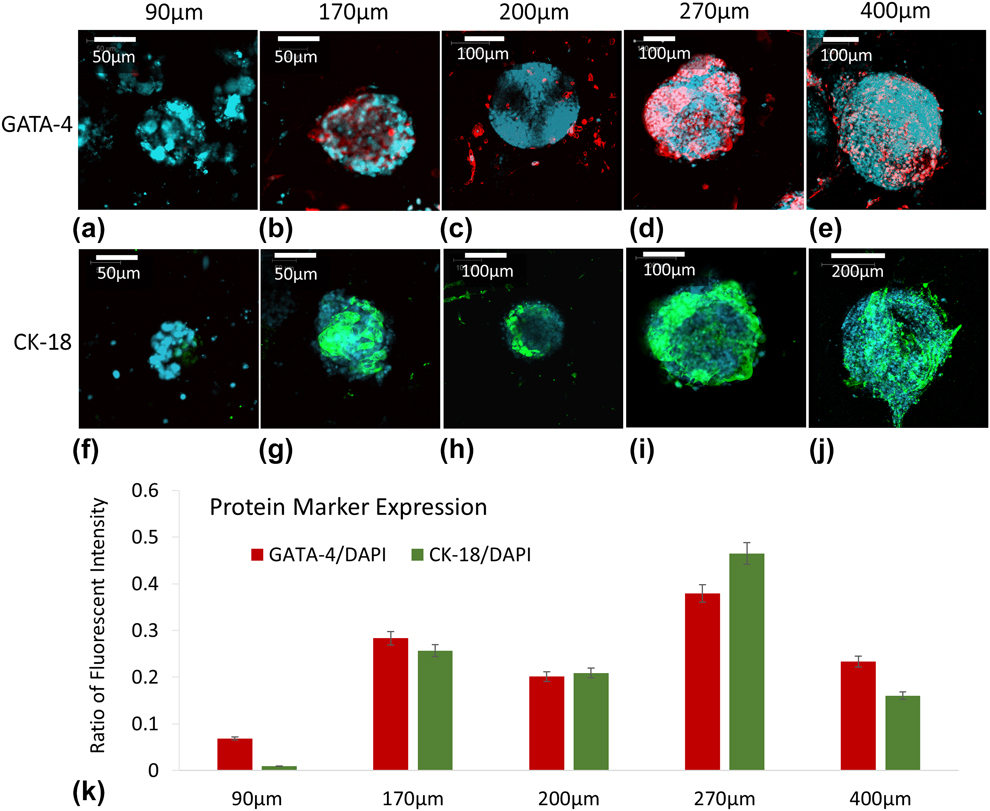
After culturing for 6 days in regular medium, EBs within ICC scaffolds were transferred to a new 48-well plate and cultured in hepatic differentiation medium (Experimental section) for additional 14 days, resulting in hepatic differentiation. Hepatic differentiation of EBs cultured in ICC scaffolds with different pore sizes was analyzed by evaluating the expression of protein markers. The EBs were fixed and immune-stained with GATA-4, CK-18, and counterstained with DAPI. GATA-4, an early transcription factor, which indicates onset of hepatic maturation, was highly expressed in the differentiating cell population [Reference Schwartz, Linehan, Painschab, Hu, Verfaillie and Kaufman33, Reference Capo-chichi, Rula, Smedberg, Vanderveer, Parmacek, Morrisey, Godwin and Xu34]. Meanwhile CK-18 is a mature hepatocyte marker [Reference Lange, Bassler, Lioznov, Bruns, Kluth, Zander and Fiegel35, Reference Ben-Ze’ev, Robinson, Bucher and Farmer36]. The percentage of differentiated EBs into hepatocyte-like cells was high [Figs. 6(b)–6(e) and 6(g)–6(j)]. However, the smallest EBs [Figs. 6(a) and 6(f)] demonstrates no differentiating toward hepatocyte-like cells.
Confocal microscopy images differentiated EBs in ICC scaffolds with diameters of 90, 170, 200, 270, and 400 µm on day 21. EBs were stained for markers of hepatic differentiation. GATA-4 (a–e) is shown in red and CK-18 (f–j) is shown in green, while the cell nuclei, counterstained with DAPI, are shown in blue. Images represent scans near the center of the EBs. Quantitative expression ratios of protein markers were processed from images (k).

Here, we found the cells in scaffolds with the pore sizes more than 90 µm expressed proteins of resultant GATA-4 and CK-18, which is indicative of hepatocyte-like cells to a certain extent. Accordingly, the expression of protein markers in differentiated cells was significantly reduced when the diameter of pore size was 90 µm, although they have showed decrease of SSEA-1 at the first stage of differentiation, which indicated ES cells could not form functional EBs within the holes in a small diameter to differentiate into specific lineages. GATA-4 and CK-18 are apparently observed in scaffolds with pores of 270 µm, while the expressions are lower in the pore of 170, 200, and 400 µm. Processed imaging data [Fig. 6(k)] showed the area fraction of marker-positive cells to DAPI-positive cells, which verified the fact that in the scaffolds with a pore size of 270 µm, cells showed highest expression for both markers of hepatic differentiation as 38 ± 2% of GATA-4 and 46 ± 3% of CK-18. In contrast, in the scaffold with the pore size of 90 µm, no mature hepatocyte markers CK-18 were detected. The highest production of hepatocyte-like cells in scaffolds with pores of 270 µm agreed with the endoderm development in the early stage of differentiation. The yield of hepatocyte-like cells derived from EBs is highly affected by not only the directed differentiation stage but also the early development of three germ layers. In addition, the diffusion of nutrients and growth factors in EBs plays a role for the differentiation process. While larger size of EBs may yield better endoderm and hepatic development, the diffusion of nutrient and hepatic growth factors is restricted in the core region of EBs and limits the differentiation process. From the results above, the optimal size of EBs for hepatic differentiation should be about 201.7 ± 29.6 µm cultured in the scaffolds with a pore size of 270 µm among all the groups.
Functionality test by PAS
To provide additional assessment of hepatic differentiation from EBs derived from ICC scaffolds with pores in five different diameters, periodic acid-Schiff (PAS) staining was used to detect the glycogen level that the hepatic-like cells stored. PAS is one of the metallic functions of hepatocytes [Reference Zhu, Rezvani, Harbell, Mattis, Wolfe, Benet, Willenbring and Ding37]. To observe cells in an entire EB, we sectioned the EBs together with ICC scaffolds into histology slices with a thickness of 1 µm/slice after 21-day culturing. Middle plane of the sectioned slices was examined under optical microscope for each group.
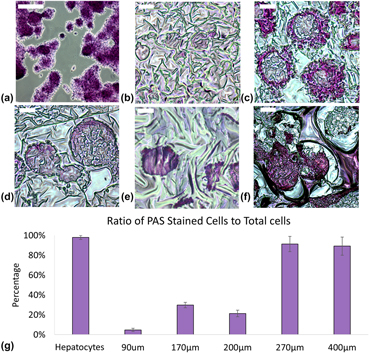
PAS staining revealed cytoplasmic deposits of glycogen stained with purple-magenta color in hepatocyte-like cells. The stained hepatocytes (HepG2, ATCC, Manassas, Virginia) were used as a control, which did show positive staining [Fig. 7(a)]. From the result of PAS staining, we found limited glycogen stored in 90 µm EBs [Fig. 7(b)] while larger size EBs show the functionality of glycogen storage [Figs. 7(c)–7(f)]. In the control group of hepatocytes exhibiting the ratio of PAS staining-positive cells (98% ± 2%) to overall number of cells, the cytoplasmic glycogen secreted by the hepatic-like cells can be easily observed in larger EBs. Noticeably, the stain was distributed uniformly throughout the EBs in group of scaffolds with pore size which is more than 200 µm, while the glycogen was detected only a thin layer close to the surface of EBs with a diameter of 152.0 ± 21.5 µm. In this case, the glycogen is possibly stored in myocyte-like cells which are from ectoderm of an embryo during the differentiation [Reference Lee, Chang, Bali, Chen and Yan38]. In contrast, glycogen stained bright pink was shown in cross-sections of EBs in diameters of 270 μm and 400 μm, which had large amount (>80%) of hepatic glycogen-stained cells [Fig. 7(g)]. These accumulations of PAS-positive material are seen as pink areas throughout the EBs. This result was also consistent with the expressions of early stage markers of differentiation for endoderm layer and hepatic specialized markers. From these results, we concluded that the optimal diameter of circular domains for hepatic differentiation was 201.7 ± 29.6 µm under the present experimental conditions.
PAS staining of EBs in ICC hydrogel scaffolds on day 21. Stained hepatocytes are as control (a). EBs (b–f) are obtained by ICC scaffolds with diameters of 90, 170, 200, 270, and 400 µm. Images are the cross-sections of scaffolds, which means the stained cells are from middle-plane of EBs. Quantitative evaluation of optical images with staining was shown in (g). Scale bar: 100 µm.

Conclusions
This work demonstrated that 3D biomimetic ICC scaffolds provide the suitable microenvironment for ES cell culture and was able to maintain the viability in vitro. The unique feature of the uniform and controllable pore size in scaffolds allow ES cells forming uniform EBs spontaneously within a narrow size distribution and establish the size effect on cell differentiation into hepatocyte-like cells. Expression of hepatic differentiation markers and liver-specific function was demonstrated to be strongly dependent on the diameter of EBs. We anticipate the presented system will contribute to the development of various physiological and pathophysiological 3D tissue models, which can be served as a valuable tool in vitro not only for understanding differentiation of ES cells for cell therapy and tissue regeneration but also can be widely used for other types of spheroid tissue culture for development of tissue engineering.
Experimental section
Fabrication of 3D scaffolds
Dried 1 g of soda lime glass beads with average diameters of 90, 170, 200, 270, and 400 μm (Thermo Fisher Scientific, Waltham, Massachusetts) were dispersed in 5 mL of ethylene glycol. A borosilicate glass shell vial (O.D. ¼8 mm, H¼ 35 mm) (Thermo Fisher Scientific) connected with a long Pasture glass pipette was used as a mold for CCs preparation. The complex unit was inserted in a glass tube (O.D. ¼10 mm, H ¼75 mm) that was halfway immersed in an ultrasonic water bath (VWR), and the inner space of mold was filled with ethylene glycol. 20 μL of glass bead suspension was released to the mold per 20 min until the thickness reached approximately 1 mm. After complete evaporation of ethylene glycol at 160 °C, the CCs were annealed for 4 h at 670–690 °C, depending on the size of beads, and then free-standing CCs were extracted from the mold.
Poly(acrylamide) hydrogel precursor solution (30% (w/w) acrylamide, 5% (w/w) bis-acrylamide, and 0.1% (v/v) N,N,N,N-tetramethylethylenediamine), prepared as described previously, were infiltrated into the CC by centrifugation and polymerized by addition of radical initiator [1% (w/w) potassium peroxide]. To visualize transparent hydrogel matrix, 0.05% (w/w) of fluorescent monomer (Poly511, Polysciences Inc. Warrington, Pennsylvania) was added to the hydrogel precursor solution. The infiltrated CC was cut out from the hydrogel and immersed in 5% (v/v) hydrogen fluoride (HF) solution for 24 h to dissolve the glass beads. Later, ICC scaffolds were sequentially washed with pH 3.0 hydrochloric acid (HCl) solution, pH 7.2 phosphate buffered saline (PBS) solution, and deionized water for 2 days in each solution with 3–4 times solution changing per day. ICC scaffolds were further freeze dried to completely remove remaining HF and reserved in dried state until used. The final dimensions of hydrated scaffolds were 6.4 mm in diameter and 1 mm thickness.
ES cell culture
129/Ola mouse ES cell line (ATCC) was maintained at undifferentiated state in T-75 flasks (Thermo Fisher Scientific) on mitotically inactivated mouse embryonic fibroblast cells in Dulbecco’s modified eagle medium–high glucose (Gibco-BRL, Gaithersburg, Maryland) containing 15% fetal bovine serum (Hyclone) Logan, Utah, 1× non-essential amino acids (Gibco-BRL), 2 mM glutamine (Gibco-BRL), 1000 U/mL mouse leukemia inhibitory factor-ESGRO® (LIF-ESGRO®, Millipore Sigma, Burlington, Massachusetts), 100M 2-mercaptoethanol (Sigma Aldrich, St. Louis, Missouri), and 100 U/mL penicillin and 100 μg/mL streptomycin (Gibco-BRL). To form EBs, 1,000,000 cells in a 25 μL of dense cell suspension (4 × 10⁶ cells/mL) were dropped on top of completely dried hydrogel ICC scaffold using a micropipette, and 975 μL of media was gently added. Total culture volume was maintained at 1000 μL, and half of media was changed every 2 days. As a control, mouse ES cells were seeded by HP method (2000 ES cells per 25 μL in each drop). Briefly, remove the lid from a culture dish (60 mm) and place 5 mL of PBS in the bottom of the dish. Invert the lid and deposit 20 of 25 μL drops onto the bottom of the lid. Place the lid back onto the PBS-filled bottom chamber. Once the spheroids formed by HD, they are transferred to the same culture condition as the spheroids in ICC scaffolds. All the medium was filtered using 0.22 μm SteriCup filter assembly (Millipore Sigma) and stored at 4 °C for no longer than 2 weeks.
Differentiation of ES cells to hepatocyte-like cells in vitro
After 6 days of EB differentiation, cells in two culture systems were induced to differentiate toward hepatic direction by adding specific growth media. The composition of the optimized hepatocyte differentiation medium contained DMEM (high glucose), 10% FBS, L-glutamine (1 mM), nonessential amino acids (1%), L-mercaptoethanol (0.1 mM), hepatocyte growth factor (HGF) 20 μg/mL, aFGF (50 μg/mL), Oncostatin (10 μg/mL), insulin-transferrin-selenious acid (ITS-1X), and dexamethasone (10–5 mM).
Live/dead assay analysis
Cell viability was observed using a Live/Dead Viability Kit (Invitrogen, Carlsbad, California). Add 20 μL of 2 mM EthD-1 stock solution to 10 mL of sterile, tissue culture–grade D-PBS solution (PH = 7.4) to give an approximately 4 μM EthD-1 solution. Combine the reagents by transferring 5 μL of 4 mM calcein AM stock solution to the 10 mL EthD-1 solution. The resulting approximately 2 μM calcein AM and 4 μM EthD-1 working solution is then added directly to cells. The stained cells were visualized under fluorescence microscope (Zeiss Axiovert 100M inverted microscope, Carl Zeiss Microscopy, San Diego, California) at 20×. Digital images were acquired with a CCD camera and analyzed by an imaging system (LSM, Carl Zeiss Microscopy).
Detection of EBs formation and hepatic specific proteins by confocal microscope
Cultured ES cells grown in scaffolds after 6 and 20 days of differentiation were fixed with 4% paraformaldehyde (freshly prepared) for 20 min at room temperature, for specific protein detection. For nuclear proteins, the cells were permeablized with 0.3% Triton X-100 (Sigma Aldrich) for 5 min at room temperature and processed further. After aspirating the fixative, cells were washed three times for 5 min each with PBS. Nonspecific binding was blocked with PBS containing 1% rabbit serum in PBS for 2 h at room temperature. The cells were then incubated with primary antibody (Oct-3/4, SSEA-1, GATA-4 Santa Cruz, Dallas, Texas; CK-18; Chemicon, Thermo Fisher Scientific, 1:100) in 10% rabbit serum overnight at 4 °C. Next, the cells were washed with 1× PBS three times for 5 min each. The cells were then incubated with secondary antibodies anti-rabbit-FITC for SSEA-1 and CK-18; anti-rabbit-TEXAS RED for Oct-3/4 and GATA-4 (Santa Cruz; 1:500) in 0.1% rabbit serum at 37 °C for 30 min. After giving three washes (5 min each) with PBS, the cells were exposed to 1 mg/mL DAPI solution for 1 min. After washing the cells twice for 5 min each with 1× PBS, they were ready for confocal imaging. Images were analyzed by ImageJ software (https://imagej.nih.gov/ij/).
Detection of stored glycogen by PAS staining
The PAS technique was used to determine the presence of insoluble stored glycogen content in the cells. Briefly, hepatocyte-like cells after 20-day differentiating in scaffolds of different pore sizes were fixed with 4% paraformaldehyde at room temperature for 15 min. It was then oxidized with 1% periodic acid for 5 min, rinsed with distilled water for 5 min, and treated with Schiff’s reagent for 10–15 min. After rinsing in distilled water for 5 min, scaffolds were counterstained with Mayer’s hematoxylin stain for 30 s and observed under light microscope.
Acknowledgments
The central part of this work was supported by the MURI project from the Department of-Army W911NF-10-1-0518 Reconfigurable Matter from Programmable Colloids, assistance with electron microscopy, and for the NSF grant #DMR-9871177 for funding of the FEI Nova 200 analytical electron microscope used in this work.