I. INTRODUCTION
Efficient harnessing of solar energy can provide an alternative solution for our energy crisis resulting from dwindling fossil fuels Reference Lewis and Nocera1 ; increasing greenhouse gases Reference Rodhe2 ; and an increasing population aspiring to energy consumption similar to that of developed world. Reference Stainforth, Aina, Christensen, Collins, Faull, Frame, Kettleborough, Knight, Martin, Murphy and Piani3 Current practical approach to exploit this energy is to convert it into electrical energy (photovoltaic effect) using solar cells.
Current mass-produced commercial photovoltaic cells traditionally use amorphous silicon as an active material. Reference Carlson and Wronski4 The photo conversion efficiency (PCE) of such a cell is generally about 13.6%. Improved PCE is obtained using crystalline silicon-based devices (∼25.6%) Reference Ruecha, Rangkupan, Rodthongkum and Chailapakul18 but at a much higher cost. Reference Keppner, Meier, Torres, Fischer and Shah5 Several other high efficiency solar cells such as cadmium indium gallium selenide with a PCE of ∼26–29%, dye-sensitized solar cells (DSSC) with a PCE of >11.5%, and perovskite-based cells with a PCE of 18% are known. All these solar cells are generally more expensive, may use hazardous chemicals and provide lower energy per dollar than conventional fossil fuels. For solar cell technology to successfully compete with fossil fuels, the cost of solar cells must decrease and the efficiency of photon-to-current conversion efficiency must increase. Reference Lewis6,Reference O'Regan and Grätzel7
Carbon-based materials such as C60 fullerene, carbon nanotubes, and graphene have excellent physical properties, possess high charge carrier mobility and are generally easy to manufacture. In particular, graphene is currently being extensively studied due to its excellent conductivity. It was reported in the literature that integration of graphene into PV devices improves the stability which is an important parameter to consider in PV device fabrication. Reference Singh and Nalwa8,Reference Bernardi, Lohrman, Kumar, Kirkeminde, Ferralis, Grossman and Ren9 Graphene can be manipulated into nanosheets for the fabrication of thin layers of conductive electrode. Reference Kim, Zhao, Jang, Lee, Kim, Kim, Ahn, Kim, Choi and Hong10 The use of graphene nanosheets can be a suitable alternative to conventional electrode used in PV device fabrication for flexible PV device, Reference Iijima11 DSSC as photoanode, Reference Singh and Nalwa12 supercapacitors, Reference Fan, Yan, Zhi, Zhang, Wei, Feng, Zhang, Qian and Wei13 bulk-heterojunction solar cells, Reference Singh and Nalwa14 lithium batteries, Reference Reddy, Srivastava, Gowda, Gullapalli, Dubey and Ajayan15 electrochemical biosensors, Reference Wang, Shao, Matson, Li and Lin16 etc.
In recent years, cellulosic paper has been used as a flexible substrate for many electronic device applications. Many properties of paper including low cost, flexibility, light weight, and ready availability make it attractive over other substrates for the fabrication of flexible devices. Combination of graphene and paper substrate is widely used in many areas where graphene ink was printed onto paper substrate using inkjet printing. Reference Huang, Huang, Liang, Wan and Chen17,Reference Ruecha, Rangkupan, Rodthongkum and Chailapakul18 Graphene printed paper-based devices have found applications in UV sensing, microfluidic devices, piezo-resistive sensors, glucose biosensors, batteries, supercapacitors, and transistors. Reference Kong, Gu, Li, Chen, Xu and Wang19–Reference Liang, Xiaogan and Chou22
In this manuscript, we report on the design, fabrication, and testing of PV devices primarily based on paper and polyester transparency sheet substrates. Reference Brus and Maryanchuk23 Cost concerns of some of the paper-based devices were described in the literature. Reference Fang, Zhu, Yuan, Ha, Zhu, Preston, Chen, Li, Han, Lee and Chen24–Reference Wang and Kerr26 The device described in the present case is inexpensive to fabricate and does not require state of the art instrumentation. Unprocessed commonly available microstructured cellulose paper and multilayered graphene (MuLG) obtained from H2B pencil were used in the PV device fabrication. Reference Barr, Rowehl, Lunt, Xu, Wang, Boyce, Im, Bulović and Gleason27 MuLG acted as hole collection electrode and charge carrier intermediate within the active material. Reference Kurra and Kulkarni28 The photon-to-current efficiency (PCE) of the device was ∼1.8%. Other pencil sources (9B, 2B) were also used for making conductive MuLG layer, however, H2B provided the best PV response. Our experiments suggest that MuLG-based devices exhibited similar PV response as indium tin oxide (ITO)-based devices. Thus, our experiments demonstrate feasibility of use of MuLG as an alternative to ITO for conductive electrode layer in PV and other electronic devices. Reference Weaver, Zakeri, Aouadi and Kohli29
II. MATERIALS AND METHODS
A. Materials
PTCDA was purchased from Sigma Aldrich. MuLG source was an H2B pencil for the fabrication of one of the conducting electrodes. CdSe quantum dots were synthesized in our lab using standard synthetic processes. Reference Peng, Manna, Yang, Wickham, Scher, Kadavanich and Alivisatos30 Trioctylphosphine oxide (TOPO), octadecylamine (ODA), stearic acid, cadmium oxide (CdO), selenium, trioctylphosphine (TOP), and poly(3,4-ethylenedioxythiophene)poly(styrenesulfonate) (PEDOT:PSS) were purchased from Fisher Scientific.
B. Methods
The characterization of QDs was performed using UV–visible (Perkin-Elmer Lambda 25) and fluorescence (Perkin-Elmer LS-55) spectroscopy, scanning electron microscopy (SEM, FEI Quanta 450), and transmission electron microscopy (Hitachi 7650). The device characterization was carried out by using an AM 1.5 solar simulator (Newport Inc.) with a 150 W Xenon arc lamp. The photon flux was 130 mW/m2 at a distance of 0.6 m from the source light and was measured using a Melles Griot photodetector. Photo-induced current–voltage curves were measured using a Keithley 6487 picoammeter/voltage source at an external bias between 0 and 1 V. All the current–time measurements were made on a 1 cm2 device as otherwise noted.
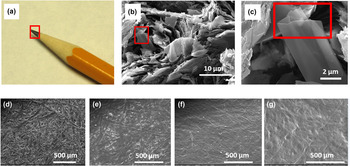
The MuLG coating on the paper substrate was deposited under optical microscope to investigate the quality of MuLG coating while being applied. The pencil was lightly rubbed on the paper until a uniform layer of the MuLG was formed. We have found that several strokes of the pencil on the paper in a periodic manner were necessary for electrical conductance consistency. The coating efficiency was checked under microscope to ensure the homogeneity. Uniform thickness with large MuLG gaps on the paper appeared to significantly degrade the device quality. The thickness of MuLG (5 μm) was measured using profilometry Nanovea ST-400. As shown in Fig. 1(e), the SEM of paper coated with MuLG formed a uniform layer without significant defects. The thickness of the PEDOT:PSS and active layer were 40 and 60 nm, respectively, measured using a Park Scientific-Auto probe AFM (Model: AP-0100). The top gold–palladium contact of ∼40 nm was deposited by using a Denton Vacuum Desk III sputter coater.
(a) An optical image of the tip of a pencil lead that was MuLG source. (b) An SEM image of red-rectangle of the MuLG source shown in (a). (c) A higher resolution SEM image of MuLG present in the red box in (b). The SEM images of the uncoated fibrous paper substrate (d), MuLG electrode coated on paper substrate (e), MuLG and PEDOT:PSS coated on the paper substrate (f), and MuLG, PEDOT:PSS, and active material coated paper-based device (g).

C. Cadmium selenide (CdSe) quantum dot synthesis
CdSe fluorescent QDs were synthesized using standard procedures. Reference Dharmadasa31 13 mg of CdO and 0.10 g of stearic acid were added to a 100 mL round bottom flask at 150 °C under argon flow until the solution became optically clear. 2.05 g each of ODA and TOPO were then added to the reaction mixture at 150 °C. The temperature of the flask was raised to 300 °C with 50 °C increments and heated until the reaction mixture turned pale yellow. At this point, 79 mg of Se powder dissolved in 1 mL TOP was injected into the flask kept at 300 °C. The samples were extracted at intervals of 5–10 seconds immediately after addition of last reactant into glass test tubes and were allowed to cool to room temperature. A mixture of chloroform (1 mL) and ethanol (5 mL) was added to each tube and the mixture was shaken vigorously to remove excess amine and TOPO as much as possible from the solution. Tubes containing QDs, ethanol, and chloroform were centrifuged at 10,000 rpm for 5 min. The hydrophobic QDs were collected as pellets at the bottom of the tubes. The pellets of QDs were suspended in 2–3 mL of fresh chloroform.
III. RESULTS AND DISCUSSIONS
A. Fabrication of PV device
In recent years, a significant research effort is being focused on exploring a wide range of alternative materials Reference Bach, Lupo, Comte, Moser, Weissörtel, Salbeck, Spreitzer and Gratzel32–Reference Chou, Zhang, Fryxell and Cao35 that can enhance performance of the PV devices. There are two basic factors that one must take into consideration when designing a functional solar cell: device fabrication, and cost of fabrication and materials. The material selection is a key parameter for optimal device performance. The materials used in the solar cell fabrication should have appropriate electronic and photonic stability over time. The overall cost of the material and fabrication should be low for them to compete with traditional fossil-based energy.
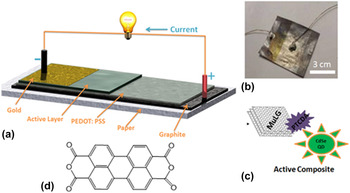
We demonstrate here a simple and easy strategy for fabricating a photovoltaic device composed of inexpensive and easy to access materials on a flexible substrate. On a printing paper (BIOSE X-9) was deposited a ∼5 μm thick layer of MuLG electrode by rubbing an H2B pencil against the paper surface. The typical average resistance of a 5 μm MuLG electrode value was ∼5 kΩ/cm2. A thin layer (∼40 nm) of PEDOT:PSS (electron blocking material) dissolved in nanopure water was spin coated uniformly on the MuLG cathode. Reference Reynolds, Barker, Greenham, Friend and Frey36 The active layer consisting of 1 µM CdSe QDs, 1 µM PTCDA, and 50 mg/L MuLG was drop-cast on PEDOT:PSS–MuLG-coated paper substrate. It was dried and annealed in an oven for 15 min at 50 °C. The device fabrication was completed by depositing a thin (40 nm) gold–palladium electrode as the top electrode (Scheme 1).
(a) Schematic of the paper-pencil PV device fabrication shows the fabrication process. (b) A typical PV device fabricated using paper-pencil. (c) The active components of the active layer are shown in the Scheme 1A. PTCDA molecule acts as a bridging molecule between donor QD and acceptor MuLG. (d) The chemical structure of PTCDA molecule that facilitates charge transfer between donor and acceptor.

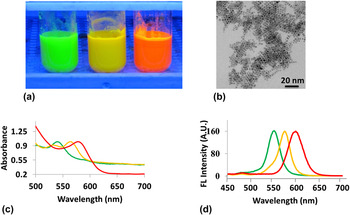
CdSe QDs were optically characterized using UV–visible Perkin Elmer Lambda 25 and photoluminescence Perkin Elmer LS-55 spectrophotometers, respectively. Reference Alivisatos37,Reference Brus38 CdSe QDs synthesized in this work absorb and emit in the UV–visible portion of the spectrum between 300 and 800 nm (Fig. 2). A typical transmission electron micrograph (TEM) of ∼4 nm yellow QDs is shown in Fig. 2(b). The concentration of QDs was estimated using Beer's Lambert law Reference Swinehart39 A = εbc, where c is the concentration, A is absorbance, b is optical path length (1 cm), and ε is the molar extinction coefficient of the QDs. ε was empirically estimated by using the following equation Reference Yu, Qu, Guo and Peng40 :
 $$D = \;\left( {1.6122 \times {{10}^{ - 9}}} \right){\lambda ^4} - \left( {2.6575 \times {{10}^{ - 6}}} \right){\lambda ^3} + \left( {1.6242 \times {{10}^{ - 3}}} \right){\lambda ^2} - \left( {0.4277} \right)\lambda + \left( {41.57} \right)\quad ,$$
 $$\varepsilon = 5857{\left( D \right)^{2.65}}\quad ,$$
where λ is the excitation maximum of QDs in the UV–vis spectrum, and D is the diameter of the nanoparticle. The estimated extinction coefficient of green CdSe QDs with an average diameter of 4 nm is 2 × 10⁵ M−1 cm−1. This value is in agreement with the literature value of 105 M−1 cm−1. Reference Sun and Goldys41
(a) CdSe quantum dots of different sizes. The QD size increases from green to orange red. The photograph was taken under UV light illumination. (b) A TEM image of 4 nm CdSe QDs. (c) UV–visible spectra of green, yellow, and red QDs showed absorption peaks centered at 540 nm (green), 560 nm (yellow), and 579 nm (red), respectively. (d) The corresponding emission peaks were observed at 551 nm (green), 574 nm (yellow), and 598 nm (red), respectively.

B. Scanning electron microscopy characterization
The source of MuLG in our experiments is a commercially available H2B pencil [Fig. 1(a)]. Figures 1(b) and 1(c) show high resolution SEMs of MuLG particles obtained on paper following writing with a pencil. MuLG particle size ranges from submicron to >10 μm were observed in the SEM images [Fig. 1(b)]. The thickness of MuLG particle in red rectangle in Fig. 1(c) is ∼34 nm that corresponds to ∼100 graphene layers. The cellulose fibers were clearly observed in SEM prior to coating on the paper [Fig. 1(d)] but an over layer coating appeared in the SEM images after deposition with MuLG [Fig. 1(e)]. Figures 1(f) and 1(g) shows PEDOT:PSS-coated and active material-coated device, respectively. The MuLG coating and active layers deposition on the paper appeared continuous without defects in them [Figs. 1(e)–1(g)]. The thickness of the MuLG electrode was measured ∼5 μm. Assuming a single graphene layer is about 0.33 nm, Reference Partoens and Peeters42 there are ∼15,000 layers of graphene is deposited on the substrate. The continuous MuLG provided good electrical conductivity for charge collection (∼5 kΩ/cm2).
C. X-ray diffraction (XRD)
Powder XRD patterns of individual components (paper, MuLG, QD) and whole device were acquired to ensure that the integrity of the materials used in the device fabrication and that of the substrate (paper) was chemically maintained after the deposition of materials for device fabrication. Figure 3(a) shows an XRD pattern of cellulose paper used for the fabrication of a typical working device. The pattern clearly indicates the presence of two broad peaks from cellulose and the six sharp peaks associated with calcium carbonate which is common filler in paper.
Reference Xu and Poduska43
Cellulose composed of crystallographic and amorphous domains with sizes ranging between 5 and 50 nm.
Reference Moon, Martini, Nairn, Simonsen and Youngblood44,Reference Garvey, Parker and Simon45
The blue peaks labeled from P1 to P8 in Fig. 3(a) with two broad peaks (P1 and P2) originate from cellulose that is main component of the paper. The rest of the peaks, P3 through P8 correspond to (104), (110), (
 $01\overline 3$
), (202), (018), and (
 $11\overline 6$
) of calcite, respectively.
Reference Rahman, Halfar and Shinjo46
These peaks match with expected calcite peaks [red peaks in Fig. 3(a)]. The presence of a new sharp peak at scattering angle 2θ ∼ 26° represented by “G” in Fig. 3(b) corresponds to MuLG after the deposition of MuLG on to the paper substrate. We did not observe any positional change of P1–P8 peaks in XRD spectrum after the deposition of MuLG on the paper indicating that the layered structure of paper remained intact. In Figs. 3(c) and 3(d), the additions of PEDOT:PSS, QD, and PTCDA did not result in new scattering peaks in the spectrum. This is attributed to a lower concentration of PEDOT:PSS, QD, and PTCDA on the paper device than the detection limit of the instrument. Also, note that the presence of a layer composed of QDs, PTCDA, and PEDOT:PSS over MuLG reduced the scattering intensity of the graphene crystalline domain in Fig. 3(d).
(a) XRD pattern of the plain paper substrate used in device fabrication shows the presence of CaCO3 and cellulose peaks. P
i
(i = 1–8) correspond to peaks from cellulose and CaCO3. The peaks P3 (29.7°), P4 (36.1°), P5 (39.6°), P6 (43.3°), P7 (47.8°) and P8 (48.7°) correspond to (104), (110), (
 $01\overline 3$
), (202), (018), and (
 $11\overline 6$
) planes of CaCO3, respectively, whereas the peaks P1 and P2 are associated with cellulose of the paper. (b) XRD spectrum of a MuLG electrode deposited on paper shows a crystalline “G” peak at 2θ ∼ 26° of MuLG. (c) XRD spectrum of PEDOT:PSS deposited on MuLG. (d) XRD of the whole device but without a top contact did not show XRD peaks from QDs, PTCDA, or PEDOT:PSS probably due to a lower concentration of QDs, PTCDA, and PEDOT:PSS on the device than the detection limit of the instrument.

D. Photo-physical quenching studies
Photo-physical fluorescence quenching study of CdSe (donor) by PTCDA and MuLG (both acceptor), and that of PTCDA and QD-PTCDA (both donors) by MuLG (acceptor) provided useful information on electron transfer from excited donor to acceptor in our investigations. These studies are much easier and faster to perform and can provide semiquantitative information on photon-to-current conversion prior to the device fabrication. This is because the driving force for charge generation for PV devices comes from photo-excitation of donor molecules. The excited donor molecules can relax to its ground state through many deactivation processes. Two of the relaxation processes from excited state to ground state of the particle are charge transfer to electrodes and photo-emission. These two processes compete with one another—larger charge transfer to electrodes is expected to result in increased emission quenching although the reverse may not be true in all the cases because of complex nature of charge transport to electrodes. In any case, fluorescence emission studies are simpler to perform as compared to multistep device fabrication followed by PCE conversion testing.
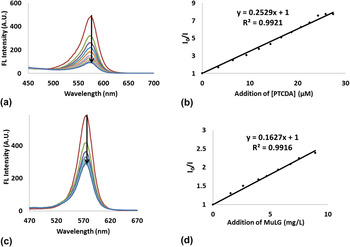
In the present case, the particles (CdSe and CdSe–PCTDA) and molecules (PTCDA) in the excited state can lose emission by relaxing to ground state (or valence band) through electron transfer to MuLG. Figure 4(a) shows the fluorescence emission quenching of CdSe in the presence of PTCDA in solution. In these experiments, each data point was acquired by adding 10 µL (0.054 μM) of PTCDA to a 0.05 μM QD solution. The Stern–Volmer plot in Fig. 4(b) provides photo-physical intermolecular deactivation of QDs in the presence of a quencher (PTCDA). Stern–Volmer relationship is of the form I 0/I = 1 + K sv[Q], Reference Keizer47 where I 0 and I are donor emission intensity in the absence and presence of quencher, respectively. K sv represents the Stern–Volmer constant which is a measure of accessibility of PTCDA (acceptor) to QDs (donor). The purpose of using PTCDA in the composite is to increase the binding between QDs and MuLG. This increased binding between QD and MuLG is expected to provide enhanced probability of electron transport from QDs to MuLG.
(a) Fluorescence quenching spectra of QDs with PTCDA. Each data point corresponds to addition of 10 μL of 0.05 μM PTCDA to the QD solution. The initial QD concentration was 0.05 μM. (b) The Stern–Volmer plot for QD–PCTDA pair; the quenching constant for the QD–PCTDA pair was 0.25 L/μM. (c) Fluorescence emission quenching spectra of QDs following addition of the MuLG to the solution. Each data point corresponds to addition of 0.01% w/w of 100 μL MuLG to 2 mL of 0.05 μM PTCDA. (d) The Stern–Volmer plot shows the fluorescence emission quenching of QDs with MuLG gives the accessibility of QDs to MuLG. The Stern–Volmer constant for QD–MuLG pair was 0.16 L/mg.

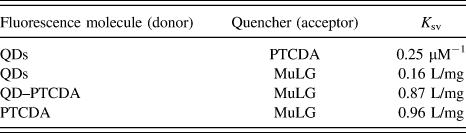
Table I shows K sv for different donor–acceptor combinations possible in our studies. Larger K sv indicates an enhanced photo-induced quenching of excited state donors by acceptors, and it possibly may also suggest efficient charge transfer between donor and acceptor. Figure 4(c) shows that the quenching of 0.05 μM QD solution by 0.01 wt% of MuLG. K sv for QDs (donor)/MuLG (acceptor) pair was 0.16 L/mg which is in agreement with literature value of 0.15 L/mg QDs (donor)/MWCNT (acceptor) system. Reference Weaver, Dasari, Datar, Talapatra and Kohli48 Experimental K sv values for the QD (donor)/PTCDA (acceptor) [Fig. 4(b)] and QD-PTCDA (donor)/MuLG (acceptor) (Fig. S1) pairs were 0.25 L/μM and 0.87 L/mg, respectively. These values are in agreement with a similar system of QD/ETPTCDI and QD-ETPTCDI/CNT systems that exhibited 0.31 μM−1 and 0.9 L/mg, respectively. Reference Pan, Cui, Ozkan, Ozkan, Xu, Huang, Liu, Chen, Li, He and Gao49 Interestingly, K sv value QDs–PTCDA (donor)/MuLG (acceptor) was >7 times that of QDs (donor)/PTCDA (acceptor) pair. This K sv large difference is attributed to the presence of PTCDA linker for QD–PTCDA/MuLG assembly where PTCDA provided “much tighter” interactions between QD and MuLG. These “tighter” interactions between QD and MuLG resulted in enhanced excited state QD quenching. For QD/MuLG case, much weaker interactions (such as van der Waals) between QD and MuLG are attributed to a significant lower K sv as compared to that for QD-PTCDA/MuLG system. The presence of highly reactive carboxylic anhydride from PTCDA formed a covalent bond with NH2 groups present on the surface of the QDs. The covalent binding between QD and PTCDA was confirmed by FTIR which showed strong peaks in 1600–1670 cm−1 region corresponding to amide C=O stretching from amine–anhydride reaction (Fig. S5). We also observed low intensity peaks in 1700–1750 cm−1 region possibly from some unreactive PCTDA or imide bond formation through a reaction between amine groups on QDs and anhydride bond from PTCDA following ring closure. However, ring closure after PTCDA-amine reactions is less likely because it involves high temperature. We also observed similar K sv values for PTCDA (donor)/MuLG (acceptor) and QD–PTCDA/MuLG further suggesting the use of PTCDA as a linker molecule led to enhanced interactions between QD and MuLG.
Summary of K sv values for different donor–acceptor pairs.

E. Photocurrent measurements on MuLG electrode
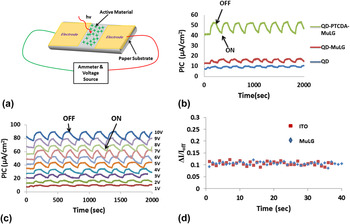
Prior to fabrication of the PV devices, we fabricated photodetector devices and tested photo-induced current (PIC) response on MuLG patterned electrode. Figure 5(a) shows a schematic of a typical device used for investigating the role of different components (QDs, PTCDA, and MuLG) on PIC. The resistance of the photodiode under dark and light at an applied bias of 10 V was ∼125 kΩ and 111 kΩ, respectively. Two MuLG electrodes (shown in yellow color) with a gap of 1 cm2 were fabricated on a paper strip. An active layer was deposited in the gap joining to electrodes. The PIC characterization of QDs alone, QDs–PTCDA, and QD–PTCDA–MuLG using this device is shown in Fig. 5(b). Further, the PIC values of the QD–PTCDA-based devices were found to be much higher than that of the devices fabricated using PTCDA as an active material (Fig. 7S). Similarly, QD–PTCDA–MuLG-based devices showed a much larger PIC response than devices composed of QD–MuLG. PIC response for the devices composed with PTCDA only are shown in Figure 7S. The most striking feature of these experiments is that the PIC for QD–PTCDA–MuLG mixture was ∼6 times that of QD–MuLG system under the same experimental conditions. These results are in agreement with our photo-physical quenching experiments, where K sv values for QD–PTCDA–MuLG system were ∼7 times that of QD–MuLG system (Figs. 4 and S1, and Table I). These results clearly reinforce our results that PTCDA linker between QD and MuLG facilitated the electron transfer from QD to MuLG, thereby, contributed to enhancing photodetector response. Furthermore, these results imply that photo-physical quenching studies can provide a convenient way of evaluating active materials for PV devices prior to device fabrication.
(a) Schematic of a two-electrode photodetector device composed of QDs, PTCDA, and MuLG nanocomposite. (b) PIC curves for QD only, QD–PTCDA pair, and QD–PTCDA–MuLG nanocomposite-based devices. (c) PIC response of two electrode-based device composed of QD–PTCDA–MuLG mixture under applied potentials ranging from 1 to 10 V. (d) Comparison of PIC between MuLG- and ITO-based devices. The active layer in all devices consists of 1 µM CdSe QDs, 1 µM PTCDA, and 50 mg/L MuLG was drop-cast on 1 cm2 of MuLG-coated paper.

Figure 5(c) shows a typical PIC-time response of two-electrode photodetector device at various applied potential biases.
Reference Geyer, Porter, Halpert, Mentzel, Kastner and Bawendi50
PIC increased linearly with increased applied potential across two MuLG electrodes showing an ohmic response.
Reference Xu, Sheng, Li and Shi51
The “ON” and “OFF” in Fig. 5 correspond to light and dark current, respectively. That is, “ON” and “OFF” are PIC in the presence and absence of the photo-excitation of QD–PTCDA under an applied potential. We also compared the PIC-time response of MuLG with a similar ITO-based device. Figure 5(d) shows comparison of I
fraction–time response curves for MuLG- and ITO-based devices. Here,
 ${I_{{\rm{fraction}}}} = {{\Delta I} \over {{I_{{\rm{off}}}}}}$
corresponds to fraction increase in the PIC over dark current, and ΔI and I
off are increase in PIC following light excitation on the active material and initial current (dark current), respectively. Interestingly, both ITO- and MuLG-based devices showed similar time response. I
fraction ∼13% was achieved for both MuLG- and ITO-based devices suggesting that the photo-electrical performance of MuLG-based devices is comparable to that for ITO-based devices. Similarly, the time responses of MuLG- and ITO-based devices were similar to one other (Fig. S6).
We have also investigated the stability of our photodetector devices but not on the PV devices. The PIC-time experiments were performed at multiple temperatures (from room temperature to 110 °C) on two-electrodes-based photodetector devices fabricated using QD–PTCDA–MuLG. The PIC-time dependence for our devices remained stable up to 110 °C (Fig. 8S). Similarly, the PIC-time dependence for our devices did not degrade over more than 30 minutes at room temperature [Fig. 5(c)]. From these studies, the heating of the devices does not appear to affect significantly the PIC-time response for >5 min at 110 °C. However, the extended stability studies will be needed to fully understand and optimize the performance of the devices. Overall, these experiments clearly suggest that MuLG-coatings are appropriate and suitable for conducting electrodes for electrical and opto-electronic applications.
F. Role of PEDOT:PSS
PEDOT:PSS is an electron blocking molecule which is usually used for carbon-based PV devices. Reference Stocker, Kohler and Moos52 Our control experiments show that PIC for PEDOT:PSS-coated devices were ∼10 times the PIC for the devices fabricated without a PEDOT:PSS coating on them (Fig. S3). This photocurrent amplification confirms electron blockage capability of PEDOT:PSS thereby reducing exciton recombination. Reference Kim, Park and Chung53
G. The paper-pencil-based PV device
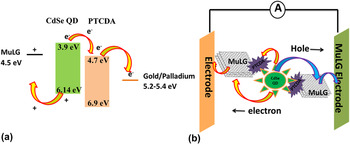
The primary electron-generating material used in our experiment is CdSe QD with a band gap of 2.31 eV. Reference Baskoutas and Terzis54–Reference Liu, Yang, Li, Fan and Li56 In general, the fluorescence emission of QDs is controlled by tuning the size of QDs Reference Smith, Mohs and Nie57 that provides control over the band gap of the QDs. CdSe QDs have been studied extensively and have been used in fabrication of transistors, Reference Klein, Roth, Lim, P Alivisatos and McEuen58 light emitting diodes, Reference Minot, Kelkensberg, Van Kouwen, Van Dam, Kouwenhoven, Zwiller, Borgström, Wunnicke, Verheijen and Bakkers59 bio-imaging, Reference Medintz, Uyeda, Goldman and Mattoussi60 and photovoltaic devices. Reference Huynh, Dittmer and Alivisatos61 The mechanism of electron generation and transfer to corresponding electrode originates from the exposure of the active area containing CdSe QDs and PTCDA to solar simulator. Upon illumination, the excited electron in QDs were transferred to gold–palladium [work function (φ) ∼5.3 eV] through PTCDA acting as acceptor (Fig. 6). Reference Sachtler, Dorgelo and Holscher62,Reference Oku, Takeda, Nagata, Noma, Suzuki and Kikuchi63 The electron is transported to the gold–palladium electrode through MuLG under an external bias. Similarly, the holes are transported to electron collector through MuLG charge transporter Reference Tongay, Schumann and Hebard64,Reference Yu, Zhao, Ryu, Brus, Kim and Kim65 (theoretical φ ∼4.5 eV, please see below for more discussion) from QD (Fig. 6). Thus, MuLG was used for two major purposes: first, MuLG was used for electrode material; and second, it acted as a charge transporter within the devices. Overall, MuLG is also a crucial linker that facilitated charge transport to electrodes. MuLG was also an electrode material in our devices (Figs. 6 and 7).
(a) Energy level diagram of the CdSe-PTCDA-MuLG-based PV paper device. (b) Schematic diagram showing possible charge transport pathways in our PV device. The electrons generated in the photoexcited QDs were transferred to the anode through PTCDA and MuLG. The holes migrated from the QDs to the MuLG electrode. MuLG particles also acted as charge-transporters in our devices. For simplicity, the physical contact between CdSe and MuLG is not shown for hole transport in (b).

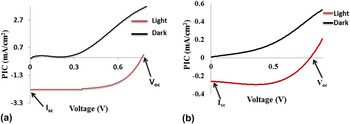
(a) I–V curves in the dark (black) and with light illumination (red) for a PV device with 5 cm2 of paper-pencil device. I sc and V oc were 2.3 mA/cm2 and 0.775 V, respectively. (b) I–V curve in the dark (black) and under the light illumination (red) of a device fabricated on transparent printing sheet with the area of 5 cm2. I sc and V oc of the device fabricated on transparency sheet were 0.3 mA/cm2 and 0.8 V, respectively. The active layer consists of 1 µM CdSe QDs, 1 µM PTCDA, and 50 mg/L MuLG drop-cast on a MuLG-coated paper or transparency.

H. I–V characteristics of paper-pencil device
Figure 7 shows typical I–V curves for two different PV devices fabricated on paper and plastic transparency. The PIC was recorded with a voltage sweep from 0 to 1 V. The short-circuit current (I sc) and the open-circuit voltage (V oc) are the maximum current and voltage achievable from this solar cell, respectively. For our device, I sc, V oc, and PCE for a typical PV device on paper were 2.3 mA/cm2, 0.775 V, and 1.8%, respectively. Excellent reviews on graphene-based solar cells are available in the literature. Reference Singh and Nalwa14 A similar PV cell system fabricated on poly(ethylene terephthalate) substrates utilized graphene/CdSe and graphitic carbon/CdTe exhibited PCE of 1.25 and 1.36%, respectively. Reference Ye, Gan, Dai, Dai, Guo, Meng, Yu, Shi, Shang and Qin66,Reference Brus, Maryanchuk, Ilashchuk, Rappich, Babichuk and Kovalyuk67
The PV devices demonstrated in this manuscript can be fabricated on other flexible substrates including adhesive tape, card board, and plastic using same procedures as described above. For example, we fabricated PV devices on printing transparency sheets. I sc and V oc of the PV device on transparency were 0.3 mA/cm2 and 0.8 V, respectively. The PCE for this device was ∼1% [Fig. 7(b)]. The efficiency on the transparency sheet was lower than that for similar devices fabricated on paper. We believe that a lower PCE efficiency for these devices was due to solvent incompatibility with polyester transparency. The optimization of material properties used in the fabrication of the device is expected to further enhance device performance.
The observed V oc in our devices needs some discussion in view of the work functions (φ) of the electrodes used in our devices. The V oc value of a photovoltaic device depends upon many factors including φ of the electrodes, intensity of the photoexcitation, and the charge density at the charge collecting electrodes. These parameters affect the V oc of the PV devices. In our experiments, we have used MuLG and gold/palladium electrodes for charge collection electrodes. The theoretical φ of graphene is ∼4.5 eV. Reference Giovannetti, Khomyakov, Brocks, Karpan, van den Brink and Kelly68,Reference Khomyakov, Giovannetti, Rusu, Brocks, van den Brink and Kelly69 However, the observed value of the φ also depends upon metal–graphene contact; φ has been observed to vary significantly (∼4.89–5.16 eV) from that of the theoretical φ value. Similarly, doping of the graphite with metal oxides has shown to significantly reduced the graphite φ in 3.44–4.05 eV range. Reference Kyas, Fleischhauer, Steinmetz and Wilhelmi70 The φ of the gold/palladium electrode is expected to be ∼5.2–5.4 eV (φ of gold and palladium are ∼5.4 and 5.22 eV, respectively). Reference Hölzl and Schulte71 Since our MuLG electrodes were derived from pencil which is known to compose doped-graphite suggested that the φ of our electrodes can be lower in values than theoretical value of the graphene of ∼4.5 eV. A lower φ value of the MuLG may lead to large difference in the φ of gold/palladium and MuLG electrodes which will yield enhanced V oc of our devices. These discussions also pointed to an important observation that the use of inexpensive doped-graphite (or doped MuLG) as an alternative to traditional electrodes in the device fabrication can be used for controlling the V oc of the PV devices. Overall, the observed φ values for our devices are attributed to the material properties of the electrodes (especially that of the MuLG) and charge density at the electrodes.
We would like to point out that all the fabrication steps and testing were performed in ambient wet lab conditions (∼21% oxygen and humidity between 30 and 70%). Oxygen is a well-known quencher and can significantly quench the excited molecular state. Reference Kautsky72 Oxygen can also permanently damage the device through photo-induced oxidation. We have not fabricated device and tested its performance in inert conditions. Under inert conditions, we expect the device performance to be superior to devices fabricated and tested in ambient conditions. Further, hermetically sealing the device can further enhance the performance of our device. The sealed devices will also protect the devices against oxidative and mechanical damage.
One of the drawbacks of using MuLG as a charge transporter in the active mixture is that MuLG transports both electrons and holes to the same electrode similar to devices constructed using carbon nanotubes. Reference Martel, Derycke, Lavoie, Appenzeller, Chan, Tersoff and Avouris73 This increases the electron–hole recombination probability, thereby, reducing the PCE. Separating charge transporter medium for electron and holes where only one type of charge (e.g., electron or hole) gets transferred to respective electrode would enhance the device performance. Reference Ikai, Tokito, Sakamoto, Suzuki and Taga74
IV. SUMMARY
We have demonstrated the fabrication of a low cost photovoltaic device from readily available and inexpensive paper and pencil. The main advantages of our work over conventional PV devices are a simple and easy fabrication process under ambient conditions and reduced fabrication and materials cost. The electrode fabrication process is as simple as writing with pencil on a paper. This fabrication does not involve complex or expensive instrumentation and can be easily replicated on many other commonly used materials including fabrics, scotch tape, dry-wall, etc. All the components for this device can be made available to public in a lost-cost kit consisting of a pen-like device for active material “ink” (QDs–PTCDA–MuLG), paper, pencil, and a conductive pen for “drawing” a PV cell on-demand. In our lab, we have achieved decent and reproducible power conversion efficiency close to 2% for paper-pencil-based devices. We reproducibly obtained I sc, V oc, and PCE of ∼2.3 mA/cm2, 0.77 V, and 0.38 V, respectively. These parameters make the device attractive for further studies.
Supplementary Material
To view supplementary material for this article, please visit http://dx.doi.org/10.1557/jmr.2016.281.
ACKNOWLEDGMENTS
We would like to acknowledge National Science Foundation (CHE 0748676), Office of Vice-Chancellor of Research, and Office of Sponsored Projects Administration (OSPA) at the Southern Illinois University at Carbondale (SIUC), and NIH (GM 106364) for partial financial support of this research. The Scanning Electron Microscope used in this work was purchased through a grant from National Science Foundation (CHE 0959568).