I. INTRODUCTION
Thermally conductive composites have become attractive candidate materials for numerous applications, particularly for thermal management of electronics. Modern microelectronic chips owing to their extremely high power densities require very high conductivities from materials used as gap fillers, heat spreaders, thermal pads and pastes, and thermal interface materials, which are vital components of the entire thermal management package and are critical to ensuring good thermal contact between the chips and the metal heat sinks. The aforementioned materials are typically polymers filled with metal (aluminum and silver) or ceramic (boron nitride, aluminum nitride, silicon carbide, etc.) particles to boost their thermal conductivities. Such conventional materials are, however, reaching the limits of performance and thermal management applications are seeking higher thermal conductivity polymeric materials. Another desirable characteristic of polymeric materials used in the thermal management of electronics, particularly consumer electronic devices such as laptops and cell phones, is their lightweight. Metal or ceramic fillers are typically high density materials and add undesirable weight to the composites. Consequently, it is worth considering that graphite, which owing to its relatively low density (2100 kg/m3) and very high thermal conductivity (up to ∼2000 W/m K),Reference Heremans and Beetz1,Reference Slack2 serves as an excellent alternative to conventional metal and ceramic fillers. The nanoscale manifestations of graphite are well known for its extremely high thermal conductivitiesReference Balandin, Ghosh, Bao, Calizo, Teweldebrahn, Miao and Lau3 and have great potential to be used as fillers in materials for thermal management applications. However, a glance at the literature reveals a different story, and after years of extensive research, it can now be concluded that the nanofillers, when used alone, owing to their size, lead to numerous interfaces in the composites and therefore a large aggregate thermal interface resistance in the composites.Reference Shenogin, Xue, Ozisik, Keblinski and Cahill4 As a result, the thermal conductivities of polymeric nanocomposites have remained quite low, or about 10 W/m K.Reference Gonnet, Liang, Choi, Kadambala, Zhang, Brooks, Wang and Kramer5
Carbon nanotubes (CNTs) are commonly studied nanoscale fillers for polymer nanocomposites. Following their discovery by Iijima Reference Iijima6 in 1991, CNTs were first reported as fillers for polymer nanocomposites by Ajayan et al.Reference Ajayan, Stephan, Colliex and Trauth7 in 1994. The extremely high thermal conductivity of the nanotubes led to early expectations that the conductivity of the polymer nanocomposites would also be enhanced by orders of magnitude, similar to what is observed with electrical conductivity. However, until very recently, polymer nanocomposites comprised of single and multiwalled carbon nanotube (SWCNT and MWCNT) fillers were reported to range from ∼0.2 to ∼10 W/m K.Reference Choi, Brooks, Eaton, Al-Haik, Hussaini, Garmestani, Li and Dahmen8–Reference Huang, Liu, Wu and Fan18 More recent studies have demonstrated higher conductivities by manipulating various parameters such as using MWCNTsReference Park, Cheng, Lu, Bao, Li, Tian, Liang, Zhang and Wang19 or carbon nanosheets in epoxy.Reference Veca, Meziani, Wang, Wang, Lu, Zhang, Lin, Fee, Connell and Sun20 Unlike electrical conduction, which is known to show a percolation behavior, the presence or absence of percolation effects in relation to thermal transport is still debated over. Some recent studies have reported the percolation effects to be significant for the tube–matrix and tube–tube thermal resistances typical of CNT composites.Reference Moniruzzaman and Winey21–Reference Hu, Grosberg and Shklovskii25 On the contrary, it was also established by other studies that the formation of a percolating electrical network does not lead to a dramatic increase in thermal conductivity of the nanocomposites,Reference Tian and Yang26 which can be attributed to the presence of huge thermal resistances at the interfaces.
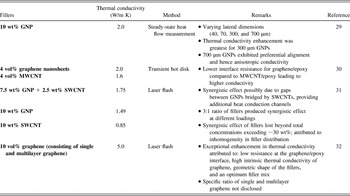
Graphene, the newest member of the family of carbon nanostructures, has also been investigated for possible applications as fillers in thermally conductive polymers. In addition to the extremely high thermal conductivity reported for single-layer graphene (5300 W/m K),Reference Balandin, Ghosh, Bao, Calizo, Teweldebrahn, Miao and Lau3 its two-dimensional shape holds promise for a reduced interface resistance compared to its tubular counterparts (nanotubes and nanofibers). Indeed, the thermal interface resistance for graphene has been reported to be ∼3.7 × 10⁻⁹ m2 K/W,Reference Konatham and Stroilo27 which is slightly lower than the value for CNTs (8 × 10⁻⁸ m2 K/W).Reference Huxtable, Cahill, Shenogin, Xue, Ozisik, Barone, Usrey, Strano, Siddons, Shim and Keblinski28 The combinations of different nanoscale fillers or the combination of a nanoscale filler with a microscale filler have also been explored recently. It should also be noted that a strict demarcation between graphene and graphite nanoplatelets (GNPs) is still missing from the literature, and hence the information reviewed in this section includes studies concerning exfoliated GNPs, which can be viewed as a precursor to graphene. Table I highlights and summarizes the key learnings from the various studies aimed at obtaining high thermal conductivities from polymer nanocomposites containing graphene/GNPs.
Summary of thermal conductivity enhancements in polymer nanocomposites containing graphene/GNPs.

Micro–nanohybrid composites may have the potential to achieve high thermal conductivities with relatively low overall filler loadings. Choosing the right combination or ratio of micro to nanofillers seems to be very important. For example, in one study, the thermal conductivity enhancement provided by a combination of GNPs and SWCNTsReference Yu, Ramesh, Sun, Bekyarova, Itkis and Haddon31 was not as high as that achieved with a combination of single and multilayer graphene.Reference Shahil and Balandin32 This could very possibly be due to the lesser structural mismatch (hence lower interface resistance), as the fillers in the latter combination are both planar. However, there is insufficient literature available on thermal properties of such hybrid composites, and it is necessary to further substantiate the hypothesis about the synergistic effect of certain combinations of fillers in enhancing the thermal conductivity of composites. Nonetheless, microfillers owing to their relatively large size should be, at least in theory, beneficial in producing a small number of interfaces per unit length in the composite, thus contributing to a high thermal conductivity overall. In addition, adding a small amount of nanofillers should enhance the interaction between the microfillers (by bridging the gaps between them), thus further increasing the thermal conductivity of the composite. Another possible way of looking at this is to take into account the increase in contact area between microfillers due to the presence of nanofillers between them. The increased contact area can definitely lead to reduced contact resistance at the interface between the fillers and hence lead to higher thermal conductivities for the composites.
Given all the lessons learned from the prior studies, it is fairly intuitive to see the immense potential of graphite for use in thermal conductivity enhancement of polymer composites. Graphite flakes certainly satisfy the requirement of large size thereby yielding a limited number of interfaces. Additionally, the planar shape means that the magnitude of the interface resistance is also likely to be lower than that for CNTs or nanofibers or fibers.Reference Bui, Duong, Striolo and Papavassiliou33 The larger surface to volume ratio of graphite/graphene compared to nanotubes and nanofibers provides better interaction with the polymer matrix, thus helps reduce the thermal resistance at the filler–matrix interfaces. Finally, the possibility of graphene nanoplatelets bridging the gaps between graphite flakesReference Yu, Ramesh, Sun, Bekyarova, Itkis and Haddon31 and hence reducing the overall porosity of the composites should also lead to enhancement in thermal conductivity. Such attributes in combination with small amounts of graphene to further mitigate interface resistance certainly make a promising recipe for a high thermal conductivity epoxy composite.
This article presents a description of the preparation and thermal characterization of a particular type of epoxy composite consisting of a combination of microscale and nanoscale fillers, which resulted in a maximum thermal conductivity of ∼42 W/m K as measured by the dual-mode heat flow meter technique. This value is significantly higher than the highest reported value to date (∼10 W/m K for aligned SWNT–buckypaper/epoxy composites).Reference Gonnet, Liang, Choi, Kadambala, Zhang, Brooks, Wang and Kramer5 The microscale filler of choice was exfoliated graphite while oxygen intercalated few layer graphene was chosen as the nanoscale filler, the details of which are given in the following sections. The article opens with a brief overview of the highlights from the literature on thermal conductivity of nanocomposites prepared with carbon nanofillers.
II. PREPARATION OF EPOXY–GRAPHITE–GRAPHENE COMPOSITES
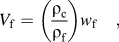
Nanocomposites were prepared with graphene and graphite as fillers in an epoxy matrix. The epoxy resin and hardener used were EPIKOTE Resin MGS LR 135i (L135i) [bisphenol-A-(epichlorhydrin), hexanediol diglycidylether] and EPIKURE Curing Agent MGS RIMH 1366 (alkyletheramine, isophoronediamine, aminoethylpiperazine, 4,4ʹ-isopropylidenebisphenol), respectively. The thermally conductive fillers of choice were Asbury Carbons 3807 surface enhanced flake graphite obtained from Asbury Carbons, Asbury, New Jersey and oxygen intercalated layer graphene (N002-PDR from Angstron Materials, Dayton, Ohio), respectively. The combination of graphite and graphene was chosen over other possible combinations of microscale and nanoscale fillers because graphene and graphite possess exceedingly similar atomic structures and can be expected to have the least amount of thermal resistance at the interfaces. In addition, the presence of oxygen in the graphene samples is likely to provide better chemical interaction with the epoxy matrix, which is known to be beneficial for the composite thermal conductivity. Composite samples were prepared for three different levels of total filler loadings, namely 35, 14, and 7 wt%, through ultrasonication with magnetic stirring of a dispersion of the fillers in acetone for 4 h followed by addition of the epoxy resin and hardener with an intermediate step involving de-gassing at 70 °C under vacuum for the complete removal of acetone and cooling following the addition of the epoxy resin and prior to adding the hardener. At this stage in the processing, the rheology was a function of filler content; high filler content samples behaved more like solids since the epoxy was used largely to wet the high surface area presented by the filler. The samples were finally press molded and cured overnight (6 h) at 90 °C. It should be noted that for each particular total filler concentration (35, 14, and 7 wt%), the relative amounts of graphite and graphene were varied from 100% graphite to 100% graphene (whenever possible). For the higher overall filler concentrations (35 and 14 wt%), it was not possible to prepare samples with graphene concentrations exceeding 1/7th of the total filler concentration due to the extremely low bulk density (hence a very high volume) of the graphene. For example, in the case of the samples with 35 wt% total filler, preparing a sample with more than 5 wt% graphene was not feasible from a polymer processing standpoint. The filler concentrations can be expressed in terms of volume fractions by using the following simple relationship:
 $${V_{\rm{f}}} = \left( {{{{\rho _{\rm{c}}}} \over {{\rho _{\rm{f}}}}}} \right){w_{\rm{f}}}\quad ,$$
where V f is the filler volume fraction, ρc and ρf (= 2100 kg/m3 for graphite and graphene) are the densities of the composite and the filler, respectively, and w f is the weight fraction of the filler. The density of the composite was calculated by experimentally measuring the mass and volume of the samples. The volume fraction of the epoxy matrix can also be calculated from Eq. (1) using the density of the neat epoxy, which is 1190 kg/m3, as listed in the manufacturer supplied data sheets. While, in the ideal case, the volume fraction of the epoxy calculated using Eq. (1) should be the same as that obtained from subtracting the volume fractions of all fillers from unity, in reality it is not unnatural to find air trapped in the composite samples, which prevents the volume fractions of all the solid components from adding up to unity. In other words, the samples can be somewhat porous, and it is important to take the potential presence of voids into consideration when analyzing the resulting thermal conductivities.
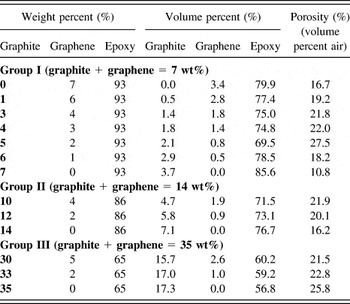
The compositions of the various samples (both in terms of weight and volume fractions) studied in this work along with their porosities (volume fraction of air) are listed in Table II. The composites were prepared so as to maintain or control the weight fraction, not the volume fraction constant. For instance, in samples containing overall 7 wt% fillers, while varying the relative concentrations of the fillers, it was chosen for all the samples to have a consistent 7 wt% of fillers instead of keeping the equivalent volume fraction constant. Theoretically, keeping the volume fraction constant is more logical as the volume fraction is what determines the properties of a composite. However, the porous nature of the composite samples was inevitable and somewhat uncontrollable, leading to slight variations in the expected volume fractions. Thus, even if the equivalent volume fractions were calculated beforehand and the fillers mixed with the epoxy matrix accordingly, the final composite cannot be guaranteed to preserve these volume fractions due to differing small amounts of air trapped in the epoxy during processing.
Compositions of the various epoxy composite samples prepared with graphite and/or graphene as fillers. The samples have been categorized into three groups based on the total concentration of fillers.

III. THERMAL CONDUCTIVITY MEASUREMENT RESULTS AND DISCUSSION
The thermal conductivities of the graphite and graphene fillers were measured using the thermal flash technique,Reference Mahanta and Abramson34,Reference Mahanta and Abramson35 which measures the thermal conductivity of a sample by recording the transient temperature profile of a heater/temperature sensor in contact with the sample of interest. Details on the theory and experimental setup of the thermal flash technique can be found in Refs. Reference Mahanta and Abramson34–Reference Mahanta, Abramson and Howe37. While the graphite flakes used in this work were measured to have a thermal conductivity of 1442 ± 176 W/m K, the graphene nanoplatelets only had a thermal conductivity of 776 ± 96 W/m K as discussed elsewhere.Reference Mahanta and Abramson36,Reference Mahanta, Abramson and Howe37
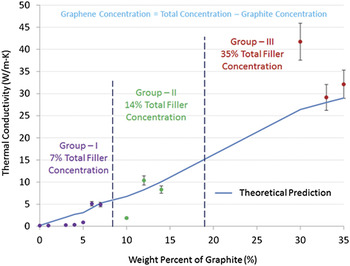
The thermal conductivities of the epoxy–graphite–graphene composites were measured using the dual-mode heat flow meter technique.Reference Mahanta and Abramson38 For this characterization method, the thermal conductivity of the sample is computed by monitoring the steady-state temperature gradient along the length of the sample. The measurements are conducted in a vacuum chamber maintained at a pressure of ∼10−5 Torr to avoid any convection effects from interfering with the thermal characterization. The typical experimental configuration involved a thin specimen (∼5 mm × 50 mm, width × length) in line with and contacting a similar sized piece of copper (Alloy 110 ASTM B-152, thermal conductivity of 388 W/m K). Two strip heaters were placed above and below the copper strip at one end and the entire assembly was suspended using clamps mounted on two end supports. The stainless steel base of the vacuum chamber was in thermal contact with the end support clamping the sample and served as the heat sink. Temperature data were obtained from eight thermocouples: two on the copper reference, four on the sample, one for measuring the temperature of the heat sink, and one for measuring the ambient temperature. The radiation heat losses from the surface of the sample are accounted for in the equation used for calculating thermal conductivity in this technique. The heat transfer along the length of the sample is modeled as a radiant fin and thermal conductivity is used as the fitting parameter. In other words, the value of thermal conductivity that yields the best match between the temperature gradient predicted by the radiant fin equation and the experimental data is the thermal conductivity of the sample. Once developed, the dual-mode heat flow meter technique was validated with a multitude of reference materials with conductivities ranging over three orders of magnitude (from 0.1 to >100 W/m K). The measurement technique and the results of validation have been described in detail in prior publications and interested readers are encouraged to refer to Ref. Reference Mahanta and Abramson38 for general technique requirements. In addition to validating the method against standard materials, the dual-mode heat flow meter was previously used by the authors to characterize the thermal conductivities of carbon nanofiber mats.Reference Mahanta, Abramson, Lake, Burton, Chang, Mayer and Ravine39 The nanofiber mats are free-standing networks of vapor-grown carbon nanofibers (VGCNFs) similar to CNT buckypapers and exhibited thermal conductivities ranging from 12 to 157 W/m K at different volume fractions of VGCNFs. Multiple measurements were conducted on three different specimens to take into account the experimental uncertainty. The measured thermal conductivities along with theoretical predictions, which are to be discussed in the following paragraphs, are shown in Fig. 1 as a function of the concentration of graphite. It should be noted that Fig. 1 shows the thermal conductivities only as a function of the graphite concentration. The graphene concentration of these samples can be calculated by subtracting the graphite concentrations from the total filler concentration (7% for Group I, 14% for Group II, and 35% for Group III). For instance, the Group III sample with 30 wt% (15.7 vol%) of graphite has 5 wt% (2.6 vol%) of graphene. Samples with graphene as the only filler could not be prepared for Groups II and III (samples with 14 and 35% graphene, respectively) due to processing difficulties and problems with structural integrity of the samples. The first observation is that the thermal conductivity of 42.4 ± 4.8 W/m K (nearly 250 times enhancement over the thermal conductivity of 0.17 W/m K of the pristine epoxy) obtained for the Group III sample with 30 wt% (15.7 vol%) graphite and 5 wt% (2.6 vol%) graphene is significantly higher than the highest thermal conductivity (or the thermal conductivity enhancement) reported for comparable samples in the literature. For example, Gonnet et al.Reference Gonnet, Liang, Choi, Kadambala, Zhang, Brooks, Wang and Kramer5 reported a maximum thermal conductivity of ∼10 W/m K for epoxy composites with ∼30 vol% aligned SWCNTs.
Comparison of the theoretical predictions for thermal conductivities with the experimentally measured values. The discontinuous nature of the theoretical prediction is due to the modification of the analytical equations to take into consideration the effect of porosity.

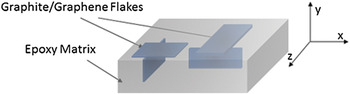
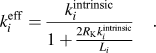
The thermal conductivity of the nanocomposites can be further understood using an analysis reported in the literature, which takes into account the thermal conductivity and aspect ratio of the fillers, and the thermal resistances at the interfaces between fillers and the matrix as well as between the fillers themselves.Reference Deng, Zheng, Wang and Nan40,Reference Deng and Zheng41 Proper application of the analytical equations also requires a thorough understanding of the distribution of the different fillers in the epoxy matrix. Because no special effort was made during the preparation of the epoxy composites for alignment of the fillers, a uniform distribution with random orientation can be expected for the fillers throughout the matrix. In the absence of a preferential orientation of the fillers, the assumption of an equal fraction of the fillers aligned along the three orthogonal axes is fairly reasonable. In other words, 1/3rd of the fillers are oriented parallel to each one of the three coordinate planes. Furthermore, the two-dimensional nature of graphite and graphene implies contribution from 2/3rd of the fillers to the thermal conductivity in a particular direction. The preceding statement can be better understood in relation to the diagrammatic representation (Fig. 2) of the arrangement of fillers in the epoxy matrix. As illustrated in the schematic, a graphite or graphene flake parallel to any one of the three coordinate planes (x–y, y–z, or x–z) contributes to the thermal conductivity in both coordinate axes contained in the plane. Following this, the thermal conductivity of the epoxy composites can be modeled using the following analytical equations that are based on the theory developed by Deng et al.,Reference Deng, Zheng, Wang and Nan40,Reference Deng and Zheng41
 $${{k_c^{\left( {x,y,z} \right)}} \over {{k_m}}} = \mathop\sum\limits_{i = 1}^{n = 2} {{f_i}} \left[ {{{{2 \mathord{\left/ {\vphantom {2 3}} \right. \kern-\nulldelimiterspace} 3}} \over {{{\left\{ {\left( {{{k_i^{{\rm{eff}}}} \mathord{\left/ {\vphantom {{k_i^{{\rm{eff}}}} {{k_m}}}} \right. \kern-\nulldelimiterspace} {{k_m}}}} \right) - 1} \right\}}^{ - 1}}}}} \right] + {f_m}\quad ,$$
 $$H\left( p \right) = {1 \over {{p^2} - 1}}\left[ {{p \over {\sqrt {{p^2} - 1} }}\ln \left( {p + \sqrt {{p^2} - 1} } \right) - 1} \right]\quad ,$$
 $$k_i^{{\rm{eff}}} = {{k_i^{{\rm{intrinsic}}}} \over {1 + {{2{R_{\rm{K}}}k_i^{{\rm{intrinsic}}}} \over {{L_i}}}}}\quad .$$
where k is the thermal conductivity, f is the volume fraction, p is the aspect (length/width-to-thickness) ratio, R K is the interface resistance, and L is the length of the filler in a particular direction, respectively. Among the subscripts, i denotes a certain filler, and c and m stand for the composite and matrix, respectively. The summation is carried over the two fillers (graphite and graphene). Finally, the superscripts eff and intrinsic refer to the effective and intrinsic thermal conductivities of the fillers, respectively, while the superscripts (x, y, z) represent the thermal conductivity of the composite in the x, y, or z-directions. For the purpose of this work, Eq. (2) as given has been modified slightly from the original form (found in Refs. Reference Deng, Zheng, Wang and Nan40 and Reference Deng and Zheng41) to take into consideration the porous nature of the samples (presence of voids) as the air trapped in the matrix impedes the thermal transport in the samples and must be accounted for essentially as an additional filler (hence the summation). Additionally, Eq. (2) only considers the contribution from the basal plane thermal conductivity of graphite/graphene flakes. The contribution from the crossplane thermal conductivity of the fillers is neglected for the purpose of modeling since the crossplane conductivity of graphite/graphene is at least two orders of magnitude lower than the basal plane conductivity. The intrinsic thermal conductivities of the fillers (1442 ± 176 and 776 ± 96 W/m K for graphite and graphene, respectively, as measured using the thermal flash method) get reduced to effective values (calculated to be 213 W/m K for graphite and 2.5 W/m K for graphene) according to Eq. (4) due to the presence of the thermal resistance at the interface of a filler and the matrix or between two successive fillers. The average lateral dimensions used in the analysis were 500 and 5 μm for graphite and graphene, respectively, and were taken from information presented in vendor data sheets. The value of the interface thermal resistance, R K ≈ 10−6 m2 K/W, was taken from the study of Moore et al.Reference Moore, Cummins, Jensen, Shi and Koo42 concerning carbon nanofibers and nylon-11 composites. This value was chosen over the other values (8 × 10⁻⁸ m2 K/W for CNT/CNT interfacesReference Huxtable, Cahill, Shenogin, Xue, Ozisik, Barone, Usrey, Strano, Siddons, Shim and Keblinski28 and 3.7 × 10⁻⁹ m2 K/W for graphene/graphene interfacesReference Konatham and Stroilo27) because it represents the resistance at filler/matrix interfaces, whereas the latter are only applicable for filler/filler interfaces. In the absence of any information relating to the fraction of fillers forming an interface with one another instead of the matrix, a single value was chosen for the interface resistance as the net thermal resistance of the entire composite is regulated by the higher of the two values.
Schematic showing the arrangement of graphite/graphene flakes in the epoxy matrix. 2/3rd of the flakes contribute to the thermal conductivity in any one of the three orthogonal directions.

Figure 1 first reveals that in the absence of graphene (see points corresponding to graphite wt% of 7, 14, and 35), the theoretical analysis does a reasonable job predicting the thermal conductivity of the composite. Second, there is a theoretical over-prediction of thermal conductivity of samples in Group I (total concentration of 7%) when the graphene concentration is more than 5 wt% (graphite concentration less than 2 wt%). A similar phenomenon is observed for the Group II samples (total concentration of 14%). This theoretical over-prediction arising when the graphene-to-graphite ratio is high indicates that the magnitude of the thermal resistance at graphene–epoxy interfaces must be higher than the value for graphite–epoxy interfaces. Note that the increase in the number of graphene–epoxy interfaces is very well accounted for in Eq. (2) and Eq. (4), and therefore the increase in the number of interfaces per unit length cannot explain the discrepancy.
Figure 1 also reveals that at some optimum ratio of graphene-to-graphite concentration, particularly when the amount of graphene is low but nonzero, the experimental results surpass the theoretical prediction. This occurs in each of the three groups, but is especially evident for the samples of Group III (total filler concentration of 35%) where the 30 wt% graphite/5 wt% graphene sample exhibits a higher thermal conductivity than the 35 wt% graphite sample. In fact, the composite thermal conductivity shows an abrupt increment at a relative graphite-to-graphene concentration ratio of 6:1 for all three groups of samples. The fact that the exact same ratio leads to a significant improvement in thermal conductivity at three different overall filler concentrations makes it more than a mere coincidence. However, it would be imprudent to generalize this 6:1 ratio to be applicable for all epoxy composites prepared using a hybrid graphite–graphene system. The ratio would obviously depend on the relative thermal conductivities of the two fillers, their aspect ratios, and the relative magnitudes of the interface thermal resistance. In addition, it is also very likely for the ratio to depend on the type of fillers as is evident from a 3:1 ratioReference Yu, Ramesh, Sun, Bekyarova, Itkis and Haddon31 reported for the combination of CNTs and GNPs in epoxy matrix. Nonetheless, given that the volume fractions used in the calculations were determined from experimentally measured densities of the samples, the only plausible explanation for such a theoretical under-prediction at these distinct ratios is that the interface resistance is lower than the value used in the analysis (∼10−6 m2 K/W).Reference Moore, Cummins, Jensen, Shi and Koo42 Similarly, previous studies dealing with the combinations of fillers attribute an abrupt increase in thermal conductivity for certain relative concentrationsReference Yu, Ramesh, Sun, Bekyarova, Itkis and Haddon31,Reference Shahil and Balandin32 to the nanoscale fillers bridging the gaps between the GNPs. In other words, the nanoscale fillers adhere to the graphite flakes and provide a “fin-like” structure to the surface of the graphite, providing a larger contact area and an additional thermal path, thus lowering the thermal resistance. Also important to consider is the effect of porosity on thermal conductivity. A look at the porosities of Group I (Table II) reveals that the addition of graphene to the composites does increase the porosity from 10.8 to 18.2%. However, this slight increase in porosity for these particular samples does not seem to have a detrimental effect on thermal conductivity, and the reduction in overall thermal resistance dominates the thermal behavior.
IV. SUMMARY
In summary, epoxy nanocomposites consisting of a mixture of graphite and oxygen intercalated graphene were prepared. A thermal conductivity of 42.4 ± 4.8 W/m K was obtained using the dual-mode heat flow meter technique for an epoxy nanocomposite containing 30 wt% graphite and 5 wt% graphene. This value is impressive compared to other polymer nanocomposites reported in the literature.Reference Gonnet, Liang, Choi, Kadambala, Zhang, Brooks, Wang and Kramer5,Reference Park, Cheng, Lu, Bao, Li, Tian, Liang, Zhang and Wang19,Reference Veca, Meziani, Wang, Wang, Lu, Zhang, Lin, Fee, Connell and Sun20 The high thermal conductivity (nearly 250 times that of the pristine epoxy) is likely due to the presence of the large graphite flakes, resulting in a low aggregate interface thermal resistance. Addition of relatively small amounts of the right nanoscale filler (graphene in this case) was seen to further enhance the thermal conductivity by providing better thermal contacts between the primary (microscale) fillers and/or the microscale filler and the matrix. However, continued addition of graphene at the expense of graphite was seen (and anticipated) to reduce the thermal conductivity of the composites due to the greater overall thermal interface resistances owing to the significantly smaller size of graphene. In the present work, a 6:1 ratio of graphite and graphene was observed to yield the best thermal conductivities at three different total filler concentrations (7, 14, and 35 wt%).