1. Introduction
Air pollution is an urgent and persistent environmental problem in many cities in developing countries. This is especially true in China, which is the biggest and fastest growing developing country in the world. Since 1978, the gross domestic product (GDP) of China has been growing at an average annual rate of over 9 per cent (Holz, Reference Holz2008). World energy increased by 10 per cent between 2004 and 2008 but total energy production in China increased by one-third over this same period (EIA, 2011). About two-thirds of China's energy comes from burning coal (National Bureau of Statistics, 2009). The resulting air pollution is staggering. Almost a quarter of cities in China failed to meet the residential area air quality standard to protect human healthFootnote 1 (National Bureau of Statistics, 2009). About 55 per cent of the urban population in China is exposed to PM2.5 and PM10 ambient levels that are five times higher than World Health Organization (WHO) guidelines (Larsen et al., Reference Larsen, Hutton and Khanna2008).
One major obstacle to developing sound air pollution policies in China is the lack of information about the value of air pollution damage (Wang and Mullahy, Reference Wang and Mullahy2006). Although contingent valuation (CV) has been used to value air quality in China, there are only a handful of studies. In Beijing, the mean value of reducing air pollution by 50 per cent has been estimated at CNY 143 (Wang et al., Reference Wang, Zhang, Li, Yang and Bai2006) and CNY 652 (Cai and Zheng, Reference Cai and Zheng2007). Unfortunately, all the contingent valuation method (CVM) studies in China (including those done in other cities, such as Wang and Zhang, Reference Wang and Zhang2009) rely on a hypothetical experiment posing a possible percentage reduction in air quality or meeting a standard. Whether respondents understood what these hypothetical changes meant to their own lives is unclear.
In this paper, we try an alternative valuation experiment. We rely on an actual experience of reduced air pollution. We study the temporary reduction of air pollution that accompanied the Beijing Olympics. In order to support the Summer Olympics of 2008, the Chinese government went to extraordinary lengths to reduce emissions in and around Beijing by limiting automobile use, expanding public transportation and temporarily shutting down some industries (Fu, Reference Fu2008). The average concentration of particulate matter (PM10) in Beijing in August 2008 was two-fifths of the annual average level in 2007 (BMEPB, 2007, 2008). The inhabitants of Beijing experienced a dramatic though temporary improvement in air quality. We take advantage of this rare policy experiment and ask residents what they would pay to maintain that level of air quality. A survey was conducted the year after the Olympics took place to find out what respondents would pay to maintain the level of air quality experienced during the Olympic Games.
We conducted a closed-ended CV questionnaire using discrete choice (Hanemann, Reference Hanemann1984; Arrow et al., Reference Arrow, Solow, Portney, Learmer, Radner and Schuman1993). We adopted a probit model of willingness-to-pay (WTP) (Cameron and James, Reference Cameron and James1987; Cameron, Reference Cameron1988). Further, we employed a double-bounded approach using a single follow-up question to the initial discrete choice question (Cameron and Quiggin, Reference Cameron and Quiggin1994).
The remainder of this paper is organized as follows: section 2 provides a description of the questionnaire and survey design and the econometric and statistical approach. Section 3 discusses the empirical results, and the paper concludes with a brief summary of results and a discussion of future research.
2. Survey design and econometric method
2.1 Survey and sampling design
The survey has three parts: introductory questions, WTP questions, and socioeconomic questions (see appendix for a copy of the survey). The design follows the NOAA panel recommendations for CV (Arrow et al., Reference Arrow, Solow, Portney, Learmer, Radner and Schuman1993). The introductory part determines whether the person belongs in the survey. They must be a resident of Beijing, have been living in the city during the Olympic Games, and be older than 18 to be in the survey. The introduction also asks about the respondent's general feelings about the Olympic Games and acquaints the respondent with the air quality improvement during the Games. These two questions are designed to provide information to the respondent in order to answer the valuation questions.
The second part of the survey includes the initial discrete WTP question and a follow-up WTP question depending on the first response. Two additional questions are asked of people who chose a zero WTP in order to determine whether they were protest votes.
(1) The WTP question was designed to pose a yes/no vote on a certain environmental policy.
(2) The initial bids were based on an earlier study (Wang et al., Reference Wang, Zhang, Li, Yang and Bai2006) and pretest results. The pretest used open-ended questions and was conducted in two districts in Beijing: Haidian and Changing. The follow-up bids are symmetrically placed to ‘bound’ 25–75 per cent of the observations (Kanninen, Reference Kanninen1993). The initial bids and follow-up bids in CNY are: 20(10/50), 50(20/100), 100(50/250), 250(100/500), 500(250/1000), 1000(500/2000).
(3) An annual tax is used as the payment vehicle in order to maximize the respondent's awareness of the financial implication of their responses (Mitchell and Carson, Reference Mitchell and Carson1989).
(4) We provide a definition of a household to prevent misunderstanding.
The WTP question is:
As you know, during the Olympic Games, there were many temporary measures to reduce air pollution emissions such as restricting the use of automobiles and shutting down huge industrial polluters. After the Olympic Games, these temporary efforts stopped and the air quality fell again. If the government kept air quality permanently at the level during the Olympic games, and it cost CNY ( ) each year in higher taxes to your household, would you vote for this program? Note that a household is defined here as all family members that are living together right now.
The third part of the survey captures several traditional socioeconomic characteristics: age, sex, marital status, education level, household size, car ownership and household income. These variables were selected taking into account results from previous studies.
The total questionnaire took each respondent about five minutes to complete. The short format increased the participation and completion rate.
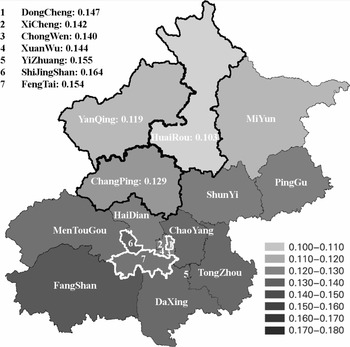
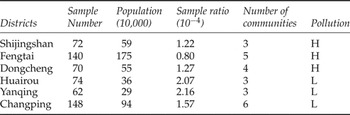
The survey was conducted from 14 June 2009 to 1 July 2009 in 24 residential communities within six districts in Beijing by four trained students, all of whom are native Chinese speakers.Footnote 2 As shown in figure 1 and table 1, half of the interviewees came from less polluted rural districts and half from polluted urban districts. This sampling design was intended to test whether the initial level of pollution affected the responses. Based on 2007 particulate concentrations (PM10), the three central districts of Shijingshan, Fengtai and Dongcheng represent highly polluted areas and the three peripheral districts of Huairou, Yanqing and Changping represent less polluted areas in Beijing. Note that the sampling rate was twice as high in the less polluted areas because they have much lower population densities. Communities in each district were selected near pollutant monitors. In order to make sure that respondents were not too heavily concentrated in one place, interviewees from 3–6 communities were selected in each district. The communities reflect a diversity of real estate values. A total of 585 questionnaires were collected, of which 566 were complete.
Average density of PM 10 (μg/m3) in different districts in Beijing

Sample statistics

Note: Population is the permanent population of the district.
Source: Beijing Statistical Yearbook, 2009.
2.2 The econometric and statistical model
This paper relies on a probit model to estimate WTP (Cameron and James, Reference Cameron and James1987; Cameron, Reference Cameron1988). The dependent variable is the probability of saying yes, and the bid and other socioeconomic variables are the independent variables.
We start by considering only the response to the first question. We assume that the true WTP of household i is

where X is a vector of explanatory variables, such as household income, age and education, β is a vector of estimated coefficients, and μ is a normally distributed error term. Each individual is confronted with an arbitrary randomly chosen threshold offer or bid. So the probability Pr of a respondent saying yes to initial bid, B 1, is:

and similarly the probability of saying no is:

We denote a ‘yes’ to any offered bid by y=1, and a ‘no’ to any offered bid by y=0; and assume that μ is independent and identically normally distributed: N(0, σ2). By standardizing, we can get:

where the standard normal random variable is z i. Hence,


where Φ is the standard normal cumulative density function.
In the double-bounded case, there will be another follow-up bid, either a higher bid B 2U or a lower bid B 2L. Following Cameron and Quiggin's (Reference Cameron and Quiggin1994) statistical model for the double-bounded case, we assume that the WTP underlying the first response and the second response has a bivariate normal distribution BVN(X i1 β 1, Xi2β 2, μ 1, μ 2, ρ. The mean WTP of respondent i underlying the two responses is: X i1β 1 and X i2β 2. The error terms of the two distributions, μ 1 and μ 2, are correlated by a correlation coefficient ρ. Hence, the chances of a respondent reacting to the two WTP questions with a yes–yes, yes–no, no–yes, and no–no response are:


where z i1 and z i2 are the standard normal random variables and φ (zi1, zi2, ρ) is the joint density function for z i1 and z i2.
A likelihood function can then be written using formulas (6)–(9); the maximum likelihood method is applied to solve the estimates of the vector of coefficients β 1, β 2, the standard deviation σ1, σ2, and the correlation coefficient ρ. We test whether the relationship between WTP and X iβ is linear or log-linear. In the log-linear case, the model is: lnWTP = X iβ + μ i. We use a log transformation of the bid amount as the independent variable (using ln(bid) instead of bid). This implicitly means that the underlying WTP function is exponential: WTP = e Xβ +μ.
In the log-linear case, the sample mean of WTP for each question is exp( iβ/β 0 + 0.5σ 2) and the median WTP is exp iβ/β 0) where is the row vector of the sample mean including 1 for the constant term, β is the column vector of estimated coefficients, and β 0 is the coefficient on the bid amount.Footnote 3 We explore different assumptions about β and β 0. In some of the double-constrained models, we assume that the coefficients can vary between the first and second WTP question. In other models, we constrain the two sets of coefficients to be the same.
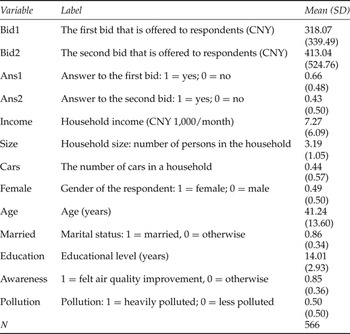
The definitions of the variables and the descriptive statistics are provided in table 2. Responses to the first bid and the second bid are used as dependent variables in the regression. The household size (size), number of cars owned (cars), household income (income), gender (female), pollution level (pollution), age of the respondent (age), marital status (married), and educational level (education) are used to capture the interviewee's socioeconomic background. Education, income, and age were collected as categorical variables and were converted to continuous variables. The variable awareness captures whether or not the respondent was aware of the air quality improvement during the Olympic Games. The variable pollution (pollution) defines whether the community in which the person lived is heavily polluted or not.
Definition of variables and descriptive statistics

3. Empirical results
We define protestors as people who both answered the WTP question with zero and responded to why with a reason suggesting that they were opposed to the question itself (Carson and Hanemann, Reference Carson, Hanemann, Maler and Vincent2005). For example, they opposed the tax, suspected the validity of the program, or thought the government should pay for it. Of the 102 respondents who answered zero, 95 were dropped as protestors.
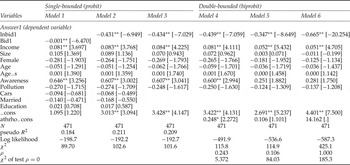
In order to measure WTP, several statistical models are estimated. We begin with the single-bounded dichotomous CVMs. The first part of table 3 presents the probit results using both a linear and exponential functional form. The first model presented is the linear regression and the last two are the exponential regressions. The two exponential models outperform the linear model. They have a better overall fit as seen by the log-likelihood function. Among model 2 and model 3, the parsimonious regression is preferred since the result of a likelihood ratio test that model 3 is nested in model 2 is: lrχ 2 = 0.97, p value = 0.8086. The key coefficients are also more significant. All the results from three single-bounded models in table 3 suggest higher bids decrease yes votes, higher incomes increase yes votes, and more awareness of the change in pollution during the Olympics increases the yes votes. Although we expected that people would pay more for pollution improvements in more polluted sites, whether a site is heavily polluted or not is not significant. Unfortunately, in this experiment, it is not clear whether the change in pollution was the same in the heavily vs. lightly polluted sites. It is also true that the less polluted sites were rural and may contain people who care more about pollution than the dense urban sites with high pollution. In any case, controlling for income, age and the other factors in the models, the urban and rural respondents did not have significantly different responses. Other control variables were also not significant including female, age, education, household size, being married and the number of cars owned.
Single-bounded and double-bounded dichotomous choice regression

Note: t-statistics in brackets. **1% significant level; *5% significant level.
Model 1 is a linear regression model; model 2 is an exponential regression model; model 3 is a parsimonious regression model based on model 2, and is also used in welfare estimation and double-bounded model fitting; model 4 is a biprobit model without any restriction; model 5 is a biprobit model restricting the mean, and variance of each WTP is equal; model 6 is a biprobit model further restricting ρ = 1.
The second part of table 3 presents the results of the double-bounded probit-exponential models. This analysis looks at the responses to both WTP questions in the survey. Several different models are presented. In model 4, the mean and variation of equations (1) and (2) are allowed to be different with an assumed correlation of ρ. In model 5, the coefficients of each variable in equations (1) and (2) are forced to be identical. That is, the underlying WTP function of the first response is assumed to be the same as the WTP function of the second response. Model 6 imposes a stricter constraint than model 5. It further restricts that the correlation term ρ=1. The constraints in model 6 assume that the two WTP responses not only have identical WTP distributions but also are perfectly correlated. As we can see from table 3, a substantial reduction of log likelihood results from imposing constraints either in model 5 or model 6. So model 4 is the preferred specification for the double-bounded case.
The coefficients in model 4 have the same sign and significance as those in the single-bounded models. The coefficient for lnbid is negative and statistically significant at the 1 per cent level. The coefficient of household income is positive and statistically significant at the 1 per cent level. The coefficient on awareness is positive and statistically significant at the 1 per cent level. The remaining coefficients are not significant, including the level of pollution. These qualitative results confirm earlier studies (Cai and Zheng, Reference Cai and Zheng2007).
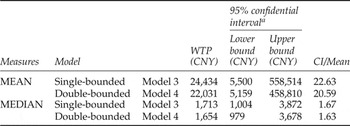
Table 4 presents the mean and median WTP and corresponding Krinsky and Robb confidence intervals. With the exponential function, the mean WTP far exceeds the median WTP because the lognormal distribution is skewed. The unconstrained double-bounded values are similar to the single-bounded results with a mean WTP of about CNY 22,000–24,000 and a median value of about CNY 1,700. The double-bounded model has a relatively small efficiency improvement compared to the single-bounded model. This is expected in bivariate probit models (Alberini, Reference Alberini1995).
Mean and median WTP

aThese are Krinsky and Robb (95%) confidence interval.
The WTP values are significantly positive in every regression. The lower bound for the mean WTP exceeds CNY 5,000 in every regression. However, the 95 per cent confidence interval is highly skewed to the right. The upper bound for the mean is around CNY 500,000.
4. Conclusion
The aim of this study is to estimate the WTP for air quality of Beijing residents. The study relies on a natural experiment in Beijing that occurred as a result of the Summer Olympic Games of 2008. During the summer of 2008, China went to extraordinary lengths to reduce emissions of regional air pollution near Beijing. As a result, residents experienced a dramatic change in air quality during that summer. This study explores what people would pay to maintain the level of air quality experienced during the Olympic Games. It takes advantage of this natural experiment to explore an experienced change in air quality. This CVM study consequently avoids the hypothetical nature of previous CVM studies in China.
We apply both single-bounded and double-bounded regression analysis to a small CVM survey of residents in the summer after the Olympic Games. The study measures what Beijing residents would pay per year to maintain the air quality experienced during the Games. The results of this analysis indicate that the median annual WTP of Beijing residents is around CNY 1,700 per household. The mean annual WTP lies between CNY 22,000 and 24,000 per household. Previous CVM studies in Beijing asking about similar air quality improvements found mean WTP values of only CNY 650 (Cai and Zheng, Reference Cai and Zheng2007) and CNY 143 (Wang et al., Reference Wang, Zhang, Li, Yang and Bai2006). We suspect that the values in this study are so much higher because the air quality improvement is not hypothetical but rather both feasible and prominent in the respondents’ minds. The study suggests that Chinese citizens place a much higher value on clean air than was previously thought.
Of course, improving air quality permanently is expensive. Before the government of China launches a costly campaign to reduce sulfur dioxide, nitrogen oxide and particulate emissions, they may want to confirm the results of this study. For example, they could conduct additional experiments by dramatically but temporarily reducing emissions in other Chinese cities. They could then conduct more thorough valuation surveys that both ask more detailed questions and interview much larger samples.
Another controversial but empirically important policy question is whether to use the median reported values or the mean of the distribution. The median is closer to the concept of a democratic vote for a policy as it represents the values of the median person in the population. The mean, in contrast, is more consistent with cost benefit analysis as it captures the values of the full distribution of the population. In this analysis, the distribution of values was found to be lognormal which means that the distribution is skewed and the mean of the distribution is well above the median.
Appendix: Survey
District: ( ) Community: ( ) Date: ( ) Survey no: ( )
The three following conditions have to be satisfied by any interviewee before further interviews.
1. Are you resident in this community?
a. Yes (go on)
2. Were you in Beijing in the summers of 2007 and 2008?
a. Yes
3. Are you older than 18?
a. Yes
Introductory questions
4. What changes can you remember about Beijing during the Olympic Games?
a. More sport facilities
b. Less traffic
c. International atmosphere
d. More volunteers, people become more polite and friendly
e. Cleaner air
f. The city is greener, cleaner and more beautiful
g. Stricter city management, so the city is more orderly.
h. Other_________
5. Were you aware of the air quality improvement during the Olympic Games?
a. Yes
b. No
Willingness-to-pay
6. As you know, during the Olympic Games, there were many temporary measures to reduce air pollution emissions such as restricting the use of automobiles and shutting down huge industrial polluters. After the Olympic Games, these temporary efforts stopped and the air quality fell again. If the government kept air quality permanently at the level it was during the Olympic games, and it cost CNY ( ) each year in higher taxes to your household, would you vote for this program? (Note that a household is defined here as all family members that are living together right now.)
Amounts used for bids are:
a. CNY 20 ( )
i. (If Yes) CNY 50 ( )
ii. (If No) CNY 10 ( )
b. CNY 50 ( )
iii. (If Yes) CNY 100 ( )
iv. (If No) CNY 20 ( )
c. CNY 100 ( )
v. (If Yes) CNY 250 ( )
vi. (If No) CNY 50 ( )
d. CNY 250 ( )
vii. (If Yes) CNY 500 ( )
viii. (If No) CNY 100 ( )
e. CNY 500 ( )
ix. (If Yes) CNY 1,000 ( )
x. (If No) CNY 250 ( )
f. CNY 1000 ( )
xi. (If Yes) CNY 2,000 ( )
xii. (If No) CNY 500 ( )
7. (If the answer of two above questions are no) If the tax is really low, CNY 1 per year, would you vote for this plan?
a. Yes
b. No
8. Why would you not vote for the plan
a. Cannot afford it because of low income
b. Do not like to pay taxes, which are compulsory
c. Do not believe the tax will be used on cleaning the air
d. I need to see the detailed plan to make a decision
e. It is the government's responsibility
f. Polluters, such as factories and car owners, should pay for it
g. Air quality is good, no need to pay
h. Other ( )
Socioeconomic characteristics
9. Age:
a. 18–25
b. 26–30
c. 31–35
d. 36–40
e. 41–45
f. 46–50
g. 51–55
h. 56–60
i. >60
10. Are you married?
a. Yes
b. No
11. Education level
a. Middle school or below
b. High school
c. Technical school
d. Junior college
e. College
f. Graduate school
g. Above graduate school
12. Do you pay rent to live here or own your own house?
a. Own
The area is ( ); unit price was ( ) CNY/m2
b. Rent
Rent is ( ) CNY/month
13. Household size?
a. 1
b. 2
c. 3
d. 4
e. ________ (other)
14. How many people in the household are employed?
a. 1
b. 2
c. 3
d. 4
e. ________ (other)
How many of them are retired?
a. 1
b. 2
c. 3
d. ________ (other)
15. Does your family have cars? How many?
a. 0
b. 1
c. 2
d. 3
e. 4
Type: _______
16. What is your family's income per month (CNY)?
a. Below 2,000
b. 2,000–5,000
c. 5,000–8,000
d. 8,000–11,000
e. 11,000–14,000
f. 14,000–18,000
g. 18,000–22,000
h. 22,000–26,000
i. 26,000–30,000
j. Above 30,000
17. What is your own income per month (CNY)?
a. 0
b. Below 2,000
c. 2,000–5,000
d. 5,000–8,000
e. 8,000–11,000
f. 11,000–14,000
g. 14,000–18,000
h. 18,000–22,000
i. 22,000–26,000
j. 26,000–30,000
k. Above 30,000
18. Your telephone number is ( )
Filled by enumerators
19. The sex of the interviewee:
a. Male
b. Female
20. Does the interviewee understand today's questionnaire?
a. Yes
b. No