


1. Introduction
In large silicic plutons, coeval yet diverse granitoid rocks (e.g. granites, granodiorites, syeno-granites, monzogranites, diorite, monzonites) are formed at different depths and/or have different fractionation histories, thus providing a wealth of information about the emplacement mechanisms and differentiation processes of crustal magma reservoirs (e.g. Barnes et al. Reference Barnes, Frost, Nordgulen and Prestvik2012; Edmonds and Woods Reference Edmonds and Woods2018). Magmatic enclaves (MEs) are common and important components in large granitoids (e.g. Wiebe et al. Reference Wiebe, Smith, Sturm, King and Seckler1997; Barbarin, Reference Barbarin2005; Ventura et al. Reference Ventura, Piero Del Gaudio and Iezzi2006; Clemens et al. Reference Clemens, Stevens and Elburg2017; Ruprecht et al. Reference Ruprecht, Simon and Fiege2020; Lei et al. Reference Lei, Brzozowski, Feng, Zhang, Muhtar, Luo and Wu2021; Gómez-Frutos and Castro, Reference Gómez-Frutos and Castro2023), which help in understanding magma reservoir processes.
The MEs are generally of diverse shapes and sizes, and commonly darker in colour compared to their host granitoid, which helps in their recognition in the field. The MEs may exhibit a large variability in bulk SiO2 (45–75 wt. %) and are seldom truly mafic in composition. They may be linked to a mantle/deep crustal origin, the imprints of which may not be readily recognized in their granitoid host (Clemens et al. Reference Clemens, Stevens and Elburg2017). It is still debated whether the MEs represent earlier rock fragments (xenoliths), or cumulates (and residues in the granitoid sources, i.e. restites), or contemporaneous magma(s) to the host granitoid, integral to the same tectono-magmatic system. In Archaean terrains, TTG gneisses and granitoid gneisses contain enclaves of mafic to intermediate bulk compositions, which are generally believed to be crustal protolith and/or remnants (restite) of the source from which they may have been formed by partial melting at different conditions (e.g. Wang et al. Reference Wang, Guo, Qian and Fu2018; Jayananda et al. Reference Jayananda, Gireshi, Sekhamo Kowete-u and Miyazaki2014; Rollinson et al. Reference Rollinson, Chagondah and Hofmann2024).
The Bundelkhand granitoid (BG), a large silicic to intermediate system, comprises diverse petrographic varieties that include syeno-and monzogranite, granodiorites, diorites, alkali feldspar syenites and granite porphyries and are geochemically diverse (e.g. Basu et al. Reference Basu2007 and references therein; Kaur et al. Reference Kaur, Zeh, Chaudhri and Eliyas2016; Sensarma et al. Reference Sensarma, Matin, Paul, Madhesiya and Sarkar2021; Singh et al. Reference Singh, Kumar, Sahoo, Joshi, Kumar, Paul, Oliveira, Singh, Gond, Kispotta and Rahi2025). Study of MEs in the BG is, however, sparse. The published work has suggested a common process of near-contemporaneous crust-and mantle-derived magma interactions into the origin of MEs (e.g. Sensarma et al. Reference Sensarma, Matin, Paul, Madhesiya and Sarkar2021; Ramiz et al. Reference Ramiz, Ahmad, Mondal and Rahaman2022 and references therein); the latter work reported mafic MEs (called E-1, E-2, and E-3 types based on compositional variations) only, whereas the former indicates MEs of both mafic (SiO2 ∼45–50 wt. %) and intermediate compositions (∼55–66 wt. %) in BG are possible.
In a fluid-fluxed transcrustal BG (Sensarma et al. Reference Sensarma, Matin, Paul, Madhesiya and Sarkar2021; also see section 2.b. below), however, middle-to lower-crust participation and interactions with mantle-derived mafic magma are expected, and that too in a H2O-present environment, which would likely give rise to MEs of diverse compositions as well, something not adequately explored yet. MEs in the BG may therefore provide crucial information on the nature of H2O-present crust-mantle environment, including their interactions, further clarifying the evolution of host granitoids.
We present new field evidence, petrography and microstructures, and major and trace element compositions to identify intermediate to felsic (e.g. mafic chanockite, TTG, felsic granulite) and mafic (basalt/basaltic andesite/picro-basalt) MEs, hitherto not known, in the BG. Our objectives are to unravel: (1) whether the MEs were derived from a single parent magma and/or represent different magma(s), (2) the role of aqueous fluid in ME origin, and (3) the transcrustal crust-mantle processes. We hypothesize that underplated/ponded basalt/picro-basalt plausibly sourced from an Archaean hydrated Ocean Island Basalt (OIB)-enriched MORB (E-MORB) as mantle variably interacted with deep crust to form diverse felsic to intermediate magmas, including TTGs in a fluid-fluxed tectono-magmatic system irrespective of tectonic setting.
2. Geological background
2.a. Regional geologic setting
The Bundelkhand Craton, comprising the principal litho-units (i) Tonalite-Trondjemite-Granodiorite (TTG) gneisses with enclaves of supracrustal rocks, (ii) Bundelkhand granitoid, the dominant exposed lithology, (iii) quartz reef and (iv) mafic (norite/dolerite/gabbro) dykes, with occasional keratophyres/lamprophyres (see in Basu, Reference Basu2007 and references therein; Singh et al. Reference Singh, Kumar, Sahoo, Joshi, Kumar, Paul, Oliveira, Singh, Gond, Kispotta and Rahi2025) are exposed over >26,000 km2 in northcentral India (Figure 1). The granitoid is punctuated by shear fracture system in three prominent orientations (i.e. EW-, NE-and NW-trending), occasionally with a subordinate N-S trending one (e.g. Sarkar et al. Reference Sarkar, Matin and Sensarma2017; Singh and Bhattacharya, Reference Singh and Bhattacharya2017). The E-W trending ∼300–500m wide and upto ∼200 km long Bundelkhand tectonic zone (Figure 1) is considered a Neoarchaean subduction-related suture zone (e.g. Pati, 2020 and references therein); others suggest the zone to have developed starting from magmatic to submagmatic granitoid crystallization to the stabilization of the craton (e.g. Basu, Reference Basu2007; Sarkar et al. Reference Sarkar, Matin and Sensarma2017; Sensarma et al. Reference Sensarma, Matin, Paul, Patra, Madhesiya and Sarkar2018). We have not encountered such large-scale shear system in the northern and southern part of the craton. No evidence of regional metamorphism and tectonic deformation (e.g. foliation, schistosity) is recognized in the MEs and their host granitoid. Broadband seismic imaging indicates a 38 km thick crust below Jhansi (25°26′31.2″ N: 78°34′28.7″; Rai and Ramesh, Reference Rai and Ramesh2012; see Figure 1). Low crustal P-wave velocity (6.5 to 6.7 km/s) and high Bouguer gravity values suggest the presence of mafic intrusive bodies at shallower depths (23–25 km; Rao et al. Reference Rao, Reddy, Rao, Rao and Rao1998). Details on the geology of the craton are given in Basu (Reference Basu2007 and references therein), Pati (Reference Pati2020) and Kumar et al. (Reference Kumar, Gupta, Sensarma and Bhutani2020).
Geological map of the Bundelkhand craton. Small circles on the map show the magmatic enclave sample locations.

Figure 1. Long description
Geological map of the Bundelkhand craton. Small circles on the map show the magmatic enclaves sample locations.
2.b. Host granitoid and age constraints
The host granitoid is of felsic to intermediate compositions comprising feldspar (K-feldspar and plagioclase) + quartz + biotite + amphibole ± sphene ± magmatic epidote ± apatite ± ilmenite ± magnetite ± zircon ± monazite, which include syeno-and monzogranite, granodiorites, diorites, alkali feldspar syenites and granite porphyries. Primary mafic minerals and intracrystalline deformation-free feldspars are aligned along 10–190° and 116–296° directions defining primary submagmatic fabric, which eventually evolved into mylonitic foliation in the ductile regime; brittle shear zones/planes (cataclastic granitoid) then developed, with occasional pseudotachylite veins/films (Deb et al. Reference Deb, Bhattacharyya, Matin and Sensarma2015; Sarkar et al. Reference Sarkar, Matin and Sensarma2017). The syn-crystallization deformation started early and continued through the transcrustal (9–2 kbar) granitoid mush ascent and perhaps even continued post-crystallization (Sensarma et al. Reference Sensarma, Matin, Paul, Madhesiya and Sarkar2021). The granitoid crystallization (liquidus >900°C) may have continued across the magmatic-hydrothermal (∼≥900°C to <600°C) conditions.
The thin dark green Fe-Mg-Na-K-rich veins (<100 µm), occurring along shear planes, grain boundaries and fractures in BG, are ubiquitous, which are interpreted as representing exsolved high temperature (∼950°C) aqueous fluid activity with silicate dissolved in it, plausibly linked to mantle-derived intrusive dyke swarms (norite/dolerite/gabbroic) emplaced within BG (Sensarma et al. Reference Sensarma, Matin, Paul, Patra, Madhesiya and Sarkar2018). The high field strength elements (HFSE) ratios (e.g. Sm/Nd, La/Sm, Nb/Th, La/Nb and Zr/Y) and experimental melts compositions sourced at deep crust (e.g. quartz-amphibolites and biotite gneiss: Patiño Douce and Beard, Reference Patiño Douce and Beard1995), the intrusive mafic dykes, MEs and dark green veins (Fe-Mg-Na-K-rich aqueous fluid) plot along the same trends on multiple plots, indicating a petrogenetic linkage among them (see Fig. 12 in Sensarma et al. Reference Sensarma, Matin, Paul, Madhesiya and Sarkar2021, and references therein).
The basement TTG gneisses yielded the Hf model ages at c.3.8 and c.3.95 Ga, and the vertically extensive BG (U-Pb single zircon method) is dated at c. 2700 Ma and the younger 2358 ± 46 Ma (Mondal et al. Reference Mondal, Goswami, Deomurari and Sharma2002; Kaur et al. Reference Kaur, Zeh and Chaudhri2014, Reference Kaur, Zeh, Chaudhri and Eliyas2016 and references therein). Magmatic zircons with characteristic zoning visible in CL and high Th/U >0.5 occur in GQVs. Using the207Pb/206Pb method, the core of the single magmatic zircons in GQVs is dated at 2.68, 2.56 and 2.45 Ga (Slabunov and Singh, Reference Slabunov and Singh2022) and is interpreted as representing the ages of xenocrystic zircon. Hydrothermal zircons (Th/U<0.5) having corroded margins yielded overlapping age (∼2.56 Ga core: ∼1.87–1.78 Ga rim: Slabunov and Singh, Reference Slabunov and Singh2022); the latter interpreted to representing GQVs’ final emplacement age. BG having initial 176Hf/177Hf: 0.28093 ± 0.00003 (sample no. 2BK-28) with upper intercept age of 2358 ± 46 Ma, and 207Pb/206Pb ages 2161 ± 66 Ma and 2134 ± 19 Ma in two other granitoid domains (initial 176Hf/177Hf: 0.28111 and 0.28115, respectively: Kaur et al. Reference Kaur, Zeh, Chaudhri and Eliyas2016) broadly overlap to that of the Giant Quartz Veins (GQVs). The single zircon U-Pb, whole-rock 40Ar/39Ar, and palaeomagnetic dates indicate that mafic dykes (>2557 ± 23–1931 ± 31 Ma: Rao et al. Reference Rao, Rao, Widdowson and Kelley2005; Pradhan et al. Reference Pradhan, Meert, Pandit, Kamenov and Mondal2012; Kaur et al. Reference Kaur, Zeh, Chaudhri and Eliyas2016; Saha et al. Reference Saha, Frei, Gerdes, Pati, Sarkar, Patole, Bhandari and Nasipuri2016; Radhakrishna et al. Reference Radhakrishna, Tomson, Chandra and Ramakrishna2020), MEs (2551–2187 Ma: see Sarkar and Miller, Reference Sarkar and Miller1996; Kumar et al. Reference Kumar, Gupta, Sensarma and Bhutani2020), granitoid (2583 ± 11–2328 ± 35 Ma), and quartz reef (1866 ± 11–1779 ± 43 Ma) are broadly synchronous over ≥300 Ma (see Figure 2 in Sensarma et al. Reference Sensarma, Matin, Paul, Madhesiya and Sarkar2021 for details), in accord as being part of the same tectono-magmatic system. It is thus possible that the MEs capture snapshots of the underplated mafic bodies and crust-mantle processes at different crustal depths.
2.c. Sampling
For this study, we collected ME samples hosted in the granitoid in the central sector around Bijoli, Rosoi and Ghisoli areas, and south of Talbehat near the so-called Bundelkhand Tectonic Zone (BTZ) in the west-central sector of the craton (Figure 1). We have chosen the areas for sampling because host granitoid is exposed closer to the Tectonic Zone, which is a major crustal-scale shear system, and conducive for magma transfer through the crust, and are likely to host MEs from diverse sources at different depths. No such large-scale shear system is encountered in the far northern and southern parts of the craton (see Section 2a), which may have hindered the incorporation of MEs at different levels into the host granitoid (see section 2.a).
3. Materials and methods
Samples for geochemical analyses were taken from the central part of the enclaves in order to minimize the effects of crustal contamination. We prepared 20 thin sections of the ME samples for petrography/microstructure study under a polarizing microscope (LEICA model number 750) at the Department of Geology, University of Lucknow. New major and trace element analyses of 14 and 15 ME samples, respectively, were done using the wavelength dispersive X-ray fluorescence (WD-XRF, Rigaku ZSX Primus II) and inductively coupled plasma mass spectrometer (ICP-MS, Thermo Fisher Scientific iCAP Q) facilities at the Indian Institute of Technology (IIT) Kanpur. Major oxides and selected trace element concentrations were determined (WD-XRF) using calibration curves obtained from regressions of about 20 international rock standards (details in Chandra et al. Reference Chandra, Paul, Viladkar, Sensarma, Sensarma and Storey2018). The reproducibility of the rock standards Basalt (BE-N), Granite (AC-E) and Andesite (AGV-2) is given in Supplementary Table S1. Trace element (ICP-MS) analyses were done using 50 mg of sample dissolved in a mixture of HF (2.5 ml) + HNO3 (0.5 ml)+HCl (1 ml) in pre-cleaned PFA Savillex vials following the protocol of Halder et al. (Reference Halder, Paul and Stracke2023). The reproducibilities of the rock standards AGV-2 and BCR-2 are given in the Supplementary Table S2. The accuracy of the major and trace elements (ICP-MS) is ≤3% and ≤10%, respectively.
4. Results
4.a. Field observations
MEs are dark grey/black in colour and vary both in size and shape, ranging from 2 cm to as large as 100s of cms, and angular to rounded/subrounded in shape (Figure 2). Because of similar colour and overall hypidiomorphic granular texture, it is difficult to identify different ME types in the field. In the field, MEs occur in different orientations, mostly trending between 120–300° and 140–320°. The size-frequency distribution plot shows smaller size (1–35 cm) MEs to be dominant, and those ∼50 cm are less common (Supplementary Figure S1).
(a) Magmatic enclaves (MEs) of different sizes and shapes in host granitoid near Bijoli area. Note that the larger the size, the better the roundness in MEs; however, angular enclaves occasionally have subrounded corners. (b) Well-rounded ME in host grey granitoid; closer look shows ME margin locally irregular though (marked arrow). Isolated patchy to diffuse light-coloured material throughout the ME. (c) Sinisterly sheared large subrounded to sub-angular dark grey ME in host granitoid (Gr); immediately along the ME margin coarse-grained textures developed in Gr (marked white arrow), which gradually diffuse outside into fine bands of heterogeneous granitic and enclave material (marked yellow arrow), parallel to a discernible fine fabric in host granitoid along which the long dimension of ME is oriented. Gr veins into the ME. A brittle fracture cut across both the ME and the host granitoid. (d) Large subrounded to sub-angular dark grey ME in host granitoid (Gr) tended to align along a dominant fabric in grey Gr (marked by a yellow dotted line). A light-coloured, coarser-grained granitic vein (Gr vein) cuts across both Gr and ME, including their common fabric (marked by a yellow dotted line). A well-developed brittle fracture (middle of the photo) cuts across the ME, host granitoid, and light-coloured granitoid (Gr) vein. (e) Inside a darker grey ME. The ME and intruded granitic vein (Gr vein) were affected by sinistral-sensed shear fracture; tapering of the intruded granitic vein (Gr vein), having curved margins near the shear fracture, signifies coeval deformation. In the left off-centre of the photo, fault affected both ME and thin felsic veins. (f) Pinkish grey granitic irregular patches in angular ME, similar to the host granitoid. Left margin of ME is irregularly curved; near the margin host granitoid is finer-grained and gradually becomes coarser away from the ME margin. (g) Large rounded ME; a fabric in the host granitoid follows the ME margin in right. Trace of two intersecting surfaces is discernible both in ME and the host granitoid. (h) Elongated darker grey/black ME stretched along the mylonitic foliation in host granitoid; mylonitic foliation parallel to a crude foliation in ME.

Figure 2. Long description
(a) Magmatic enclaves (MEs) of different sizes and shapes in host granitoid near Bijoli area. Note that the larger the size, the better the roundness in MEs; however, angular enclaves occasionally have subrounded corners. (b) Well-rounded ME in host grey granitoid; closer look shows ME margin locally irregular though (marked arrow). Isolated patchy to diffuse light-colored material throughout the ME. (c) Sinisterly sheared large sub-rounded to sub-angular dark grey ME in host granitoid (Gr); immediately along the ME margin coarse-grained textures developed in Gr (marked white arrow), which gradually diffuse outside into fine bands of heterogeneous granitic and enclave material (marked yellow arrow), parallel to a discernible fine fabric in host granitoid along which the long dimension of ME is oriented. Gr veins into the ME. A brittle fracture cut across both the ME and the host granitoid. (d) Large sub-rounded to sub-angular dark grey ME in host granitoid (Gr) tended to align along a dominant fabric in grey Gr (marked by a yellow dotted line). A light-coloured, coarser-grained granitic vein (Gr vein) cuts across both Gr and ME, including their common fabric (marked by a yellow dotted line). A well-developed brittle fracture (middle of the photo) cuts across the ME, host granitoid, and light-coloured granitoid (Gr) vein. (e) Inside a darker grey ME. The ME and intruded granitic vein (Gr vein) were affected by sinistral-sensed shear fracture; tapering of the intruded granitic vein (Gr vein), having curved margins near the shear fracture, signifies coeval deformation. In the left off-centre of the photo, fault affected both ME and thin felsic veins. (f) Pinkish grey granitic irregular patches in angular ME, similar to the host granitoid. Left margin of ME is irregularly curved; near the margin host granitoid is finer-grained and gradually becomes coarser away from the ME margin. (g) Large rounded ME; a fabric in the host granitoid follows the ME margin in right. Trace of two intersecting surfaces is discernible both in ME and the host granitoid. (h) Elongated darker grey/black ME stretched along the mylonitic foliation in host granitoid; mylonitic foliation parallel to a crude foliation in ME.
Although MEs apparently show sharp contacts with host granitoid, a closer look reveals many of them have 1–10 mm thick coarser-grained diffusive contacts with their immediate host (Figure 2a, c, f, g). This suggests a variable degree of interaction of MEs and their immediate granitoid. Deformation structures in the MEs include fractures, joints, micro-faults, shearing and shear fractures (Figure 2e, h). Evidence of rotation and stretching of enclaves (Figure 2c, g, h) is present. Stretched dark coloured enclaves with lobate undulating boundary show preferred orientation parallel to the broadly E-W trending mylonitic foliation in the host granitoid (Figure 2d, h). Several relatively younger granite veins of different thickness are cutting across the MEs (Figure2a, d, e). Shear fractures along the micro-faults are seen (Figure 2e, h). A fine fabric, both within enclaves and host granitoid (95–275°) are observed (Figure 2h).
4.b. Mineralogy, petrography and microstructure
The granitoid enclaves (hereafter called felsic MEs) are the dominant MEs, and in general comprise variable proportions of feldspar (K-feldspar and plagioclase) + amphibole + biotite + quartz ± magmatic epidote ± sphene ± apatite ± ilmenite ± zircon; plagioclase dominant over alkali feldspar. Mafic MEs comprising plagioclase + pyroxene (including orthopyroxene) + amphibole + biotite + opaque oxides are also present. On an IUGS diagram, the felsic MEs plot mostly as granodiorite; monzodiorite, quartz monzodiorite, monzogranite and diorite are also present (Figure 3). When compared, the MEs (Sensarma et al. Reference Sensarma, Matin, Paul, Madhesiya and Sarkar2021; this work) and those from the other parts of BG (Ramiz et al. Reference Ramiz, Ahmad, Mondal and Rahaman2022) are overall plagioclase-rich (≥65%) at similar quartz proportions (∼25%); the latter mostly tonalite to diorite (Figure 3).
IUGS classification plot shows granodiorite, monzogranite, and quartz monzodiorite ± monzodiorite are the dominant felsic MEs (this work); more mafic (e.g. tonalite/gabbro) MEs (Ramiz et al. Reference Ramiz, Ahmad, Mondal and Rahaman2022) also exist in host granitoid.

Figure 3. Long description
IUGS classification plot shows granodiorite, monzogranite, and quartz monzodiorite ± monzodiorite are the dominant felsic MEs (this work); more mafic (e.g., tonalite/gabbro) MEs (Ramiz et al., 2022) also exist in host granitoid.
Granodiorite MEs having well-formed euhedral to subhedral pyroxenes, including occasional orthopyroxene and feldspars (orthopyroxene granitoids, s.l., Le Maitre Reference LeMaitre2002) are identified as magmatic chanockite in this study (Figure 4a, b). Although there is some confusion about the terminology of charnockites because of their nearly the whole range of granite compositions (e.g. Newton Reference Newton1992; Frost and Frost, Reference Frost and Frost2008; also see Touret and Huizenga, Reference Touret and Huizenga2012), we retain this well-entrenched nomenclature for these samples having textural and compositional similarities to the published magmatic charnockites (see below). The MEs show overall hypidiomorphic texture, in which subhedral alkali feldspars with Carlsbad twinning occasionally developed into cross-hatched twinned microcline (Figure 4a). Occasionally, perthitic feldspar shows curved boundaries due to impingement (top-centre in Figure 4a). K-feldspar and plagioclase show irregular boundaries on which finer felsic aggregates (sometimes look myrmekitic) precipitated (Figure 4a). The twin lamellae in large plagioclase are bent and occasionally micro-faulted (not shown). Feldspars, bluish-green amphiboles and tabular biotite tend to align in a preferred direction (dominantly trending 110°: Figure 4c). Small brown strongly pleochroic worm-like/wispy biotites follow feldspar and quartz boundaries (Figure 4d).
Magmatic charnockite enclave: (a, b) comprises larger subhedral K-feldspar (K-feld) including microcline (Mc) + perthite (per) + plagioclase (Pl) + quartz (qtz) + orthopyroxene (Opx) + biotite (Bt) forming hypidiomorphic texture; finer myrmekitic-look aggregates occur on k-feld surface (centre of photo A; both photos of same scale). (c) Intra-crystalline deformation-free feldspars, amphibole and light yellow to brown biotite align in a direction define submagmatic fabric; amphibole showing sieve textures, and (d) Deformation-free dark brown biotite whips follow feldspars’ margins in an interconnected channel-like fashion (both photos in same scale). TTG enclave: (e) Well-developed interlocking Pl + qtz + Bt form hypidiomorphic texture; bent twin lamellae in Pl; ‘recrystallized-look’ smaller-grain aggregates develop along feldspar boundaries. (f, g) Intra-crystalline deformation-free brown to dark brown biotite forming channel-like network and ‘recrystallized-look’ finer aggregates (under cross-nicol) along feldspar boundaries near contact with host (granitoid both photos in same scale). (h) Included euhedral magmatic epidote in zoned alkali feldspar aligns in a direction defining the submagmatic fabric. (i) In felsic granulite enclave, amoeboid-shaped strongly undulose quartz in association with chlorite-like (but not chlorite) aggregates. (j) Fine-grained basalt enclave (Pl + Opx + Bt + opaque oxides) showing a primary fabric, and (k) intersecting slender micro-laths of green to light green amphibole/chloritized pyroxene and plagioclase; enclave contains quartzo-feldspathic (felsic) xenolith. Photos J and K in same scale.

Figure 4. Long description
Magmatic charnockite enclave: (A, B) comprises larger subhedral k-feldspar (k-feld) including microcline (Mc) + perthite (per) + plagioclase (Pl) + quartz (qtz) + orthopyroxene (Opx) + biotite (Bt) forming hypidiomorphic texture; finer myrmekitic-look aggregates occur on k-feld surface (centre of photo A; both photos of same scale). (C) Intra-crystalline deformation-free feldspars, amphibole, and light yellow to brown biotite align in a direction define sub-magmatic fabric; amphibole showing sieve textures, and (D) Deformation-free dark brown biotite whips follow feldspars’ margins in an interconnected channel-like fashion (both photos in same scale). TTG enclave: (E) Well-developed interlocking Pl + qtz + Bt form hypidiomorphic texture; bent twin lamellae in Pl; ‘recrystallized-look’ smaller grains aggregates develop along feldspars boundaries. (F, G) Intra-crystalline deformation-free brown to dark brown biotite forming channel-like network and ‘recrystallized-look’ finer aggregates (under cross-nicol) along feldspar boundaries near contact with host granitoid both photos in same scale). (H) Included euhedral magmatic epidote in zoned alkali feldspar aligns in a direction defining the submagmatic fabric. (I) In felsic granulite enclave, amoeboid-shaped strongly undulose quartz in association with chlorite-like (but not chlorite) aggregates. (J) Fine-grained basalt enclave (Pl + Opx + Bt + opaque oxides) showing a primary fabric, and (K) Intersecting slender micro-laths of green to light green amphibole/chloritized pyroxene and plagioclase; enclave contains quartzo-feldspathic (felsic) xenolith. Photos J and K in same scale.
TTG enclaves have plagioclase + quartz + amphibole + biotite as principal minerals. Bending of twin lamellae in plagioclase is observed (Figure 4e). Intra-crystalline deformation-free wispy brown strongly pleochroic biotite follows the feldspar boundaries in a channel-like network, similar to magmatic chanockite MEs, with concomitant grain size reduction (‘recrystallized-look’ smaller grains) of felsic minerals in TTG MEs, in contrast to the host coarse granitoid (Figure 4f, g). Euhedral magmatic epidotes (≤2 mm) occur completely or partially enclosed by amphibole (not shown) and feldspar (Figure 4h), occasionally showing preferred alignment too.
Felsic granulite MEs look recrystallized with strongly undulose amoeboid-shaped polycrystalline quartz aggregate (Figure 4i). Well-developed euhedral magmatic epidote-bearing veins are present, often in association with fine mafic clots (chlorite-like, but not chlorite; see also Sensarma et al. Reference Sensarma, Matin, Paul, Patra, Madhesiya and Sarkar2018, for similar chlorite-like material in host granitoid) and veins (not shown). Magmatic epidote and euhedral/subhedral apatite and sphene (<0.5–1 mm) occur as included phases within tabular amphibole and plagioclase, respectively.
Mafic MEs are norite/noritic gabbro, comprising plagioclase + orthopryoxne + clinopyroxene + biotite + opaque oxides; pyroxenes altered to actinoloite ± secondary epidote (Figure 4j). Xenocrystic quartz/granitoid xenoliths are present occasionally (Figure 4k). The mafic MEs have an overall intergranular texture, yet intercrystalline deformation-free plagioclase and pyroxenes are aligned, defining a primary fabric (Figure 4j).
Overall textural and microstructural evidence in both felsic and mafic MEs thus indicates their igneous origin. The petrogenic link among synplutonic mafic dikes, MEs and mafic veins (fluid) (see section 2.b.; also see Sensarma et al. Reference Sensarma, Matin, Paul, Patra, Madhesiya and Sarkar2018, Reference Sensarma, Matin, Paul, Madhesiya and Sarkar2021) further attests to an igneous origin for the enclaves.
4.c. Whole-rock geochemistry
4.c.1. Evaluation of post-crystallizationalteration
Values of LOI, appropriate indicators of surface alteration, are low (∼ ≤2 wt. %) for the analysed samples (Table 1), suggesting little post-magmatic alteration. Thin-section studies of the samples do not indicate any significant alteration. The mobile lithophile elements and their ratios (e.g. Rb, Rb/Sr) vs. LOI values plot do not show positive relations either (not shown). Strong positive relations between K2O wt. % vs Ba (ppm) (Figure 5b), and the mobile Ba and immobile Nb ratios (Ba/Nb 6–67) in MEs (Table 2) are either approximately similar to bulk crust (Ba/Nb 57: Rudnick and Gao, Reference Rudnick, Gao, Holland and Turekian2014), or the lower end not far from that of primitive mantle (Ba/Nb 11: Palme and O’Neill, Reference Palme, O’Neill and Andrew2014), suggesting no preferred mobilization of Ba compared to Nb. The primitive mantle (PM)-normalized multielements and REE plots (Figure 6) are regular and consistent with magmatic processes, implying major and trace element compositions in MEs reflect original characteristics, i.e. suggestive of igneous processes.
Major element (wt. %) composition of magmatic enclaves (MEs)

Table 1. Long description
Major oxides (12) compositions of mafic enclaves (MEs) and their selected ratios.
BD: below detection limit.
(a) SiO2 wt. % vs. Na2O/K2O plot for MEs showing Na-rich character of MEs, except for two magmatic charnockite samples (sample numbers 26-2-2 and S3), (b) K2O wt. % vs. Ba (ppm) plot showing strong positive correlation among MEs. (c) Al2O3/TiO2 vs. CaO/TiO2 plot for MEs showing a cluster, except for felsic granulite ME. The average compositions of continental flood basalt (CFB; McGrail et al. Reference McGrail, Schaef, Ho, Chien, Dooley and Davidson2006), mid-ocean ridge basalt (MORB; Gale et al. Reference Gale, Dalton, Langmuir, Su and Schilling2013), primitive mantle (PM; Palme and O’Neill, Reference Palme, O’Neill and Andrew2014), and average TTG (Moyen and Martin, Reference Moyen and Martin2012) are plotted for comparison. (d) SiO2 wt. % vs. Ta/Th plot MEs showing variable Ta/Th values for given range of SiO2 concentrations; higher Ta/Th (∼1) in TTG compared to mafic charnockite enclaves (≤0.1) at similar SiO2 content (∼65 wt. %); Ta/Th in felsic granulite little above mafic charnockite enclaves, and mafic enclaves Ta/Th (<0.01) still lesser.

Figure 5. Long description
(a) SiO2 wt. % vs. Na2O / K2O plot for MEs showing Na-rich character of MEs, except for two magmatic charnockite samples (sample numbers 26-2-2 and S3), (b) K2O wt. % vs. Ba (ppm) plot showing strong positive correlation among MEs. (c) Al2O3/TiO2 vs. CaO/TiO2 plot for MEs showing a cluster, except for felsic granulite ME. The average compositions of continental flood basalt (CFB; McGrail et al., 2006), mid-ocean ridge basalt (MORB; Gale et al., 2013), primitive mantle (PM; Palme and O’Neill, 2014), and average TTG (Moyen and Martin, 2012) are plotted for comparison. (d) SiO2 wt. % vs. Ta/Th plot MEs showing variable Ta/Th values for given range of SiO2 concentrations; higher Ta/Th (∼ 1) in TTG compared to mafic charnockite enclaves (≤0.1) at similar SiO2 content (∼65 wt. %); Ta/Th in felsic granulite little above mafic charnockite enclaves, and mafic enclaves Ta/Th (<0.01) still lesser.
Trace element (ppm) composition of magmatic enclaves (MEs)

Table 2. Long description
Trace element (33) compositions of magmatic enclaves (MEs) and their selected ratios.
Primitive mantle (PM)-normalized incompatible trace elements and C1-chondrite Rare Earth Elements (REE) plots for magmatic enclaves (MEs). (a, b) magmatic chanockite MEs, (c, d) TTG MEs, (e, f) felsic granulite MEs and (g, h) mafic MEs. PM and C1-chondrite values from Palme and O’Neill (Reference Palme, O’Neill and Andrew2014). Composition of magmatic enclaves (Ramiz et al. Reference Ramiz, Ahmad, Mondal and Rahaman2022, in lemon green) plotted for comparison.

Figure 6. Long description
Primitive mantle (PM)-normalized incompatible trace elements and C1-chondrite Rare Earth Elements (REE) plots for magmatic enclaves (MEs). (a, b) magmatic chanockite MEs, (c, d) TTG MEs, (e, f) felsic granulite MEs and (g, h) mafic MEs. PM and C1-chondrite values from Palme and O’Neill (2014). Composition of magmatic enclaves (Ramiz et al., 2022, in lemon green) plotted for comparison.
4.c.2. Major oxide composition
The whole-rock major oxide composition of MEs are presented in Table 1. The felsic MEs are of felsic to intermediate in composition (61–68 wt. % SiO2, ≤2 wt. % MgO), with the exceptions of two high-silica samples (SiO2 ≥ 70 wt. %; samples 26-2-S-1 and 26-2-2). Sensarma et al. (Reference Sensarma, Matin, Paul, Madhesiya and Sarkar2021) reported intermediate (∼55–64 wt. % SiO2, ≤4.59 wt. % MgO) and mafic/ultramafic MEs (∼45 wt. % SiO2, >9 wt. % MgO; hereafter considered as mafic MEs) in the same host granitoid. The mafic MEs are basalt/basaltic andesite to picro-basalt.
Overall, the MEs are sub-alkaline (total alkali ≤8 wt. %), yet some samples have characteristically Na2O/K2O > 1 (Figure 5a). Also, the highest Si-bearing sample (SiO2 78 wt. %: felsic granulite ME) has extremely low total alkali (0.46 wt. %: Table 1), usually not characteristic of a common high Si-rich rock. On the AFM plot (Figure 7a), felsic MEs plot mostly along a calc-alkaline trend, whereas mafic MEs show a tholeiitic character, similar to those of Ramiz et al. (Reference Ramiz, Ahmad, Mondal and Rahaman2022). On a Fe-number (FeOT/FeOT + MgO) vs. SiO2 wt. % plot (Figure 7b), the TTG enclaves straddle the ferroan-magnesian boundary, with the other felsic MEs maintaining similar Fe2O3 values irrespective of MgO content. Also, mafic charnockite (sample 4-3-S-6) and felsic granulite MEs (sample 26-2-S-1) having very dissimilar SiO2 values (64 wt. % and 78 wt. %) do have similar Fe2O3 values (5.50 wt. % and 5.65 wt. %, respectively) (Figure 7b). On a SiO2 vs. MALI plot (Figure 7c), the MEs are calc-alkaline to alkali-calcic and belong to the high-K calc-alkaline series (Figure 7e). They are metaluminous and/or straddle about the metaluminous-peraluminous boundary; the latter mostly TTG and mafic MEs (Figure 7d; Ramiz et al. Reference Ramiz, Ahmad, Mondal and Rahaman2022). Overall, the Al2O3 content in MEs is similar to slightly lower (14–15 wt. %) compared to the calc-alkaline basalts/basaltic andesites (∼16 wt. %: Philpotts and Ague, Reference Philpotts and Ague2009), except felsic granulite ME (sample 26-2-S-1: SiO2 78 wt. %), which yields as low as 7 wt. % Al2O3, indicating other felsic MEs are comparatively more Al-rich.
(a) The AFM plot of mafic enclaves showing tholeiitic composition, whereas the felsic enclave shows a calc-alkaline trend. (b) On a SiO2 wt. % vs Fe-number (FeOT/(FeOT+MgO) (wt. %), most MEs straddle about the Magnesian-Ferroan line, though some more MgO-rich MEs do occur. (c) On a SiO2 wt. % vs MALI (Modified alkali-lime index) plot showing mainly calc-alkaline to alkali-calcic character for MEs. (d) On an Alumina Saturation Index (ASI) vs. Alkalinity Index (Al) plot showing metaluminous character for MEs, TTG, and some mafic enclaves straddle the metaluminous-peraluminous boundary. (e) SiO2 wt. % vs. K2O wt. % plot showing MMEs mostly belong to calc-alkaline to high-K calc-alkaline series. Solid symbols: this work, open symbols: Ramiz et al. (Reference Ramiz, Ahmad, Mondal and Rahaman2022).

Figure 7. Long description
(a) The AFM plot of mafic enclaves showing tholeiitic composition, whereas the felsic enclave shows a calc-alkaline trend. (b) On a SiO2 wt. % vs Fe-number (FeOT/(FeOT+MgO) (wt. %), most MEs straddle about the Magnesian-Ferroan line, though some more MgO-rich MEs do occur. (c) On a SiO2 wt. % vs MALI (Modified alkali-lime index) plot showing mainly calc-alkaline to alkali-calcic character for MEs. (d) On an Alumina Saturation Index (ASI) vs. Alkalinity Index (Al) plot showing metaluminous character for MEs, TTG, and some mafic enclaves straddle the metaluminous-peraluminous boundary. (e) SiO2 wt. % vs. K2O wt. % plot showing MMEs mostly belong to calc-alkaline to high–K calc-alkaline series. Solid symbols: this work, open symbols: Ramiz et al. (2022).
4.c.3. Trace elements composition
The trace element composition of MEs is presented in Table 2. The felsic MEs generally have low Cr (∼ ≤50 ppm) and V (<100 ppm) values, and the mafic MEs (samples 27-2-S-4 and 4-3-S-5) expectedly have higher Cr (150 ppm) and V (>150 ppm) concentrations than bulk crust (Cr: 135 ppm, V: 138 ppm: Rudnick and Gao, Reference Rudnick, Gao, Holland and Turekian2014), consistent with basaltic to basaltic andesite major element compositions of the latter.
On K2O wt. % vs. Ba (ppm) and SiO2 wt. % vs. Ta/Th plots (Figure 5b, d), samples are positively correlated and plot about bulk crust (Ta/Th 0.13) to mantle values (picrite Ta/Th: ∼1) with TTG MEs (Ta/Th ∼ 1, similar to mantle value), indicating their linkage as being part of the same system. Overall Rb/Sr in some felsic MEs (e.g. magmatic chanockite) and mafic enclaves are similar or slightly higher (0.23–0.89) than that of the upper/middle crust (0.23–0.26). However, the TTG MEs have simultaneously higher Rb (≤227 ppm vs. 80 ppm) and lower Sr (<237 ppm) and low Sr/Y (≤ 15.4) than those in typical adakite (average Sr >400 ppm, Sr/Y >55) and sanukitoid (SiO2<62 wt. %, Sr ∼1100 ppm, Sr/Y ∼64: Martin et al. Reference Martin, Smithies, Rapp, Moyen and Champion2005), and the upper continental crust (Sr <320 ppm), resulting in significantly high Rb/Sr (up to 1.33). In felsic granulite and a few mafic charnockite MEs (samples 26-2-S-1, 4-3-S-3), on the other hand, Sr (>1000 ppm) and Rb (<30 ppm) are significantly high and very low, respectively (Rb/Sr 0.001 and 0.10). Overall, felsic granulite ME yields higher Sr/Y (>330 ppm), whereas other felsic MEs have characteristically low Sr/Y (5.14 to 19.5), thus ranging within mantle (5.0) to crustal values (16) in general, and of petrogenetic significance.
Primitive mantle (PM: Palme and O’Neill, Reference Palme, O’Neill and Andrew2014) and chondrite-normalized (Palme and O’Neill, Reference Palme, O’Neill and Andrew2014) trace element patterns for the respective MEs are distinct and characteristically different from each other, as shown in Figure 6. While the mafic charnockite MEs have high incompatible trace element concentrations with Ba-, Nb-Ta, Sr-, Ti-negative anomalies and LREE/HREE (>>10 times: Figure 6a,b), the TTG MEs have comparatively lower incompatible trace element concentrations than the former, but with a characteristic LREE-enriched fractionated pattern with negative HREE and no resolvable Eu-anomaly (Figure 6c,d). The felsic granulite ME yields still lower concentrations of trace elements, but a convex middle REE pattern with positive Eu-anomaly. The REE patterns of mafic MEs are rather flatter, about 10 times chondritic, although the sample having quartzo-feldspathic (crustal) xenoliths (sample 27-2-S-4) expectedly show LREE enrichment. When compared with mafic MEs (E1, E2 and E3 types) of Ramiz et al. (Reference Ramiz, Ahmad, Mondal and Rahaman2022), mafic chanockite MEs may have some overall similarities to their E2-type, TTG enclaves to E3-type, and mafic MEs to E1-type, respectively. The salient geochemical characteristics of MEs studied are presented in Table 3.
Salient geochemical characteristics and P-T estimates of magmatic enclaves (MEs)

Table 3. Long description
Salient geochemical characteristics and pressure(P)-Temperature (T) estimates of magmatic enclaves (MEs).
4.d. Thermobarometry
4.d.1. Temperature estimates
Using the bulk rock Zr concentrations (mostly 130–150 ppm), the calculated Zr-saturation temperature for felsic MEs is estimated at 760°C, with a maximum temperature up to 800°C. However, the assumption that the bulk rock Zr compositions represent melt composition (i.e. T Zr ∝ ZrMELT) may not hold true because Zrbulk-rock could be of different origins (e.g. liquidus phase, or inherited crystals or antecrysts). We use the empirical equation TSiO2 (°C) = –14.16 × SiO2 + 1723, a simple thermometer based on experimentally determined phase equilibria with T∝1/SiO2 (Duan et al. Reference Duan, Niu, Sun, Chen, Kong, Li, Zhang, Hu and Shao2022), which is also particularly suitable for granitoid magmas.
The results of thermometry for different felsic MEs are shown in Table 3. Taking highest SiO2-bearing mafic charnockite sample (sample 26-2-2: SiO2 70.1 wt. %), we obtain a temperature of ∼730°C; the lowest SiO2-bearing sample (sample 26-2-4: SiO2 61.3 wt. %) obviously yields a higher crystallization temeperature (855°C). TTG MEs (SiO2:∼63 wt. %) yield ∼817°C, with the highest SiO2-bearing one (sample 27-2-S-1: SiO2 64.3 wt. %) likely crystallized at a slightly lower temperature (813°C). Felsic granulite ME, however, may have formed at a considerably lower temperature, at about 616°C.
For mafic MEs, given the MgO content 6.94 wt. % (sample 27-2-S-4), and using the equation (T°C = 1026e0.01894 MgO wt. %) of Niu (Reference Niu2005) suitable for magmas of basaltic compositions, the liquidus is estimated at 1170°C. Using the same equation, we obtain the estimated liquidus for the mafic enclave SS1 (MgO: 9.65 wt. %) at ∼1217°C.
4.d.2. Pressure estimates
The felsic MEs have normative An up to 21.5 wt. %. Because of hydrous conditions (see sections 5a,6) and the effect of An component, the silica solubility may increase with decreasing pressure, moving the minimum towards the Qtz-Or join in the Qtz-Ab-Or system (Blundy and Cashman, Reference Blundy and Cashman2008; Wilke et al. Reference Wilke, Holtz, Neave and Almeev2017; Pichavant et al. Reference Pichavant, Weber and Villaros2019). The felsic MEs contain >60 wt. % SiO₂ and ≤0.76% normative corundum, making them suitable for pressure estimates using the Qtz–Ab–Or–H₂O system, which is not applicable to liquids with >1% normative corundum (Blundy and Cashman, Reference Blundy and Cashman2008). We plot the CIPW normative mineralogy for the felsic MEs in the modified Qtz-Ab-Or-An-H2O system (after Wilke et al. Reference Wilke, Holtz, Neave and Almeev2017), which show some scatter (Figure 9). Yet, the normative plots reveal some interesting patterns: (i) felsic MEs plot from the ternary minimum at or near 10 kbar (albite-rich composition) to that of 1.5 kbar (or 0.15 GPa), (ii) mafic charnockite and TTG MEs plot mostly within ∼3–10 kbar and ∼5–10 kbar eutectic, respectively, (iii) felsic granulite ME, and one mafic charnockite ME sample plot more towards the Qtz-apex along the Qtz-Ab line (low pressure), and along the cotectic curves of 1.5 kbar (∼4–5 kbar), respectively, and (iv) the SiO2 content increases (63 wt. % in mafic chanockite and TTG to 78 wt. % in felsic granulite ME) with decreasing pressure (Figure 9).
(a) On a Fe2O3 wt. % vs. TiO2 wt. % plot, TTG and mafic MEs show almost similar TiO2 values (∼1 wt. %) irrespective of Fe2O3 concentrations; lower TiO2 values in magmatic charnockites (∼0.5 wt. %) and felsic granulite enclaves (<0.1 wt. %), respectively. (b) On a K2O wt. % vs. Rb (ppm) plot felsic MEs showing Rb concentration in a restricted range (100–200 ppm) with a large variation in K2O content (∼1.6–5 wt. %); mafic enclaves yield low Rb and K2O values, and felsic enclave practically lacks both K and Rb. (c) On a Zr/Hf vs. Nb/Ta plot, MEs show systematic differences in Nb/Ta and Zr/Hf ratios in MEs, with a strong positive correlation among them. Note MEs (except felsic granulite enclave) generally have superchondritic Zr/Hf (≥35; chondrite 34–36: see text) and subchondritic Nb/Ta (chondrite Nb/Ta 19.9 ± 0.7: see text); several samples plot about UCC and LCC compositions (UCC: upper continental crust, MCC: middle continental crust, LCC: lower continental crust; Rudnick and Gao, Reference Rudnick, Gao, Holland and Turekian2014). (d) On a Zr/Hf vs. Nb/Y plot, felsic MEs (except felsic granulite and mafic enclaves) plot about UCC and LCC compositions.

Figure 8. Long description
(a) On a Fe2O3 wt. % vs. TiO2 wt. % plot, TTG and mafic MEs show almost similar TiO2 values (∼1 wt. %) irrespective of Fe2O3 concentrations; lower TiO2 values in magmatic charnockites (∼0.5 wt. %) and felsic granulite enclaves (<0.1 wt. %) respectively. (b) On a K2O wt. % vs. Rb (ppm) plot felsic MEs showing Rb concentration in a restricted range (100–200 ppm) with a large variation in K2O content (∼1.6–5 wt. %); mafic enclaves yield low Rb and K2O values, and felsic enclave practically lacks both K and Rb. (c) On a Zr/Hf vs. Nb/Ta plot, MEs show systematic differences in Nb/Ta and Zr/Hf ratios in MEs, with a strong positive correlation among them. Note MEs (except felsic granulite enclave) generally have superchondritic Zr/Hf (≥ 35; chondrite 34–36: see text) and sub-chondritic Nb/Ta (chondrite Nb/Ta 19.9 ±0.7: see text); several samples plot about UCC and LCC compositions (UCC: upper continental crust, MCC: middle continental crust, LCC: lower continental crust; Rudnick and Gao, 2014). (d) On a Zr/Hf vs. Nb/Y plot, felsic MEs (except felsic granulite and mafic enclaves) plot about UCC and LCC compositions.
5. Discussion
5.a. Syn-crystallization deformation in MEs and host granitoid
Overall hypidiomorphic textures, including Carlsbad-twinned subhedral feldspars, perthite with impinged boundaries and fine myrmekitic textures (melt phase), suggest a magmatic origin for mafic chanockite MEs. The alignment of intracrystalline deformation-free subhedral feldspars, amphiboles and biotite in a preferred direction, without any cross-cutting relationship in granodiorite/mafic charnockite, TTG and mafic MEs, as well as in their host granitoid, define a common primary submagmatic fabric (Figures 2, 4a, i), i.e. indicating igneous crystallization for MEs. The stretching of enclaves parallel to the primary submagmatic fabric (e.g. mafic charnockite ME) and the similarly oriented submagmatic foliation in host granitoid (Figure 2h; see also Sarkar et al. Reference Sarkar, Matin and Sensarma2017) plausibly suggest that the MEs got included during or just before the primary submagmatic fabric was evolving into a mylonitic foliation in host granitoid and were in variably molten states. Evidence of swerving fabric around the MEs and/or rotating shape with undulating boundary in MEs (Figure 2g,h) further confirms MEs’ incorporation into pre-to syn-ductile deformed crystallizing granitoid, i.e. they were coeval and subjected to a common stress regime. The general absence of chilled margins, but development of a reaction front/diffusive margins on the MEs boundaries (Figure 2), also means that the thermal quenching/exchanges occurred during the inclusion of these magmas in their present host. The mylonitic foliation within the crystallizing Bundelkhand granitoid may have developed at least ∼25 km depth (Sensarma et al. Reference Sensarma, Matin, Paul, Patra, Madhesiya and Sarkar2018, Reference Sensarma, Matin, Paul, Madhesiya and Sarkar2021). This implies that the MEs under study got incorporated in the granitoid mush at a deeper part of the crust in the ductile regime, i.e. largely mid-deep to deep crustal depths as part of the same tectono-magmatic regime.
We interpret the channel-like network of an array of biotites (monomineralic phase) in magmatic charnockites and TTG MEs (Figure 4d, f) as ‘fossil’ melt films, along which hydrous melt/fluid moved (cf. Sawyer, Reference Sawyer2001) during or after the other mineral phases have already been crystallized. The ‘recrystallized-look’ smaller grains along large plagioclase and quartz (deformation-free) margins, conspicuous in TTG MEs (Figure 4e), which otherwise lack evidence of metamorphism and tectonic deformation, thus suggest magmatic aqueous fluid-mediated sub-solidus equilibration responsible for smaller grain formation during late-stage crystallization in the deep crust.
In felsic granulite ME, however, strongly undulose amoeboid-shaped polycrystalline quartz aggregates may have developed through grain-boundary migration (GBM) and/or subgrain-rotation recrystallization, indicating deformation at ∼600°C, comparable to the calculated crystallization temperature (616°C), thus consistent with a syn-crystallization deformation regime.
5.b. Are MEs cumulates or restites?
Cumulates are defined as those rocks that formed from the accumulation of minerals due to gravity settling, in which grain boundaries touch each other, and boundaries are filled with overgrowths and interstitial mineral aggregates (Irvine Reference Irvine1982; Collins et al. Reference Collins, Murphy, Johnson and Huang2020). According to Vernon and Collins (Reference Vernon and Collins2011), the definition of cumulates is ‘igneous rocks that reflect relative concentration of crystals and/or loss of melt and therefore did not represent the whole-rock composition of their melt composition’.
The MEs in this study do not show such textures of cumulates, and some of them are more mafic (SiO2 < 66 wt. %; two samples have very high SiO2 ≤ 78 wt. %) than their host granitoid (SiO2∼70–72 wt. %: Sensarma et al. Reference Sensarma, Matin, Paul, Madhesiya and Sarkar2021 and references therein). If the host granitoid was ‘residual liquid’ of a large pool of mafic to intermediate magma of basaltic/basaltic andesite composition, then enclaves under study would have to achieve an ultramafic (SiO2 ≤ 45 wt. %) to mafic compositions (SiO2∼50 wt. %). The same may also apply if the MEs are restitic in origin and represent residues, and the granitoid the partial melt (i.e. host granitoid). However, the felsic MEs are felsic to intermediate in composition and thus rule out these possibility. Enclaves have significantly more silica than the host granitoid with regular, distinctive REE patterns indicating their non-cumulus nature. The presence of primary submagmatic fabric in MEs also suggests that they were molten (plastic state), implying they are direct crystallization of magma(s), and not cumulates and/or restites.
5.c. Fractionation of a single mafic parent magma?
Low abundances of mantle compatible elements, e.g. Ni (≤90 ppm), Co (≤41 ppm), Cr (≤78 ppm) and Sc (≤26 ppm), compared to basalt/andesitic basalt (mafic MEs), may appear consistent with evolved characters of felsic MEs. The positive relation between Sc and V in MEs (not shown) may apparently argue for crystal fractionation (e.g. pyroxene) of a mafic magma. However, similar TiO2 values for a given range of Fe2O3 rule out mafic oxides fractionation of a single mafic magma for the MEs (Figure 8a).
Quartz (Qtz) – Albite (Ab) – Orthoclase (Or)–H2O plot (after Wilke et al. Reference Wilke, Holtz, Neave and Almeev2017) for CIPW normative mineralogy of felsic MEs. Ternary projection of cotectic curves and minimum points at various pressures and normative melt An contents shown in solid and dashed lines, respectively. Magmatic charnockite and TTG MEs plot at about the ternary minimum at 3–10 kbar; quartz-rich (SiO2: 78 wt. %) felsic granulite plots towards Qtz-rich apex, indicating equilibration at shallower depth.

Figure 9. Long description
Quartz (Qtz) – Albite (Ab) – Orthoclase (Or)–H2O plot (after Wilke et al., 2017) for CIPW normative mineralogy of felsic MEs. Ternary projection of cotectic curves and minimum points at various pressures and normative melt An contents shown in solid and dashed lines, respectively. Magmatic charnockite and TTG MEs plot at about the ternary minimum at 3–10 kbar; quartz-rich (SiO2: 78 wt. %) felsic granulite plots towards Qtz-rich apex, indicating equilibration at shallower depth.
During fractional crystallization of mafic minerals (e.g. olivine, pyroxene) from a mafic parental magma, similarly incompatible elements would maintain their ratios in the residual magma (e.g. Wilson, Reference Wilson1989; Sensarma and Palme, Reference Sensarma and Palme2013) unlike in felsic MEs (e.g. Rb/Sr, Zr/Y, Ta/Th: see Table 2). Scatter on K2O vs TiO2 (not shown) and K2O vs. Rb plots (Figure 8b) rule out biotite fractionation. No plagioclase fractionation is indicated, as Al2O3 and Sr values are not correlated to CaO contents. Experimental melts produced by fractional crystallization at relevant crustal pressures (up to ∼10 kbar) are typically peraluminous (e.g. Nandedkar et al. Reference Nandedkar, Ulmer and Müntener2014; Blatter et al. Reference Blatter, Sisson and Hankins2013), unlike the metaluminous felsic MEs in this study (Figure7d).
5.d. Crust-mantle interactions
On the Al2O3/TiO2 vs. CaO/TiO2 (Figure 5c) and immobile HFSE ratios plots (e.g. Zr/Hf vs. Nb/Ta, Zr/Y vs Nb/Y: Figure 8 (c, d)), MEs (except for felsic granulite ME) plot close to those of crust (bulk crust: Al2O3/TiO2 22.08, CaO/TiO2 8.90) and mantle values (PM: Al2O3/TiO2 21.38, CaO/TiO2 17.38). This indicates plausible crust–mantle interaction while the MEs were in molten states (i.e. involving crustal and mantle-derived magmas interactions), mostly in a H₂O-rich environment (see later). Also, granodiorite/mafic chanockite, TTG, felsic granulite MEs and mafic enclaves have distinct incompatible elements and REE patterns of themselves (Figure 6). We interpret the distinct geochemical characteristics and REE patterns in MEs as representing individual magmas, which may have experienced variable degrees of mingling and mixing between felsic and mafic magmas. This brings out a powerful constraint that diverse magmas likely coexisted in the same chamber/reservoir of the craton-scale Bundelkhand granitoid.
5.e. Sources and emplacement of felsic ME magmas
Immobile element ratio plots are particularly useful for assessing the petrogenesis and source characteristics of magmatic rocks and are easier to interpret when ratios share a common denominator (e.g. Wilson, Reference Wilson1989; Dupuy et al. Reference Dupuy, Liotard and Dostal1992; Condie, Reference Condie1999; Dostal and Chatterjee, Reference Dostal and Chatterjee2000; Sensarma et al. Reference Sensarma, Palme and Mukhopadhyay2002; Halder et al. Reference Halder, Paul and Stracke2023). The Nb/Yb vs. Th/Yb and Nb/Yb vs. TiO2/Yb plots are used as reliable proxies for highlighting crustal contributions in oceanic basalts and their melting depths, respectively (Pearce, Reference Pearce2008); indeed, the former is more sensitive to crust-mantle interactions. Th and Nb are so chosen because both remain immobile in rock-weathering to amphibolite facies metamorphism and also behave similarly during most petrogenetic processes. We utilize this approach for understanding the role of crust and mantle sources in the origin of both felsic and mafic MEs, as discussed below.
5.e.1. Magmatic chanockite MEs
The MEs are diorite to granodiorite, sometimes sodic (Na2O/K2O>1: Figure 5a), have high concentrations of Ba (Ba ≤1268 ppm; Figure 5b), LREE (∼126–547 ppm, with ΣLREE/ΣHREE ≤12), but low Sr/Y (6.6–19), compositionally similar to Precambrian magmatic charnockites in Antarctica (Reinbolt charnockite: Na2O/K2O 0.47–1.96, Ba < 1750 ppm, ΣLREE ∼150–400 ppm, ΣLREE/ΣHREE 7–10, low Sr/Y ≤12: Mikhalsky and Kamenev, Reference Mikhalsky and Kamenev2013).
Trace element concentrations in these MEs are similar to two times higher than those of the host granitoid, especially in HFSEs. So assimilation of host granitoid is unlikely to have significantly affected the trace element concentrations in the samples. Nor are these MEs related to a parent basaltic magma by fractional crystallization (see section 5.c.).
In Figure 10 (a,b), the higher Th/Nb and lower TiO₂/Yb at crustal Nb/Yb ratios indicate dominant deep crustal melt contributions; the Nb/Yb values close to E-MORB also suggest an additional mantle-derived mafic magma component. The Zr/Sm (20–44) and Lu/Hf (0.05–0.08) in these MEs are similar to crustal values (bulk crust: Zr/Sm ∼34, Lu/Hf 0.08: Rudnick and Gao, Reference Rudnick, Gao, Holland and Turekian2014), but Lu/Hf increases up to 0.13 (same as lower crust) in two samples (sample no. 4-3-S-6, 4-3-S-3), indicating possible involvement of more mafic crustal component. Indeed, the La/Nb (≥1.6) and low Ni (<14 ppm) in the MEs suggest the presence of an underplated mafic magma of basaltic composition (cf. Condie, Reference Condie1999), plausibly representing mafic MEs. This suggests lower crustal partial melt-basalt interactions. Combined trace element characteristics, including a steeper LREE/HREE, and results of dehydration melting experiment of amphibolites, thus may indicate the presence of amphibole (with/without pyroxene ± garnet) in the source (cf. Kar et al. Reference Kar, Bhattacharya and Sheraton2003; Patiño Douce and Beard, Reference Patiño Douce and Beard1995), i.e. middle-to lower-crustal sources. The negative Sr and Eu anomalies in the MEs may indicate the presence of plagioclase in the middle-to lower-crustal sources too.
(a) Nb/Yb vs Th/Yb plot (after Pearce Reference Pearce2008), highlighting crustal contributions in MEs. Oceanic basalts plot within the MORB–OIB array (shaded). Lower crust-derived magmas (mafic charnockite, felsic granulite) plot above the MORB–OIB array. TTG MEs plot within the E-MORB-OIB segment of the array, whereas mafic MEs plot on either side of the mafic charnockite MEs. (b) Nb/Yb vs TiO2/Yb proxy for source melting. While the TTG MEs plot along a trend connecting E-MORB-OIB with increasing deep crustal input, mantle-derived mafic MEs, mafic chanockite and felsic granulite MEs plot at or immediately below the MORB array (lower part), indicating varying crustal interactions.

Figure 10. Long description
(a) Nb/Yb vs Th/Yb plot (after Pearce 2008), highlighting crustal contributions in MEs. Oceanic basalts plot within the MORB–OIB array (shaded). Lower crust–derived magmas (mafic charnockite, felsic granulite) plot above the MORB–OIB array. TTG MEs plot within the EMORB–OIB segment of the array, whereas mafic MEs plot on either side of the mafic charnockite MEs. (b) Nb/Yb vs TiO2/Yb proxy for source melting. While the TTG MEs plot along a trend connecting E–MORB–OIB with increasing deep crustal input, mantle-derived mafic MEs, mafic chanockite and felsic granulite MEs plot at or immediately below the MORB–array (lower part), indicating varying crustal interactions.
Magmatic charnockite in a water-free condition would form at a much higher pressure >25 kbar (>75–80 km: Zharikov and Khodorevskaya, Reference Zharikov and Khodorevskaya2006), which looks unrealistic in the Bundelkhand setting. Higher Ba/Nb (≤67.1) in some MEs rather signifies the role of aqueous fluid in the Archaean deep crustal source, at significantly lower pressures. Indeed, the networks of biotites along felsic grain boundaries (‘fossil’ melt films: Figure 4d, h) indicate channels along which hydrous melt/fluid moved (cf. Sawyer, Reference Sawyer2001). Higher Ba, Zr and K may point to derivation under elevated PCO2, too, as shown in experiments (Kaszuba and Wendlandt, Reference Kaszuba and Wendlandt2000).
Although the origin of charnockite is generally attributed to charnockite-type magma (i.e. C-type magma: Kilpatrick and Ellis, Reference Kilpatrick and Ellis1992), deep crustal melting (Young et al. Reference Young, Zhao, Ellis and McCulloch1997) or derivation partly from mantle (Sheraton et al. Reference Sheraton, Black and Tindle1992), we suggest that these MEs originated primarily through partial melting of the lower to lower-middle crust, with additional mantle input in the form of hydrous basaltic magma. Hydrous basalt underplating (mafic MEs) likely contributed heat and/or fluid flux to deep crust to trigger partial melting, in accord to the estimated pressures (up to 10 kbar) and temperatures (730°C–850°C) for the MEs (Table 3, Figure 9). The ascending mafic charnockite progressively crystallized and equilibrated at shallower depths (∼3 kbar), locally reaching complete crystallization at ∼1.5 kbar, corresponding to a depth of approximately 4–5 km. The relatively high Th contents (Figure 10a) may further indicate contributions from the middle to upper crust during reworking, likely associated with polybaric ascent.
5.e.2. TTG-type magma
TTG MEs compositions including their characteristic sodic nature (Na2O/K2O > 1.74), high Zr/Sm (30–76) and low Lu/Hf (0.03–0.05) at given silica concentrations (∼63–64 wt. %) are comparable to that in the Bundelkhand average TTG (aver. Na2O/K2O 1.45, Zr/Sm 28–78, Lu/Hf 0.03–0.14: Ram Mohan et al. Reference Ram Mohan, Singh, Santosh, Siddiqui and Balaram2012) and the average Archaean TTGs (Zr/Sm: 44.3; Lu/Hf: 0.03: Moyen and Martin, Reference Moyen and Martin2012).
The TTG enclaves (except one sample) have moderate to moderately high fractionated REE patterns (La/Yb > 15: Figure 6d) and low Sr/Y (≤15), unlike the TTG having the highest La/Yb (>100) and Sr/Y (>100) related by amphibole fractionation and/or plagioclase accumulation (cf. Laurent et al. Reference Laurent, Guitreau, Bruand and Moyen2024). Absence of negative Eu-anomaly (Figure 6c,d) precludes plagioclase fractionation. Similar Dy/Yb (between 2 and 3) in TTG MEs having higher La/Yb further suggest no relative fractionation between LREE and HREE, and among HREE. No garnet fractionation is possibly indicated as it would lower Y and Yb concentrations significantly, resulting in higher Sr/Y and La/Yb in the samples. So the TTG MEs compositions, such as negative Nb-Ta and positive K and Pb, including similar or slightly lower ratios of two refractory elements, Al2O3/TiO2 (17.64–22.20: Figure 5c; see also Table 1) to that of bulk crust (Al2O3/TiO2∼22: Rudnick and Gao, Reference Rudnick, Gao, Holland and Turekian2014), indicate a crustal source.
The depletion of HREEs and HFSEs in TTG is inferred to increasing depths of melting, as HREEs are preferentially incorporated in residual garnet and HFSEs in residual amphibole and/or rutile. Given low Mg# and Sr/Y (≤15), low HFSE including Nb/Ta (<18) but high Zr/Hf (≤50) and Zr/Sm (>30) in the TTG MEs relative to primitive mantle (Nb/Ta: 17.8, Zr/Hf ∼33 and Zr/Sm 25.9, respectively, McDonough and Sun, Reference McDonough and Sun1995), may suggest its formation mainly controlled by residual amphibole. During partial melting, residual plagioclase at this pressure retained Sr, resulting in low Sr/Y values. Indeed, low silica (60–64 wt. %) TTG MEs could form at ∼12–15 kbar (∼38–45 km), co-existing with garnet-poor residual assemblages (cf. Moyen et al. Reference Moyen, Stevens and Kisters2006), comparable with our pressure estimates (5–10 kbar: Figure 9), and consistent with a ≤38 km crust below the Bundelkhand craton (see section 2). Ta/Th (∼1) in the MEs (Figure 5d), on the other hand, suggests a possible mantle contribution (picrite Ta/Th ∼1) into their origin too.
We obtain a temperature of ∼813°C–817°C for TTG MEs. Generation of TTG through amphibole breakdown only would require temperature at least 850°C–900°C, higher than the calculated values. Combined with given geochemical attributes, the low-T constraints indicate that the TTG MEs likely formed at a relatively lower temperature but at deep crust/crust-mantle transition (∼7–10 kbar: Figure 9), a condition that calls for a fluid-fluxed partial melting of underplated basalts (cf. Winberg and Hasalovά, Reference Weinberg and Hasalová2015; Laurent et al. Reference Laurent, Guitreau, Bruand and Moyen2024) represented by the mafic MEs. Indeed, the wispy strongly pleochroic biotite following the feldspar boundaries in a channel-like network in TTG MEs (Figure 4d, h) represents the ‘fossil’ fluid-fluxed melt films, which we attribute to have caused a smaller grain size (occasionally recrystallized-look) of felsic minerals along their boundaries in these MEs (Figure 4h).
5.e.3. Presence of felsic granulite
The felsic granulite ME, its lesser population perhaps a sampling artefact, is characteristically rich in SiO2 (78 wt. %), similar to granites and high-silica rhyolites, but with extremely low Al2O3 (7 wt. %) and significantly depleted total alkali (<1 wt. %) at given SiO2 values. However, this ME is Fe-bearing (Fe2O3 5.65 wt. %) and high FeO/MgO ∼14, and CaO (6.6 wt. %). Although low to extremely low Ni (<4 ppm), Cr (<1 ppm), Sc (<4 ppm), and Co (5 ppm) in the ME are consistent with its evolved character, poor concentrations of Rb (1.5 ppm) and Zr (≤7 ppm) at an extremely high Sr (>1000 ppm) indicate otherwise. Extremely low Th/U (0.03; Table 2) in the ME also indicates unusual enrichment of U. Although the sample has overall depleted trace element concentrations (<10 times chondritic) compared to an evolved very high-silica felsic rock (SiO2 78 wt. %), the sample is characteristically showing positive Sr-, Pb-and Eu-anomalies (Figure 6e).
The REE pattern is, however, more interesting (Figure 6f). The rock is significantly enriched, particularly in the MREE and HREE, with a positive Eu-anomaly. The REE distribution behaviour is more likely a result of mafic minerals, i.e. pyroxene and hornblende in the rock, because these two mafic minerals have MREE-enriched, concave-upward, REE patterns (Gromet and Silver, Reference Gromet and Silver1983). Positive Sr-and Eu-anomalies also indicate the presence of plagioclase in the ME. This type of mineralogical assemblage with extremely high Sr/Y (≥300 ppm) and low Ta/Th ∼0.1: Figure 5d) indicates the ME representing magma of mid-to lower-crustal derivation, comparable to felsic granulites of Sammon and McDonough (Reference Sammon Gand McDonough2021) and the exhumed Western Ghats felsic granulite (Rajamani et al. Reference Rajamani, Tripathi and Malviya2009). We therefore interpret that the mid to lower crustal felsic granulite, while crystallizing at depth, was incorporated into the granitoid mush and transported toward shallower crustal levels, as indicated by the Qtz-rich apex (Figure 9), during progressive magmatic ascent and reworking in this part of the continental terrains.
According to the Al-in-hornblende thermobarometric estimates for the low-temperature calc-alkaline plutons (≤800°C; predominantly 700°C–750°C), comparable to those of the felsic MEs (616°C–815°C), constrain their emplacement pressures to ∼2–9 kbar (cf. Auge, 1997). Our estimates are consistent with the adiabatic ascent of low-temperature (∼700°C–750°C), hydrous granitoid magmas through the crust (Holtz et al. Reference Holtz, Johannes, Tamic and Behrens2001).
5.e.4. Source of mafic MEs
The mafic MEs contain plagioclase, pyroxene and biotite as principal mafic minerals but lack olivine (Figure 4j,k). Evolved basaltic magma, which experienced fractionation and/or crustal contamination (sample 27-2-S-4 having crustal xenolith: Figure 4k), is not suitable for identifying source characteristics. So, more primitive samples with higher MgO and lower SiO2 concentrations (samples 4-3-S-5 and SS1) are considered for this purpose. On an Al2O3/TiO2 vs CaO/TiO2 plot, the primitive mafic enclaves show composition similar to mantle-derived basalts (Figure 5c), consistent with its high concentrations of Ni (>100 ppm), Cr (182 ppm), Co and Sc (∼40 ppm), and V (292 ppm), and simultaneously low Zr (68 ppm), Rb (35 ppm), and Sr (150 ppm). The mafic MEs have overall lower trace element compositions (<20 times primitive mantle composition), except for Ba, Th and Pb (Figure 6g). Absence of negative Nb-, Ta-, Sr-and Ti anomalies seems characteristic, unlike in arc basalts. The C1-chondrite REE pattern in the primitive sample (sample 4-3-S-5) is almost flat (Figure 6h), with a tendency to have slightly higher HREE concentrations over LREE (LREE/HREE <1), characteristic of N-MORB. Overall, the mantle source of mafic MEs (Archaean basalt), however, seems less depleted in these elements than the modern-day asthenosphere from which MORB are generated (cf. Bédard, Reference Bédard2018; Moyen and Laurent, Reference Moyen and Laurent2018). The higher Th, Rb and La concentrations in the samples also indicate their enriched source character.
Lower continental crust has a low Ta/Th (0.06) compared to the average crust (Ta/Th 0.13) and mantle-derived rocks (Ta/Th ∼ ≥1). Lower crustal contamination of the mantle-derived basalt/picro-basalt MEs (Ta/Th 0.01) is thus indicated (Figure 5d), while still maintaining basaltic major and compatible trace element compositions. This implies that the mantle-derived melts of basaltic/picro-basalt composition were incorporated into the granitoid, but did not interact as a whole or had a limited extent of interaction with felsic MEs. We interpret the mafic MEs as representing high-temperature mafic underplate (mafic recharge) in the deep crust.
As the high-temperature mantle-derived magma was emplaced within the lower crust (more mafic than upper and middle continental crust), the primitive basalts did not experience significant chemical changes, except for Al2O3 (>15 wt. % as compared to tholeiitic basalt <13 wt. %: Philpotts and Ague, Reference Philpotts and Ague2009), when limited melt-mush interactions possibly effected some Al-enrichment in the MEs (cf. Yang et al. Reference Yang, Wang, Liang and Lissenberg2019). Basalt/picro-basalt underplating/intrusion of the lower crust is common in large silicic systems, perhaps linked to extension and/or underlying elevated mantle temperatures.
6. Global and regional implications
6.a. Hydrous lithosphere
We show in this study that the lower crustal lithologies like mafic chanockite, felsic granulites, TTG, basalt/picro-basalt MEs got incorporated in molten states into the Bundelkhand granitoid mush at deeper crustal levels and finally emplaced during magmatic ascent and reworking. The felsic MEs represent low-temperature (≤800°C; predominantly ≤750°C), hydrous silicic magmas that underwent cooling and crystallization within long-lived magma chambers before being incorporated into the hotter host magma, represented by the bulk granitoid with a liquidus temperature >900°C. Comparing with the experimental results, it is suggested that large, ≥8 wt. % H2O-bearing hydrated silicic magma reservoirs existed in the mid-to lower-crust below Bundelkhand.
Our earlier studies on host granitoid presented microstructural evidence, including back-scattered electron (BSE) images and multiple X-ray compositional maps, highlighting the ubiquitous presence of an intricate network of mafic veins (≤10–12% by volume) within the granitoid, interpreted to be the high-temperature (≥900°C) Fe-Mg-Na-K-rich magmatic aqueous fluid activity exsolved from the mantle-derived basaltic magma (see Figs 4 and 5 in Sensarma et al. Reference Sensarma, Matin, Paul, Patra, Madhesiya and Sarkar2018). The exsolved aqueous fluid with silicate dissolved in it, manifested as mafic veins network in granitoid, yielded low SiO2 (23.78–29.24 wt. %), TiO2 (0.03–1.2 wt. %), MnO (0.7–1.13 wt. %), high FeO/MgO (5.61–9), and low (Na+K)/Al (0.01–0.23: peraluminous) and Mg/Si (0.17–0.31) (see Table 2 in Sensarma et al. Reference Sensarma, Matin, Paul, Patra, Madhesiya and Sarkar2018). We ascribed the mafic veins to be petrogenetically linked to the mantle-derived enriched basalt that finally emplaced polybarically as pan-craton intrusive mafic dykes (dolerite/gabbro/noritic gabbro). Integrating our earlier and present results, a significant finding in this study is the presence of magmatic H2O at about the lower crust and/or crust-mantle depths, which played a key role in the anatexis of the Bundelkhand deep crust.
Interestingly, we find that the mafic MEs (samples 27-2-S-4 and SS1) plot not far from the OIB–E-MORB array (Figure 10a). The sample with higher Nb/Yb appears to be relatively more alkaline. However, the similar Th/Yb ratios indicate only limited variation in the interaction between middle-to lower-crustal melts and oceanic basaltic melts. One mafic ME and several felsic granulite MEs exhibit Nb/Yb ratios comparable to those of N-MORB, but show elevated Th/Yb ratios, potentially reflecting increased crustal input, or low-degree partial melting, or a combination of both. In Figure 10b, the average continental crust plots near the centre of the MORB field, whereas felsic rocks lie below it (not shown). Thus, increasing crustal partial melt contributions to OIB magmas would shift them towards or into the MORB field. Mafic MEs show a closer affinity to E-MORB, occasionally N-MORB, with clear crustal input, similar to mafic charnockite MEs (Figure 10b). Interestingly, TTG MEs plot within the MORB-OIB array (Figure 10a), and also along a trend connecting E-MORB-OIB (Figure 10b). We interpret that, with increasing deep crustal input TTG MEs shift towards the E-MORB compositions.
It is found in experiments that high-MgO basalts and ultrahigh-MgO rocks (e.g. komatiite, picrite) may store up to twice to four times the amount of crystal-bound H2O than low MgO basalts, most of which is retained until temperatures exceeding 700°C (Hartnady et al. Reference Hartnadya, Johnson, Schorn, Smithies, Kirkland and Richardson2022). Consequently, it is conceivable that dehydration of buried hydrated high-MgO basalt and ultramafic rocks in the Archaean steeper geotherm would lead to hydration and/or fluid-fluxed melting within the lithospheric mantle to produce variably hydrous enriched basalts to picro-basalt (i.e. mafic MEs), that could eventually become the sources for low-temperature (≤800°C) TTG and felsic granulite magmas deep inside the Archaean Bundelkhand crust. Indeed, recent discovery of tonalite veins having higher zircon δ18O (∼6‰) as compared to their mafic (amphibolitic) source (∼2–3‰) highlights fluid-fluxed melting and interactions with a mantle-derived fluid during deep crustal anatexis (Volante et al. Reference Volante, Pourteau, Li, Collins, Doucet, Olierook, Martin and Smit2025). So the experimental results and petrological and geochemical constraints place a powerful alternative perspective that fluid-fluxed (free water) partial melting of hydrated enriched basalt/picro-basalt at about the lower crust-mantle transition, most likely related to plume-related oceanic plateaus independent of subduction (cf. Johnson et al. Reference Johnson, Brown, Gardiner, Kirkland and Smithies2017; Pourteau et al. Reference Pourteau, Doucet, Blereau, Volante, Johnson, Collins, Li and Champion2020), could be a plausible mechanism for the origin of TTG and other felsic MEs in the Bundelkhand craton (this work).
Although partial melting of subducted oceanic slabs in convergent plate margins akin to the modern-day Earth is generally invoked for TTG formation (e.g. Martin and Moyen Reference Martin and Moyen2002; Foley et al. Reference Foley, Tiepolo and Vannucci2002; Nagel et al. Reference Nagel, Hoffmann and Münker2012), they show no clear affinity with migmatitic mafic source rocks from several Archaean terranes (see Glikson Reference Glikson1979), including the Bundelkhand craton. Our present study thus reinforces and provides independent evidence and constraints that the transcrustal Bundelkhand granitoid not only exposes lower crustal lithologies but also records enriched mantle-derived fluid-fluxed anatexis of the deep crust.
6.b. Zr/Hf and Nb/Ta constraints for fluid-fluxed melting
Except for felsic granulite ME (Zr/Hf: <34), the felsic MEs have mostly superchondritic Zr/Hf (35–50 vs. chondritic value 34–36) and are positively correlated with Zr concentrations. Given similar Zr/Hf ratios (>34) in previously studied MEs from the same host granitoid (see Ramiz et al Reference Ramiz, Ahmad, Mondal and Rahaman2022; also see section 4.c.3), we infer that most zircon grains in the respective MEs retain their characteristic Zr/Hf values. So zircon, which contains the bulk of these two elements, did not modify the Zr/Hf ratio in MEs. Participation of enriched mantle-derived fluid commonly known to have higher Zr/Hf in intraplate OIB (>40: Dupuy et al. Reference Dupuy, Liotard and Dostal1992; 37.0–45.5: Pfänder et al. Reference Pfänder, Münker, Stracke and Mezger2007) is thus suggested for the origin of superchondritic Zr/Hf in TTG (Zr/Hf: 38.73–49.75) and enriched basalt/picro-basalts (mafic ME Zr/Hf: 40.69–42.52).
The Nb/Ta of MEs (mafic chanockite: 8.26–20.58; TTG: 15.08–18.23; felsic granulite 9.69, mafic enclaves: 16.22–17.92) is, however, opposite, i.e. subchondritic (chondritic Nb/Ta 19.9 ± 0.7: see Pfänder et al. Reference Pfänder, Münker, Stracke and Mezger2007), and mostly within those of crustal Nb/Ta (11–13) and Archaean greenstones (Nb/Ta 14–18). The Nb/Ta are insensitive, unlike Zr/Hf, during partial melting of OIB-like source (e.g. enriched garnet peridotite). We attribute the subchondritric Nb/Ta in MEs (Nb/Ta: <18.23, except one mafic chanockite sample Nb/Ta: 20.58) to crustal contributions, including meta-komatiite/meta-komatiitic basalts (Archaean greenstones: Singh et al. Reference Singh, Subramanyam, Manikyamba, Santosh, Singh and Kumar2018) in the Bundelkhand craton that got buried deep inside the crust, some slivers of which might have survived at or near the surface at this time. An addition of internally derived aqueous fluid probably imposed significantly low Nb/Ta (8–10) in some felsic MEs, even lower than the crustal Nb/Ta (11–13; Figure 8c). So, deep aqueous fluid-present crust-OIB-like mantle interactions better constrain the origin and evolution of MEs in the craton. However, more research on the hydrated crust-mantle sources and their interactions is needed in future.
7. Summary and concluding remarks
-
1. Intermediate to felsic MEs (magmatic charnockites: 730°C–855°C; TTG: 813°C–817°C, and felsic granulite: 616°C), hitherto unknown and basalt/picro-basalt enclaves (1170–1217°C) in the ∼2.6–2.3 Ga transcrustal Bundelkhand granitoid represent separate magmas, and are neither cumulates (or restites) nor related by crystal fractionation to a single basaltic magma. Coeval mantle-derived and deep crustal magmas coexisted and interacted in the same reservoir during the formation and evolution of the Bundelkhand granitoid.
-
2. Bundelkhand granitoid exposes lower crustal lithologies; basalt/picro-basalt from a hydrous OIB-like mantle got incorporated/ponded at the mantle-deep crust level and interacted to form diverse hydrous mid-to lower-crustal magmas, including TTG in a mainly mantle-derived fluid-fluxed (mantle-lower crust interactions) tectono-magmatic system.
-
3. Magmatic enclaves have superchondritic Zr/Hf (35–50) (except felsic granulite Zr/Hf <34), but subchondritic Nb/Ta (<18), similar to crustal Nb/Ta or less (≤11–13) and Archaean greenstones (Nb/Ta 14–18). Combined with petrography/microstructure evidence, deep aqueous fluid addition (fluid fluxing) likely lowered the solidus temperatures of both the mantle and crust, thereby facilitating partial melting. The fluid-fluxing processes promoted melting, mineral transformation and efficient transfer of elements during magma generation and subsequent crust–mantle interaction. Deep fluid-present melting also explain production of sodic crust in the early Earth.
Supplementary material
The supplementary material for this article can be found at https://doi.org/10.1017/S0016756826101113
Acknowledgements
SS acknowledges an Indian National Science Academy (INSA) Visiting Scientist Fellowship and support from the DST-ANRF (Govt. of India) Major project (file number CRG/2023/006051). D Paul acknowledges support from the Science and Engineering Research Board, Govt. of India (MTR/2021/000280), University of Lucknow for support. Detailed comments by the Editor Prof. Peter Clift and Dr. Eleanor Jennings, Associate Editor, and two anonymous reviewers helped improve including the presentation of the manuscript.
Competing interests
The authors declare that they have no known competing financial interests or personal relationships that could have appeared to influence the work reported in this paper.


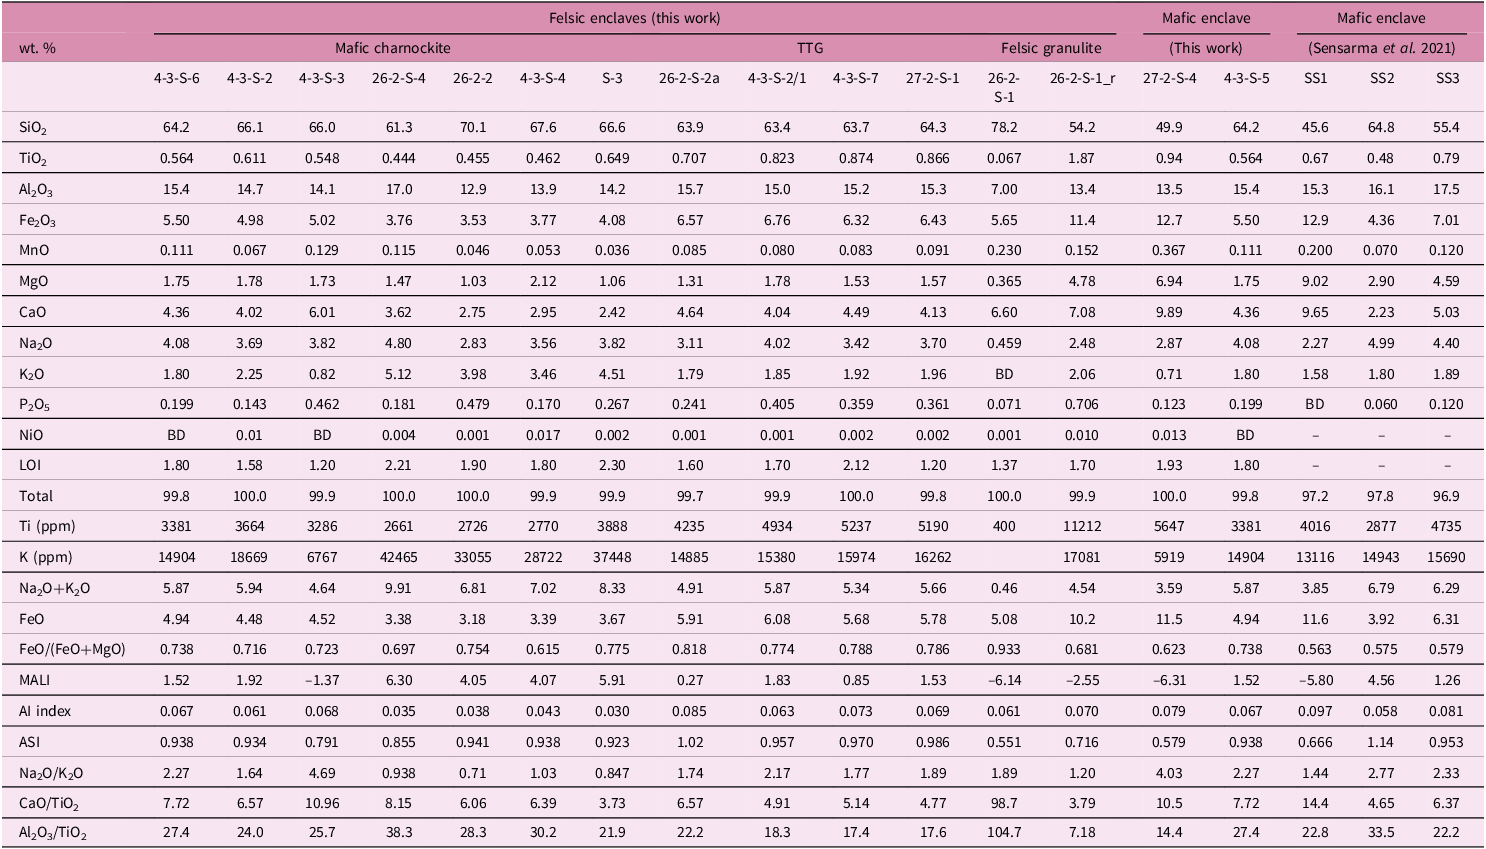

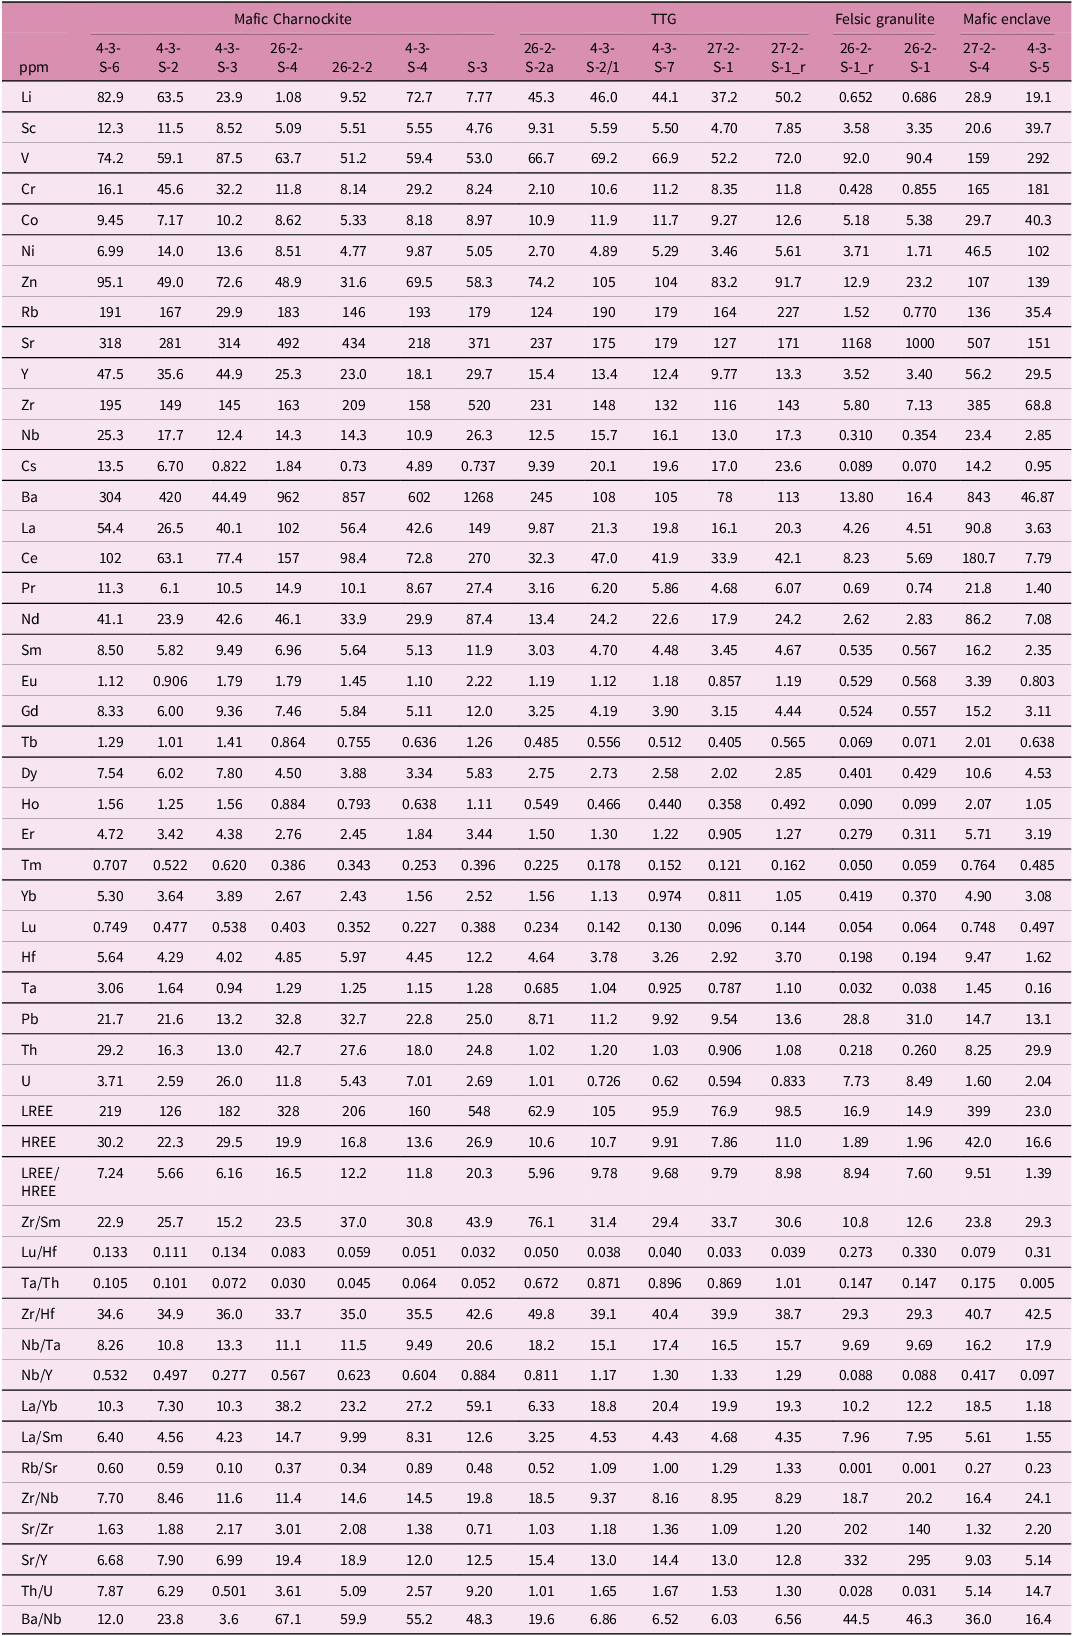


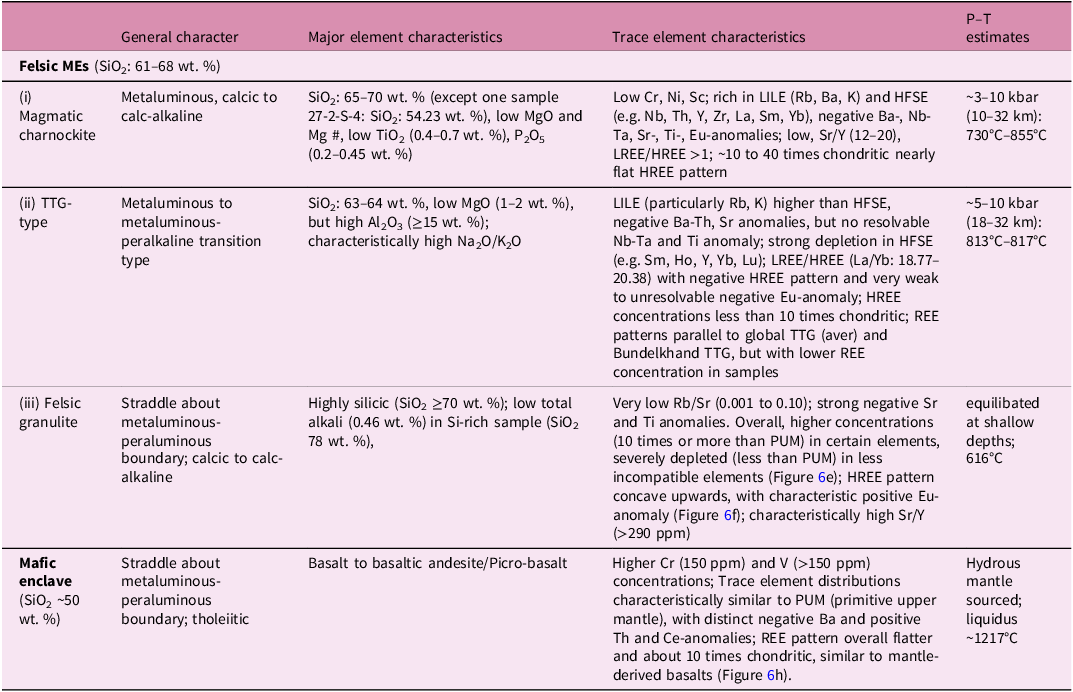


 Open access

