I. INTRODUCTION
ZnO is one of the most widely investigated oxide semiconductors because of the room temperature magnetic applications.Reference Fukumura, Yamada, Toyosaki, Hasegawa, Koinuma and Kawasaki 1 – Reference Calderon and Das Sarma 3 Numerous theoretical and experimental studies have been performed on transition metal-doped ZnO to understand the mechanisms of ferromagnetism.Reference Matsukura, Ohno, Dietl and Buschow 4 – Reference Fitzgerald, Venkatesan, Lunney, Dorneles and Coey 13 Nevertheless, the origin of magnetic behavior of transition metal-doped ZnO structureReference Matsukura, Ohno, Dietl and Buschow 4 – Reference Fitzgerald, Venkatesan, Lunney, Dorneles and Coey 13 is still not well understood. There are three main suggestions for the magnetic behavior in doped ZnO. The first one is the p–d hybridization of orbitals due to holes in the lattice.Reference Pearton, Heo, Ivill, Norton and Steiner 5 , Reference Risbud, Spaldin, Chen, Stemmer and Seshadri 6 The second one is the s–d hybridization in the n-type semiconductor,Reference Peng, Liew, Song, An, Teo and Chong 7 and the third potential mechanism is the formation of transition metal clustersReference Risbud, Spaldin, Chen, Stemmer and Seshadri 6 , Reference Park, Kim, Jang, Ryu and Kim 8 , Reference Sati, Hayn, Kuzian, Regnier, Schafer, Stepanov, Morhain, Deparis, Laugt, Goiran and Golacki 10 , Reference Thota, Dutta and Kumar 14 or the secondary phases in the ZnO lattice.Reference Thota, Dutta and Kumar 14 , Reference Mandal, Das, Nath, Karmakar and Satpati 15 These results have actually increased the debate on the magnetic properties of ZnO, rather than giving a definite answer. Nowadays, another suggestion is focused on the shallow donor/acceptor levels originating from defects in the ZnO crystal.Reference Kittilstved, Liu and Gamelin 16 , Reference Wang, Sun, Chen, Kawazoe and Jena 17 Recent findings have shown the importance of defects, in addition to transition atoms in lattice, on the ferromagnetic ordering.Reference Khare, Kappers, Wei, Blamire and MacManus-Driscoll 18 – Reference Coey, Stamenov, Gunning, Venkatesan and Paul 22 Coey et al.Reference Coey, Stamenov, Gunning, Venkatesan and Paul 22 emphasized the magnetic formation without magnetic ions in both d 0 systems and other oxides with crystal defects.The point defects also determine the electrical and optical properties of ZnO thin films.Reference Chakraborti, Trichy, Prater and Narayan 23 – Reference Guillen and Herrero 28 Furthermore, the point defect density of ZnO is studied for the optical performance,Reference Srivastava, Praveen, Arora, Gupta, Chakraborty, Chandra, Toyoda and Bahadur 29 photoelectrode application for the solar cells,Reference Zhu, Zhou, Ding, Liu, Lin and Dong 30 carrier relaxation dynamics,Reference Layek, Manna and Chowdhury 31 gas sensing,Reference Ahn, Park, Heo, Park, Kim, Choi, Lee and Hong 32 and fluorescent properties for biomedical applications.Reference Jiang, Wang and Wang 33 The defects are seen as the main control mechanism of physical properties of ZnO. Sol–gel,Reference Lee, Jeong, Cho and Park 34 molecular beam epitaxy,Reference Jin, Fukumura, Kawasaki, Ando, Saito, Sekiguchi, Yoo, Murakami, Matsumoto, Hasegawa and Koinuma 35 pulsed laser deposition,Reference Zhang, Liu, Sritharan, Gan and Li 36 metal organic chemical vapor deposition,Reference Shon, Kwon, Yuldashev, Park, Fu, Kim, Kim and Kang 37 and the radio frequency (RF) magnetron sputteringReference Kim and Park 38 techniques are widely used to grow ZnO thin films. The amount of defects in a thin film can be controlled by changing the specific parameters used in the deposition technique. Main control parameters are the gases and their partial pressures used in the sputter deposition, as well as postdeposition annealing temperature and conditions.Reference Lee, Jeong, Cho and Park 34 – Reference Kim and Park 38
Most of the studies are concentrated on “Zn-rich” defects, the oxygen vacancies, and interstitial Zn atoms, due to their lower enthalpy of formation in the ZnO lattice.Reference Zhang, Wei and Zunger 39 The annealing temperature and deposition/postdeposition atmosphere are seen as the main parameters to form and control the point defects in the lattice.Reference Chakraborti, Trichy, Prater and Narayan 23 , Reference Can, Shah, Doty, Haughn and Fırat 26 , Reference Guillen and Herrero 28 , Reference Ravichandran, Srinivasan, Lennon, Sivananthan and Kumar 40 There have been quite a few systematic analyses on defect formation and relation of these defects with dopant atoms, such as transition metals or nonmagnetic elements, in the lattice. In addition to the effects of transition metals substitution for host anion atoms in lattice, the point defects are also effective on the physical properties, such as ferromagnetic behavior,Reference Straumal, Protasova, Mazilkin, Myatiev, Straumal, Schütz, Goering and Baretzky 41 , Reference Subramanian, Tanemura, Hihara, Ganesan, Soga and Jimbo 42 optical transitions,Reference Wang, Liu, Fang, Xuc, Li, Sun, Wu, Li and He 25 – Reference Al-Kuhaili, Durrani, Bakhtiari and Saleem 27 and electrical propertiesReference Can, Shah, Doty, Haughn and Fırat 26 due to the formation of shallow energy levels.
In this study, we have investigated the optimum growth and annealing conditions of the RF magnetron sputtered Zn0.90Co0.10O thin films, deposited on Si(100) substrates. This work is focused on obtaining homogeneously distributed Co dopant atoms and point defects in the Zn0.90Co0.10O thin films by controlling growth and postdeposition annealing conditions. We also aim to assist future studies on the point defects to control physical properties of ZnO.
II. EXPERIMENTAL
We performed the Zn0.90Co0.10O deposition in a RF magnetron sputtering system equipped with 2″ sputter guns. The thin films were deposited from homemade Zn0.90Co0.10O targets. The synthesis process of the homemade targets was described in a previous study.Reference Can, Fırat and Özcan 43 , Reference Can, Fırat and Özcan 44 The targets also exhibited 0.7–1.1% tungsten contamination, which is generated from the vial and the balls of the mechanical miller during the synthesis process.Reference Can, Fırat and Özcan 43
10 × 10 mm Si(100) single crystal samples were used as substrates after cleaning in acetone/alcohol and they were attached to the specimen holder by silver paste. The depositions were performed in argon (70%)–oxygen (30%) plasma for 60 min at 100 W RF power under 10 mTorr pressure. During the depositions, the sample holder temperature was kept at 420 ± 1 °C. This specific gas concentration was the optimal condition of pure ZnO growth in our earlier work,Reference Can, Shah, Doty, Haughn and Fırat 26 where we varied the partial pressures from 0:100 to 50:50 percent. Furthermore, this concentration is optimal to eliminate the formation of metallic Zn clusters and obtain large grain sizes with the preferred orientations.
To create defects in the lattice, three different postdeposition annealing conditions were used. One type of samples was deposited without postdeposition annealing, and the others were deposited with postdeposition annealing under vacuum (in pressure range of 5 × 10⁻⁷ to 1 × 10⁻⁶ Torr) and under 1 mTorr of O2 atmosphere.
The structural analyses were performed by x-ray diffraction (XRD). The XRD patterns were obtained in the 2θ ranges of 15° to 80° using a Rigaku Dmax B model diffractometer (Rigaku, Tokyo, Japan) by using Cu Kα radiation source with a scanning speed of 0.02°/min. Chemical analyses of the films were performed by Oxford Instruments PentaFET-6900 model energy-dispersive x-ray spectrometer (EDS) (Oxford Instruments, Oxford, UK) under 5 kV acceleration voltages.
The surface morphology of the films was examined by JEOL/JMS-7400F model scanning electron microscopy (SEM) (JEOL USA Inc., Peabody, MA) under 3 kV potential.
X-ray photoelectron spectra (XPS) spectra were obtained in a VG ESCALAB 220i-XL (Thermo VG Scientific Ltd., West Sussex, UK) equipped with Al Kα monochromatic x-ray radiation source and solid state imaging detector with ∼0.1 eV resolution. All measurements with XPS were done under ∼1 × 10⁻⁹ Torr pressure. The analyses were done by fixing C 1s binding energy level at 284.6 eV.
The room temperature micro-Raman measurements were taken in the backscattering geometry using a Renishaw inVia Reflex Model Raman spectrometer (Renishaw, Gloucestershire, UK). A 514 nm Ar laser line, with spot diameter of ∼2 μm, was used for excitation. The measurements were recorded in 100–1500 cm−1 and in 550–750 cm−1 range.
Atomic force microscope (AFM) data were acquired in tapping mode with an AFM from NanoMagnetics Instruments, Ltd. (Oxford, UK), using NCHAu-D cantilevers with sharp tips, k ∼ 40 N/m and f 0∼ 300 kHz.
III. RESULTS AND DISCUSSION
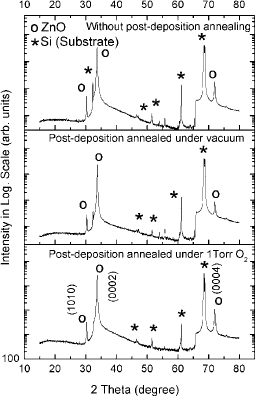
The XRD patterns were measured in wide 2θ range from 15° to 80° to detect the existence of all the possible crystal phases, in addition to ZnO. The peak positions of Si(100) substrate are also demonstrated in Fig. 1, in addition to the XRD peaks of the ZnO thin films. The spectra plotted in logarithmic scale to identify the extra peaks. It was found that there are three main peaks in the spectra at around 30.32°, 33.84°, and 72.02°. These peaks were in agreement with the planes of (1010), (0002), and (0004) of the hexagonal ZnO (ICDD PDF No. 00-036-1451), respectively. The dominant peak was observed for the (0002) plane, showing the preferred growth direction. No peaks from metallic Co or oxide state of Co were observed, which can be correlated to the clustering of the Co atoms in the ZnO lattice.
XRD patterns of the films grown from Zn0.90Co0.10O target without postdeposition annealing, postdeposition annealing under vacuum atmosphere, and postdeposition annealing under 1 Torr O2 atmosphere.

The XRD patterns were not sufficient to draw out information about the amount of Co and other impurity atoms in ZnO. The concentration of Co and the other contaminant atoms in the films were measured from the EDS spectra. The EDS data, shown in Table I, are the results of the mean values of five different regions of the sample. All the data, shown in Table I, are normalized by the total number of atoms in the lattice; Zn, Co, W, and O. The average concentration of tungsten atoms in the films was 0.9% ± 0.1%. The Co distributions on the surface of the Zn0.90Co0.10O thin films were 8.2% ± 0.3%. The homogeneity in each thin film did not vary considerably. As it was mentioned in Sec. II, the tungsten impurities were suspected to come from the manufacturing process of the target.
EDS data of Zn0.90Co0.10O thin films.

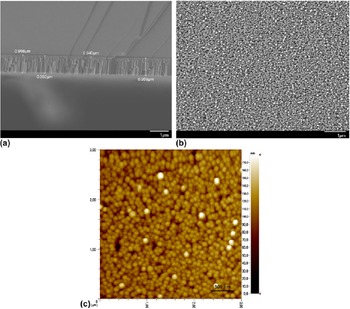
The cross-sectional measurements were performed using SEM to determine the thickness of the films that were grown from Zn0.90Co0.10O targets. The results are summarized in Table I. The cross-sectional SEM image of the thin film deposited without the postdeposition annealing is given in Fig. 2(a). Morphologically, the only change observed is the surface roughness, measured by SEMReference Reimer 45 and AFM, at different postdeposition annealing conditions. The SEM and AFM images of the thin films without the postdeposition are shown in Figs. 2(b) and 2(c), respectively. The AFM images were in agreement with the SEM data. The AFM images were used to measure the surface roughness. The measured roughness shows that the postdeposition annealing procedure decreases the surface roughness. The surface roughness, calculated from AFM images, were 67 ± 2 nm, 37.2 ± 0.5 nm, and 25.8 ± 0.6 nm for the non-postdeposition annealing, annealing under vacuum, and annealing under O2 conditions, respectively. The main reason of decline in roughness originates from the enhanced grains by annealed in vacuum atmosphere and oxygen.Reference Husna, Aliyu, Islam, Chelvanathan, Hamzah, Hossain, Karim and Amin 46 – Reference Sahu and Huang 49 Annealing at 400 °C seems to supply sufficient energy to surface atoms to diffuse into the surface vacancies or defects.Reference Khairnar and Mahajan 48 The smaller surface roughness at thin film annealed in an oxygen environment also reveals larger grain size than the others due to an adequate amount of oxygen atoms in environment.
The SEM micrographs of (a) cross-sectional thickness and (b) surface morphology and (c) the AFM image of Zn0.9Co0.1O films without postdeposition annealing.

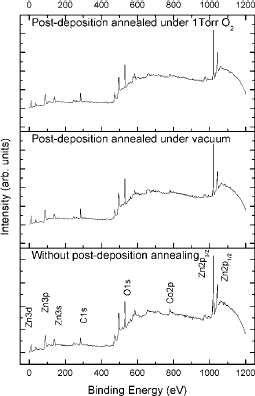
After proving the existence of Co atoms in films, their positions in the lattice were determined by the XPS spectra. The spectra of the thin films are presented in Fig. 3. The energy levels of Zn, Co, and O were clearly observed in the spectra. The postdeposition annealing conditions, doped Co atoms, or W impurities did not change the position of the energy levels of Zn 2p 1/2 and Zn 2p 3/2, which are 1020.41 and 1043.48 eV, respectively. The data shown are the mean values of all thin films. The energy difference between Zn 2p 1/2 and Zn 2p 3/2 was calculated to be 23.07 ± 0.02 eV, which was in agreement with the literature.Reference Wagner, Riggs, Davis and Moulder 50
XPS spectra of the films grown from Zn0.90Co0.10O target without the postdeposition annealing, postdeposition annealing under vacuum atmosphere, and postdeposition annealing under 1 Torr O2 atmosphere.

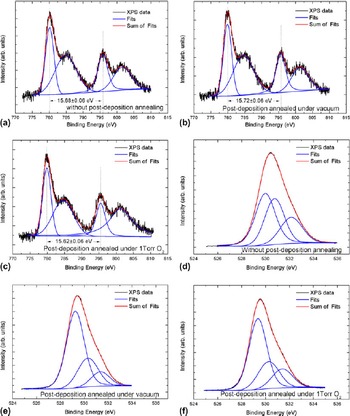
The Co 2p and O 1s XPS peaks were investigated in detail to understand the positions of Co atoms and O vacancies in lattice, respectively.Reference Lai and Lee 51 – Reference Lennon, Tapia, Kodama, Chang, Sivananthan and Deshpande 55 The Co 2p peak energy splits into two singlets as shown in Figs. 4(a)–4(c). As seen from figure, the energy split, 15.67 ± 0.06 eV, between Co 2p 3/2 and Co 2p 1/2 states is the same for all the films. Furthermore, the energy shift of the Co 2p1/2 peak, with respect to the metallic state of cobalt (778.1–778.3 eVReference Wagner, Riggs, Davis and Moulder 50 ), is 780.05 ± 0.04 eV. We interpret this as the cobalt atoms have substituted Zn+2 ions as Co+2, as mentioned in previous studies.Reference Peng, Liew, Song, An, Teo and Chong 7 , Reference Wagner, Riggs, Davis and Moulder 50
XPS spectra of (a)–(c) the Co 2p (in binding energy range of 770 and 815 eV) and (d)–(f) O 1s (in binding energy range of 524 and 537 eV) energy levels for the films deposited by Zn0.90Co0.10O target without postdeposition annealing, postdeposition annealing under vacuum, and postdeposition annealing under 1 Torr O2 atmosphere, respectively.

The XPS is a surface sensitive tool and can only give information about 20 nm depths from the surface. However, if the surface of the film is not too different than the rest and is not effected by other factors, the XPS data can be taken as representative of the film itself. Furthermore, the XPS may also provide general information about the point defects density in thin films. The effects of the postdeposition annealing condition on the defects were also investigated by analyzing O 1s peaks in XPS data. The oxygen 1s peak observed in XPS is composed of three closely spaced energy levels: Oa, Ob, and Oc. The analyses were done for spectra taken under identical conditions, and the defect density was related to the change at the ratios of relative intensities in O 1s energy level. The O 1s energy levels in Fig. 4 were fitted to three curves, mixture of the Gaussian and Lorentzian functions. The calculated average values of the peak positions are at around 529.6 ± 0.1 eV (Oa), 530.5 ± 0.1 eV (Ob), and 531.6 ± 0.1 eV (Oc) as presented in Table II.
Fitted curves of O 1s peak positions for thin films deposited from Zn0.90Co0.10O target.

Oa, Ob, and Oc peak positions are originated from the O−2 ions surrounded by Zn atoms, from defects either having or originating O−2 deficiency in lattice and from chemisorbed dissociated oxygen or OH species on the surface as H2O molecules or weakly bonded CO3 molecules, respectively.Reference Lai and Lee 51 , Reference Hsieh, Chen, Kao and Wang 52 The postdeposition annealing conditions did not shift the energy level. Nevertheless, a change in relative intensities of the normalized areas of A a (the area of Oa peak), A b (the area of Ob peak), and A c (the area of Oc peak) were observed at different annealing conditions. In the analysis, A a/(A a + A b) and A b/(A a + A b) ratios were investigated, relating to A a and A b to the amount of O−2 cation in the lattice. The results of the calculations were shown in Table II. With postdeposition annealing, the intensity in A b/(A a + A b) ratios decreased, while that in A a/(A a + A b), ratios increased. This suggests that the postdeposition annealing causes lower defect density due to O−2 deficiency in the main ZnO lattice. The changes in ratios are demonstrated in Table II.
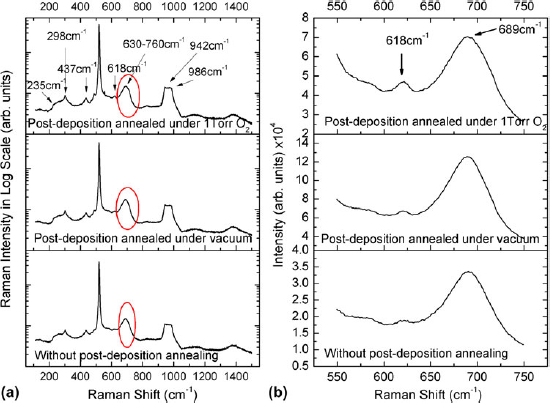
The possible defects in the lattice due to cobalt substitution and postdeposition annealing were also analyzed using Raman spectra as shown in Fig. 5. The measurements were taken in 100–1500 cm−1 and 550–750 cm−1 Raman shift range as shown in Fig. 5(a) and in Fig. 5(b), respectively. In addition to the Raman peaks of silicon substrate at 298 cm−1,Reference Xu, Lau, Chen, Chen and Tay 56 520 cm−1,Reference Zeng, Low, Ren, Liew and Lu 57 and 618 cm−1,Reference Xu, Lau, Chen, Chen and Tay 56 , Reference Zeng, Low, Ren, Liew and Lu 57 five more modes (a broad mode in between 200–280, 437 cm−1, another broad peak in between 630–760, 942 and 986 cm−1) were obtained in the Raman spectra. Two of these broad peaks, the peak in between 200 and 280 cm−1 and the peak at around 437 cm−1, are attributed to the ZnO vibration modes.Reference Xu, Lau, Chen, Chen and Tay 56 Furthermore, the broad peaks around 942 and 986 cm−1 were observed as the second-order vibrations of ZnO crystal.Reference Zeng, Low, Ren, Liew and Lu 57 The last Raman mode was at 691 cm−1 as shown on Fig. 5(b). This mode was related to the disordered Zn–O–Co vibrations.Reference Sudakar, Kharel, Lawes, Suryanarayanan, Naik and Naik 58 The analysis was extended by repeating the measurements in between 550 and 750 cm−1 for 300 s integration time to make the peaks more visible. A specific enhancement in intensity depending on postdeposition annealing was observed.
The Raman spectra of thin films grown without postdeposition annealing, postdeposition annealing under vacuum, and postdeposition annealing under 1 Torr O2 atmosphere (a) in the full range and (b) in the interval of 550–750 cm−1.

The study of Sudakar et al.Reference Sudakar, Kharel, Lawes, Suryanarayanan, Naik and Naik 58 emphasized the disappearance of Zn–O–Co vibrations by forming oxygen vacancies at around Co atoms in the lattice, and the consequences were observed by the decreased Raman intensity, which was in agreement with our observations, as shown in Fig. 5(b). The decrease in this peak intensity in Raman spectrum is attributed to the decrease in the concentration of oxygen-dependent defects in the lattice. The lowest intensity was observed in the film deposited without postdeposition annealing that means the highest defects according to the others.
IV. CONCLUSIONS
In this study, the Zn0.90Co0.10O thin films were grown by using RF sputtering with homemade Zn0.90Co0.10O targets. It was attempted to dope 10% Co atoms in ZnO films by using Zn0.90Co0.10O target; however, only 8.2% ± 0.3% Co atoms were evenly distributed as determined from the results of surface analysis. The Co atoms were observed to be substituting the Zn atoms in lattice, and this also decreased the band gap at around 0.34 eV, according to the XPS spectra. In addition, the concentrations of tungsten impurities in thin films were in between 0.5% ± 0.1% and 1.1% ± 0.2% and these impurities located as oxidized states. In addition to the expected structure, the defects were also formed in the lattice, which was found from the asymmetry of O 1s peak positions and from the intensity decrease of Raman mode at around 691 cm−1.
ACKNOWLEDGMENTS
We acknowledge the financial support of the Scientific and Technological Research Council of Turkey (TUBİTAK), BİDEB-2218 program.