


1. Introduction
Today, men on average retire at 64 and women at 63, and they can expect to spend over 20 years in retirement. But if Americans continue to retire as early as they do today, many will not have adequate income once they stop working. That is, many older people need to work longer in order to ensure a secure retirement. The question is whether employers will hire and retain them. This paper reports on a survey of employer perceptions of the productivity, costs, and net value of their older workers relative to their younger ones. Since the new survey replicates a similar 2006 effort, it also allows a comparison of employer perceptions over a period when technology has evolved and the older workforce has grown.
The reason for working longer is that retirement resources are declining just as the need for resources is increasing. Social Security, the backbone of the retirement system, will not replace as much preretirement income in the future as it does today. Employer-sponsored retirement plans also involve considerably more uncertainty, given the shift from defined benefit plans to 401(k)s. With these institutional saving arrangements on the decline, people could decide to save more on their own. But they rarely save outside employer plans, with the exception of home equity – an asset that retirees are reluctant to tap. Combine the retirement income crunch with the dramatic increase in life expectancy, growing health-care costs, and low interest rates, and continued employment in later life is the best option for ensuring financial security.
American workers appear to have gotten the message. Over the past three decades, the share of people planning to work past age 65 has increased from 18 percent to 45 percent.Footnote 1 The problem is that nearly two in five workers end up retiring earlier than planned.Footnote 2 To the extent that these premature retirements reflect employer resistance to older workers, the prescription to work longer will be hard to achieve. Employer resistance could result from general misperceptions about older workers’ abilities or concern that their costs may outweigh their productivity well before they plan to retire. Such uncertainty may lead employers to circumvent rules against age discrimination by devising policies that avoid and shed older workers. One way to identify the problem, to the extent one exists, is to ask employers about how they assess the capabilities and costs of older versus younger workers.
The discussion proceeds as follows. Section 2 summarizes what we know about older workers – basic characteristics, assessments of their productivity, their costs versus those of younger workers, evidence of employer discrimination against older workers, and what employers have said in previous surveys. Section 3 describes the 2019 survey and reports the results. Section 4 compares the 2019 results with those for 2006. Section 5 concludes that, overall, employers say they find older workers as attractive as younger ones despite their higher perceived costs, and the 2019 results – compared with those for 2006 – show a notable improvement in employer perceptions of support workers.
2. Background
Although relatively little is known directly about employer demand for older workers, relevant information is available on a number of fronts. First, the gaps between older workers and younger workers in education, health, and computer use have been shrinking (Munnell et al., Reference Munnell, Soto and Golub-sass2008; Quinby and Wettstein, Reference Quinby and Wettstein2023). Second, most empirical studies show that, contrary to negative stereotypes, most older workers are engaged and productive (see Aubert and Crépon, Reference Aubert and Crépon2006; Malmberg et al., Reference Malmberg, Lindh and Halvarsson2008 and Börsch-supan and Weiss’s , Reference Börsch-supan and Weiss2016). Third, the data on wages, retirement plans, and health insurance indicate that older workers cost more than their younger counterparts (see De Hek and Van Vuuren, Reference De Hek and Van Vuuren2011 for a review of the literature on this issue). Fourth, a narrowing of employment options for older workers and findings from résumé audits document that older workers face some forms of discrimination (for recent evidence, see Neumark, Burns, and Button, Reference Neumark, Burn and Button2019). Finally, prior surveys of employer attitudes toward older workers reveal a nuanced assessment and generally do not address the productivity/cost trade-off. Summarizing what is known about older workers and their employers provides context for interpreting the results of the 2019 survey presented in this paper.
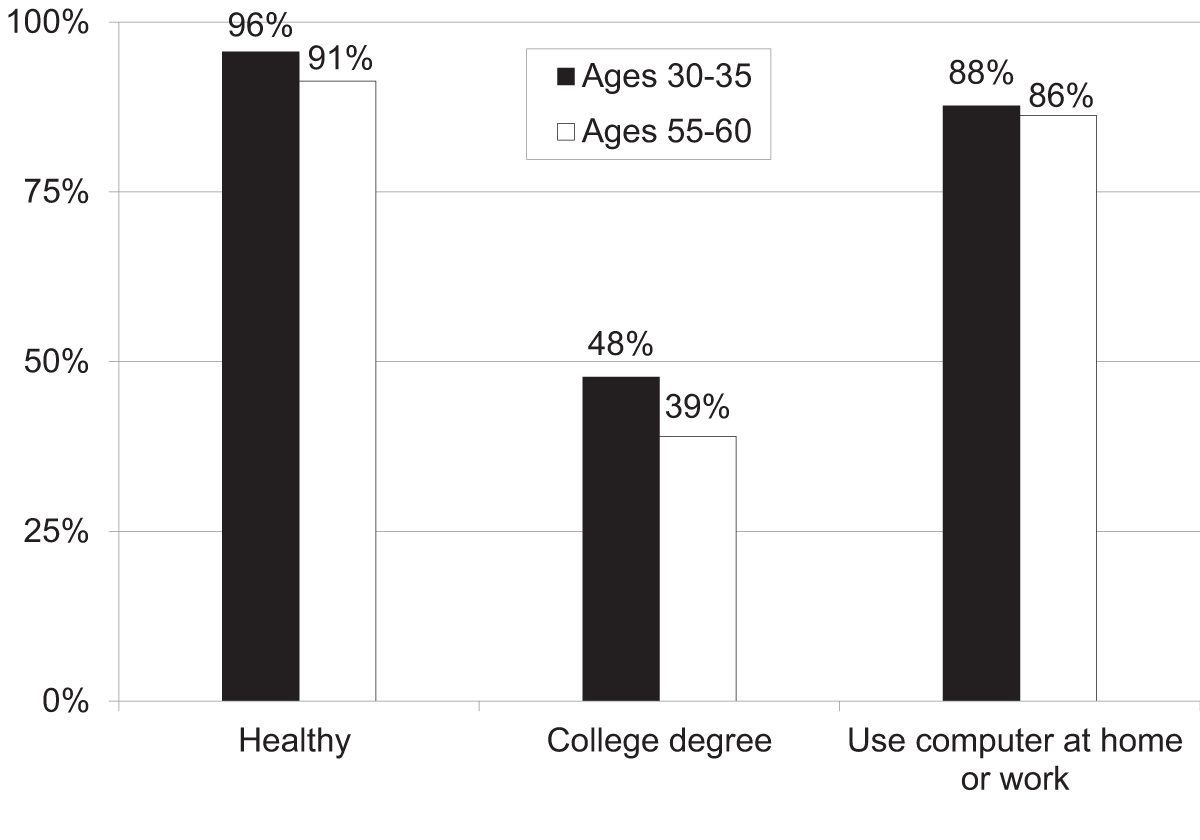
Characteristics of older workers. The big news about older workers today is that they look a lot like younger workers. This pattern is consistent across health, education, and computer use (see Figure 1).
Percentage of workers healthy, college-educated, and computer savvy for young (30–35) and older (55–60) workers, 2018.

The improvements in longevity and health have been dramatic. At age 50, both men and women can expect to live for many years – 27 and 31, respectively, up substantially over the past several decades (Quinby and Wettstein, Reference Quinby and Wettstein2023). These gains in life expectancy have been accompanied by gains in overall health. By 2018, 91 percent of workers ages 55–60 reported that their health was ‘good’, ‘very good’, or ‘excellent’, only slightly below the 96 percent for workers ages 30–35. These improvements in health have also impacted how long workers can actually work – high-education workers have seen significant improvement in their ‘working life expectancy’, although such gains have been much less pronounced among lower-education workers (Quinby and Wettstein, Reference Quinby and Wettstein2023).
On the cognition front, psychologists have also identified two types of cognitive abilities: one involving mastering new material quickly and one relating to accumulated knowledge, verbal meaning, and word skills. Laboratory and other evidence show a clear decline as people age in the first ability – mastering new material quickly – but no decline in the second. In fact, older workers have often accumulated substantial knowledge and have devised efficient ways to do their work (Warr, Reference Warr, Triandis, Dunnette and Hough1994; Skirberkk, Reference Skirberkk2003).
In terms of education, over the twentieth century, each generation of workers completed more years of schooling than the previous ones. As a result, for a long while, younger workers maintained a consistent educational advantage over older workers. However, increases among younger cohorts of males slowed dramatically after the mid-1970s. As a result, by the time male Baby Boomers entered their 60s, the educational advantage of the young had considerably narrowed. In 2018, the percentage of male workers with at least a four-year college degree was 45 percent for those ages 30–35 and 39 percent for those ages 55–60.Footnote 3 A slightly larger gap still exists for women (51 percent vs. 39 percent), because each generation of women continues to get more education. This gap, however, is also narrowing.
In terms of technology, the share of workers using computers at home is nearly identical for younger and older workers at 88 and 86 percent, respectively. And older workers are rapidly catching up to younger workers in terms of ownership of smartphones and tablets and use of social media. For example, between 2011 and 2018, the percentage of Baby Boomers with a smartphone surged from 25 percent to 67 percent.Footnote 4 Moreover, a study of computer programmer ratings in an online discussion forum, with ratings based on factors such as subject matter expertise and peer respect, showed a positive relationship between age and reputation extending well into a programmer’s 50s.Footnote 5
While older workers are roughly equal to their younger counterparts in terms of the human capital that they bring to a job, they also have decades of experience. This experience can manifest itself in the form of specialized skills associated with craftspeople, musicians, or artists or in accumulated knowledge that allows salespeople to fully understand their products, analysts to recognize patterns within masses of data, and manufacturing workers to anticipate and avoid mistakes in the production process. Older workers also have networks and contacts that allow them to quickly reach out to the people needed to get a job done, secure funding for a new venture, or deliver a product to a target market through established distribution channels. The question is the extent to which these attributes make older workers as productive as their younger counterparts.
Evidence on the productivity of older workers. The connections between job performance, cognitive aptitude, and physical ability – on the one hand – and age, on the other, have been topics of extensive research in psychology and medicine (Ng and Feldman, Reference Ng and Feldman2008; Skirbekk, Reference Skirbekk2008; Salthouse, Reference Salthouse2009; McGee and Wegman, Reference McGee and Wegman2004). While the evidence suggests that some cognitive abilities and physical functions decline on average with age, it is a matter of controversy whether these declines may be offset, fully or partially, with gains in wisdom or judgement. Interestingly, despite stereotypes that performance generally declines with age, the empirical studies provide little hard data to support that conclusion.
The challenge, of course, is how to measure productivity. In a simple manufacturing environment, number of widgets per hour would answer the question. But often output cannot be described in terms of unique units, so the effects on productivity of age-related changes are difficult to measure in many occupations. In these cases, researchers have looked at wages.
For example, Burtless (Reference Burtless2013) found that workers ages 60–74 earned 10–20 percent more, on average, than workers ages 25–59. To the extent that higher wages reflect higher productivity, the results suggest that older workers are more productive. The source of the greater productivity could come from increasing capabilities with age or from more productive older workers deciding to stay in the workforce longer than less productive ones.
Burtless’ positive assessment of older workers is supported by Börsch-supan and Weiss’s (Reference Börsch-supan and Weiss2016) study of a German Mercedes-Benz truck assembly plant. They found that the average productivity of workers increased steadily from age 25 to age 60 and that older workers offset characteristics that decline with age by experience and ability to work well in a team. As a result, older workers made fewer severe errors on the assembly line. The authors argue that these findings are probably generalizable to many large-scale manufacturing facilities.
Considerable evidence suggests that firm productivity is enhanced by using mixed-age teams. An analysis of German data found that such collaboration effectively melds the disparate talents of older and younger workers (Zwick and Göbel, Reference Zwick and Göbel2013). Similarly, with respect to United States workers, the Wall Street Journal has highlighted how the pairing of older and younger workers helps drive innovation by combining fresh ideas with the necessary know-how to bring the idea to fruition. For example, the software industry, long known for lionizing the whiz-kid inventor, often relies on more seasoned employees to nurture an innovation into a viable and profitable product (Wadhwa, Reference Wadhwa2013).
More important than the individual studies, a series of meta-analyses produces a generally positive picture about the productivity of older workers. Waldman and Avolio (Reference Waldman and Avolio1986) looked at 40 studies that evaluated performance based on supervisory ratings, peer ratings, and individual productivity. The results showed increased productivity, as measured by productivity indices, at higher ages. On the other hand, supervisory ratings tended to be slightly lower for older employees, more so for non-professionals than for professionals. Ng and Feldman (Reference Ng and Feldman2008) found, in a series of meta analyses, that across 350 empirical studies long-tenured employees had better job performance and were better colleagues (2010), that across 418 studies no evidence supported five of the six negative stereotypes of older workers (2012),Footnote 6 and that across 98 studies older workers and longer-tenured workers are no less innovative than their younger and less-tenured counterparts.
Some studies emphasize the heterogeneity in the relationship between age and performance. Sturman (Reference Sturman2003) uses a meta-analysis in an attempt to establish an inverted U-shaped relationship between experience, organizational tenure, and age. He finds that the relationship holds for low-complexity jobs, but not for high-complexity jobs, where – over time – experience becomes more predictive of job performance. Belbase et al. (Reference Belbase, Sanzenbacher and Gills2015) argue that since some physical and cognitive abilities decline much earlier than others, workers in some occupations may be able to work effectively much longer than in other occupations.
The key takeaway from the productivity studies is the failure to produce strong evidence that productivity declines with age and the strong suggestion that it may increase. The next question is the extent to which the strengths of older workers offset any increase in costs.
Costs of older workers. The costs of workers include not only out-of-pocket expenditures for wages, retirement plans, and health benefits but also reliability.
Financial costs. The full cost of a worker includes wage, retirement, and health insurance expenses. Older workers are more expensive across each of these dimensions, although the shift from defined benefit plans to 401(k)s has dramatically reduced the cost differential.
In terms of wages, full-time male and female workers ages 55–60 cost about 25 percent more than those 30–35 with the same gender and educational attainment (Current Population Survey 2018). Some contend that the reason wages continue to be higher for older workers is that they are doing harder jobs – that is, jobs that require more intensive social, verbal, and math skills (Wiczer, Reference Wiczer2015), which is related to the possibility that older workers may be more productive than younger ones.
In terms of retirement costs, the shift to 401(k)s has reduced an element of compensation in which costs rose sharply with age and service to one where the employer’s cost remains a fixed percentage of wages across the age spectrum. Nevertheless, to the extent that older workers earn slightly higher wages, any employer matching contributions to a 401(k) plan will also be slightly higher.
Health insurance for many employers is the most costly non-wage benefit and is often cited as an area where older workers cost significantly more than their younger counterparts. To the extent that the hypothesis is correct, firms with a larger share of older workers will see higher outlays if they self-insure or pay higher premiums if they purchase policies from insurance companies. The data on private insurance reimbursements of workers by age confirm that health costs rise with age: during 2015–17, reimbursements averaged $4,589 for workers 55–60 compared to $2,504 for workers 30–35 (U.S. Department of Health and Human Services, Medical Expenditure Panel Survey 2015–17; Burtless, Reference Burtless2017). However, this gap has been shrinking somewhat over time.
The employer cannot shift the burden of these higher costs to the employee, because health insurance premiums do not vary by age and because the Age Discrimination in Employment Act prevents paying older workers lower wages to offset higher health insurance costs. The Affordable Care Act also limits non-group premiums’ capacity to vary by age to a band of 3-to-1 for the oldest versus the youngest beneficiaries, improving the outside options of older workers if they are not offered health insurance through their employer. The extent to which the $2,085 difference in health costs would affect the hiring decision likely depends on the level of the wage. For a worker earning the average wage of roughly $50,000, the difference in health insurance costs amounts to 4.2 percent; for a worker earning $150,000, it amounts to only 1.4 percent.Footnote 7
Turnover. Worker turnover can be anticipated or unanticipated. Anticipated turnover often comes in the form of retirement. Retiring employees tend to give at least three to six months’ notice, which allows the employer time to decide who will take on the role, bring the new person on board, and have the retiring employee transfer knowledge to the new employee. Anticipated turnover is simply part of running a business. Unanticipated turnover, in contrast, can create significant difficulties. If the employee resigns with little notice, the employer is left scrambling to find a replacement and train the new employee. Studies show that for positions earning $75,000 or less, which covers 9 in 10 United States workers, the typical turnover cost is equivalent to about one-fifth of a worker’s annual salary (Boushey and Glynn, Reference Boushey and Glynn2012). On the assumption that departures within the worker’s first two years at the firm are more likely to fall into the unanticipated category, older workers are more likely to remain with their employer and therefore less likely to leave abruptly than younger workers. While unanticipated health shocks may be more likely to impact older workers and lead to turnover, this effect seems swamped by the greater attachment to the job exhibited by older employees. Calculations from the University of Michigan’s Panel Study on Income Dynamics (PSID, University of Michigan, 2015-2017) show that 84 percent of workers 55–60 remain with their employer after two years compared to 73 percent of workers 30–35.
Even with a reduction in turnover, older workers generally cost more than younger workers. The challenge for employers is to gauge whether they are worth the additional amount.Footnote 8 The following discusses what we know about employer reaction to older workers from studies that document bias against job seekers and from what employers have reported in earlier surveys.
Evidence of discrimination. Two main models of discrimination are prevalent in economic thinking. The first is statistical discrimination, based on Arrow’s (Reference Arrow, Ashenfelter and Reese1973) theory that observable characteristics (such as age) may proxy for less easily measured characteristics that may be important for employers (such as productivity), and thus that employers may discriminate based on the observable traits. The second is taste-based discrimination, based on Becker’s (Reference Becker1957) theory that employers may discriminate against certain groups because of a dislike of working with those groups, on their own part, the part of other workers, or the part of customers. Recent experimental work has found corroboration for the former theory in the case of age discrimination, documenting that age signals a lack of technological skill, flexibility, and trainability in a way that explains 41 percent of the effect of age on the probability of being invited to an interview (Van Borm et al., Reference Van Borm, Burn and Baert2019).
Although discrimination is often difficult to identify, at least two forms – narrowing of occupations open to older job seekers and bias against older job applicants – have been documented.Footnote 9 These factors may explain why older workers spend much more time unemployed should they lose their jobs (Neumark and Button, Reference Neumark and Button2014; Abrams et al., Reference Abrams, Swift and Drury2016). In addition, older workers may be frequently eased out by employers (Johnson and Gosselin, Reference Johnson and Gosselin2018). It is unclear whether managers are more concerned about older workers’ productivity or their costs. As discussed above, some may believe the negative stereotypes, such as disinterest in building skills (e.g., Fritzsche and Marcus, Reference Fritzsche and Marcus2013), a lack of ambition (e.g., Bowen and Staudinger, Reference Bowen and Staudinger2013), health challenges (e.g., Hummert et al., Reference Hummert, Garstka, Shaner and Strahm1994; Ng and Feldman, Reference Ng and Feldman2012), inflexible personalities (e.g., Fritzsche and Marcus, Reference Fritzsche and Marcus2013), and less familiarity with technology (e.g., AARP, 1999).Footnote 10 That is, they assume that older job seekers will be less productive than younger applicants who have the same credentials. Alternatively, employers may think that fringe benefits make older workers more expensive to employ, even if they are paid the same wage and are just as productive as identically credentialed younger employees.
In terms of job opportunities, early research on job-changing at older ages generally showed that workers ages 55 and over found employment in relatively few occupations (Hutchens Reference Hutchens1986, Reference Hutchens1988, Reference Hutchens1991, Reference Hutchens and Mitchell1993). These ‘old person’ occupations included low-paying, low-status jobs, such as night watchmen, retail clerks, and crossing guards. This narrowing of job options reflected the decisions made by employers, not workers, since many older workers were already employed in occupations where few older workers were hired, indicating that older workers were willing and able to do the work. The occupations from which older job-seekers were excluded were generally associated with long tenures, traditional pension plans, seniority rights, and hiring from within. A later study confirmed that personnel policies in the 1990s created impediments to hiring job-seekers ages 50 and over (Hirsch et al., Reference Hirsch, Macpherson and Hardy2000). An update of this literature, however, suggests that today’s older workers may have more options, possibly attributable to the shift from pensions to 401(k)s, the decline of traditional personnel policies, and the improvement in the educational attainment of older workers (Rutledge et al., Reference Rutledge, Sass and Ramos-mercado2015).
While job opportunities may have improved, employer bias in hiring is still evident in randomized trials involving older and younger job applicants. These trials involve creating fictitious résumés and cover letters that are roughly equal except for the age of the applicant (Fix and Struyk, Reference Fix and Struyk1993; Bertrand and Duflo, Reference Bertrand and Duflo2017; Neumark, Reference Neumark2018; Button, Reference Button2019).Footnote 11 These fictitious job applicants then apply for real job openings, and employers either do or do not request interviews with the candidates. Researchers measure hiring discrimination by comparing interview request rates by age, since according to studies of ethnic discrimination, most of the discrimination occurs at the interview offer stage (Riach and Rich, Reference Riach and Rich2002; Neumark et al., Reference Neumark, Burn and Button2019). These field experiments almost always point to substantial age discrimination in hiring (Baert et al., Reference Baert, Norga, Thuy and Van Hecke2015; Benedick et al., Reference Benedick, Jackson and Horacio Romero1997, Reference Benedick, Brown and Wall1999; Carlsson and Eriksson, Reference Carlsson and Eriksson2019; Lahey, Reference Lahey2008; Riach and Rich, Reference Riach and Rich2006, Reference Riach and Rich2010).Footnote 12 Among employers whose size could be determined, researchers found that large employers were more likely to discriminate against older applicants, perhaps because they are also more likely than smaller ones to offer generous benefit plans that cost more as workers age (Wiatrowski, Reference Wiatrowski2013).
The most recent and largest experiment included two improvements over earlier studies (Neumark et al., Reference Neumark, Burn and Button2019). First, it included workers ages 64–66, a group for whom continued employment is particularly salient. Second, to make the job applications of older people more realistic, it focused on ‘bridge jobs’ that seniors often take, such as administrative assistant and retail sales for women, and retail sales, security, and janitor for men. The researchers sent over 40,000 applications for young (ages 29–31), middle-aged (ages 49–51), and senior (ages 64–66) workers to over 13,000 job positions. Across all occupations and genders, the senior applicants got fewer callbacks than the young applicants. The evidence is more mixed for middle-aged applicants. Female middle-aged applicants have a statistically significant lower callback rate, but no evidence of discrimination appeared against middle-aged men. In the cases where both senior women and men faced age discrimination, the magnitude of the discrimination against senior women was much larger.
Along similar lines, recent work by Lahey and Oxley (Reference Lahey and Oxley2021) and Lahey and Mosquera (Reference Lahey and Mosquera2024) examined whether age discrimination in evaluating resumes varied by race and ethnicity. While both studies found evidence of age discrimination in this first stage of the hiring process, the results showed complex intersectional discrimination. Whereas the pattern of age discrimination did not differ by ethnicity, Black-coded resumes elicited more discrimination at young and old ages, but less at peak working years.
The findings from résumé studies confirm that many employers prefer to interview younger rather than older job applicants. It is more difficult to determine whether they prefer to retain and promote younger workers already on their payrolls as opposed to equally or more qualified older workers. Audit studies cannot speak to these aspects of labor discrimination on their own. Such studies also leave researchers with difficulty in identifying employers’ motives for favoring younger job applicants. Do they worry about older workers’ productivity or their costs? Finally, as stated in Lahey and Mosquera (2024), for example, audit studies cannot provide evidence of possible discrimination at more advanced stages of the hiring process such as interviews. Surveys of employers are one way to address these questions.
Previous surveys of employers. Surveys of United States employers on the value of their older workforce are somewhat rare. The exceptions include a 2006 telephone survey of 400 private sector employers (Munnell et al., Reference Munnell, Sass and Soto2006), which is updated in the current study, and two recent surveys.Footnote 13
In the 2006 survey, 56 percent of respondents characterized older professional workers as equally or more productive than younger workers, while only 6 percent characterized them as less productive. While the researchers found that employers viewed older workers as more expensive, the vast majority of respondents stated that older workers are ‘as attractive’ or ‘more attractive’ than younger workers, suggesting that employers generally perceive older workers as matching or exceeding younger workers in productivity.
The first of the recent surveys, conducted by the Society for Human Resource Management (SHRM) in 2014, had three parts: (1) the state of older workers in United States organizations; (2) recruiting and retaining older workers; and (3) basic and applied skills of older workers (Society of Human Resource Management 2015a, 2015b, 2015c). The survey found that a sizable minority of employers thought that the aging of their workforces was a problem, but that few had developed a plan to address it. The survey also found that employers valued their older employees’ writing ability, work ethic, and professionalism relative to younger workers. However, the survey did not seek to determine whether these positives were offset at all by higher costs. Therefore, while the survey was valuable in understanding how employers view the challenge of an aging workforce, it did not address whether they would be inclined to hire an older worker over a younger one.
The second recent work was a series of three surveys conducted by Clark et al. (Reference Clark, Nyce, Ritter and Shoven2019) that targeted: (1) HR managers; (2) risk managers; and (3) HR managers specifically at grocery manufacturers. The focus of these surveys was on how the various groups were planning for the aging of their workforces, with special consideration given to the perceived risk of talent loss and any measures being taken to reduce that risk. The findings suggest that HR managers have concerns about the cost of older workers and at the same time risk managers view talent loss due to aging as a major concern. Similar to the SHRM survey, these surveys did not ask the respondents to consider the relative productivity and costs of older to younger workers, and thus did not address the value of hiring older workers.Footnote 14
To better understand the employment prospects of older workers, this study conducted a new survey of 400 private sector employers. These employers were asked to evaluate the relative productivity and cost of professional and support workers ages 55 and older and whether, on balance, older employees or job candidates were more or less attractive than their younger counterparts.
3. The 2019 survey
The new survey was conducted by telephone by Matthew Greenwald and Associates in the fall of 2019. Private sector employers were asked to evaluate the relative productivity and costs of older workers and whether on balance older employees or job candidates were more or less attractive than their younger counterparts. The survey consisted of 25 questions, 15 pertaining to the characteristics of the employer and 10 asking how they viewed younger workers versus older workers, defined as those age 55 and older. Questions were asked separately regarding professionals and ‘support staff and production workers’. For brevity, we will refer sometimes to ‘support’ workers, but the survey combines both support and production workers, in contrast with professional workers.
The process produced 400 responses, and the responses were weighted using information on the state of the employers’ main location, firm size, and industry of operation:
 \begin{equation}{w_{i,s,f,j}} = \frac{{{t_{s,f,j}}}}{{{r_{s,f,j}}}}\end{equation}
where  ${t_{s,f,j}}$ indicates the share for firms in state s, with firm size f, in industry j, that would have been present had all firms responded, and
 ${r_{s,f,j}}$ is the actual response rate.Footnote 15 This type of non-response weighting addresses bias among the type of firms responding along the dimensions of state, firm size, and industry (e.g., firms in manufacturing respond more often than firms in finance).
Descriptive results. The results of the survey indicate that employers view older workers as ‘equally’ or ‘more’ productive than younger workers, but they also see them as expensive. It appears, however, that the higher costs and solid productivity assessment balance out, so that most employers view older workers as ‘equally’ or ‘more’ attractive than younger workers. Taken at face value, the survey suggests a relatively positive environment for older workers. The question, of course, is whether employers are providing their true opinions or whether they are simply offering ‘politically correct’ responses. Looking more closely at employer answers to questions on productivity, costs, and overall attractiveness reveals reasonable patterns of preference, suggesting that the survey results may well be meaningful.
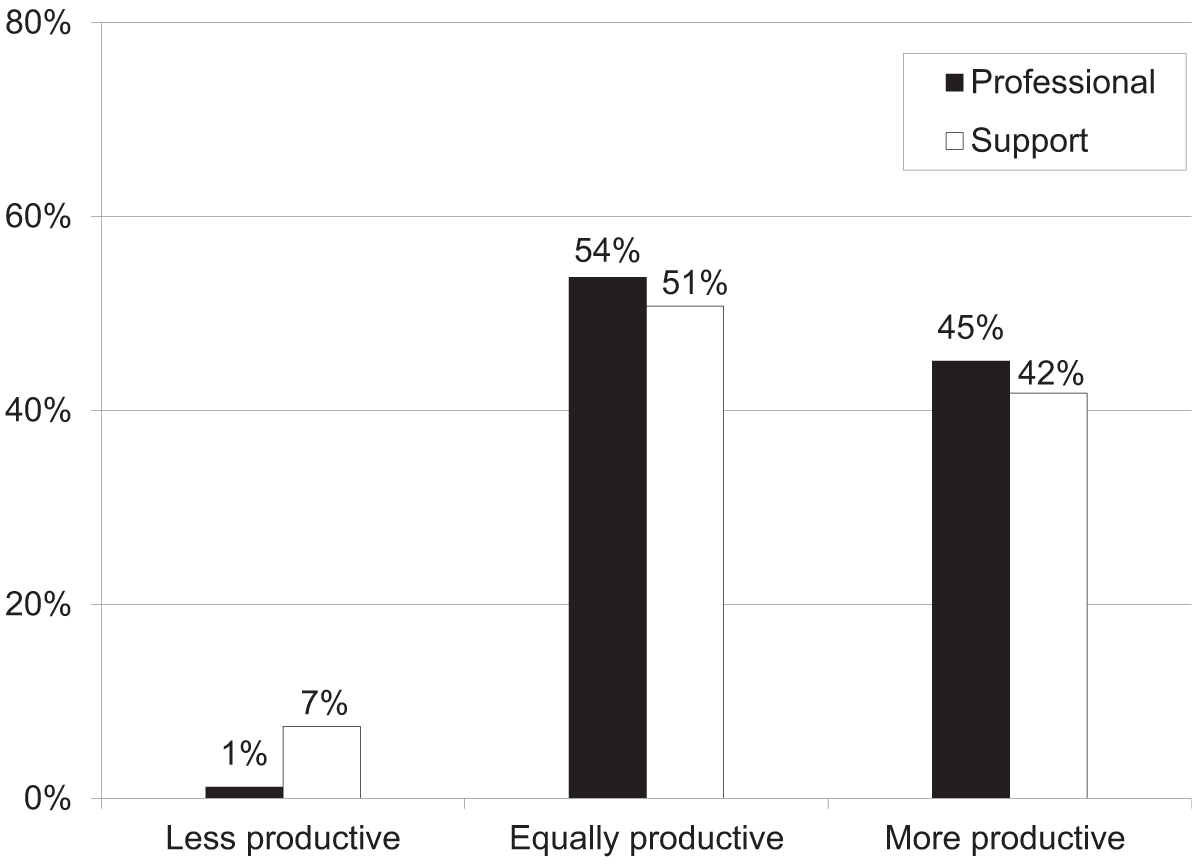
Productivity. The good news is that very few employers said workers ages 55 and over are ‘less productive’ than their younger counterparts (see Figure 2).Footnote 16 Slightly more than half see no clear differences in productivity between older and younger workers, both for professional and support workers. Of the responses indicating a preference for some age group, the vast majority suggest a preference for older workers, with 45 percent saying older professional workers are more productive versus 1 percent saying they are less productive, and with a similarly lopsided 42 to 7 percent split regarding support workers.
Employer evaluations of the relative productivity of older workers, 2019.

Table 1 presents, by five characteristics, the percentage of employers that characterize older workers as ‘more’, ‘equally’, and ‘less’ productive – the percentages are reported separately for professional and support workers. The first characteristic is the age of the respondent – that is, whether the person answering the survey is age 55 or over. One would expect that older respondents would view older workers more favorably and indeed that was the finding in the 2006 survey. In this survey, however, respondents ages 55 and over do not have a more positive view of the productivity of workers in their own age group. This lack of enthusiasm by older respondents for older workers is particularly pronounced for support workers.
Percentage of employers characterizing older workers as ‘more’, ‘equally’, or ‘less’ productive by characteristic

Table 1 Long description
Employer ratings compare workers ages 55 and older with younger workers in similar jobs, split into professional and support positions and broken out by employer characteristics. For professional roles, older workers are most often rated equally productive, ranging from 40 to 78 percent across subgroups, while “more productive” ranges from 21 to 59 percent and “less productive” is about 0 to 2 percent. Higher shares saying “more productive” for professional roles appear among employers with 15 percent or more of the workforce age 55 and older (59 percent) and among the largest employers with 1,000 or more employees (58 percent). For support roles, “equally” remains the most common response at 39 to 72 percent, while “more productive” ranges from 21 to 54 percent. “Less productive” is more common for support than professional roles, ranging from 2 to 19 percent, and is highest among employers with respondents under age 55 (17 percent) and among employers with under 15 percent of the workforce age 55 and older (19 percent). Overall, the pattern across categories is that negative assessments are rare, especially for professional positions, and percentages may not total 100 due to rounding.
Notes: Shares refer to employers responding with ‘more’, ‘equally’, or ‘less’ to the question ‘Overall, would you say that employees ages 55 or older in [professional/support and production] positions are more or less productive than younger workers doing similar jobs?’ Percentages may not add up to 100% due to rounding.
Source: Center for Retirement Research at Boston College, Survey of Employer Attitudes towards Older Workers (2019).
The second characteristic is the percentage of the employer’s labor force that is 55 and over. As one might expect, employers with an older workforce (more than 15 percent ages 55 or over) view older workers as ‘more productive’ than younger workers. This pattern is consistent with either firms employing more older workers – through either hiring or retention – when these workers are particularly productive at the firm or with firms that are more familiar with older workers having a more positive opinion of their capabilities.
The third characteristic of the employer is industry. Here the results are consistent with expectations. Older workers are often cited for their ability to interact with customers, so their ranking is indeed higher for employers in services rather than goods-producing industries.
The fourth employer characteristic is firm size. The smaller firms (those with fewer than 100 employees) tend to give older employees the highest ratings. Larger firms are less enthusiastic, instead being much more likely to say older and younger workers are equally productive. Overall, fewer than 10 percent of firms of any size rate older workers as ‘less productive’ than younger workers in either professional or support groups. This pattern may reflect larger firms being more cautious about reporting any preferences among workers of different ages.
On the other hand, firms providing a defined benefit plan – the final employer characteristic – tend to place a relatively high value on the productivity of older workers, particularly professional ones. This positive relationship is consistent with a situation where only the firms most interested in retaining older workers continue to provide a defined benefit plan in 2019.
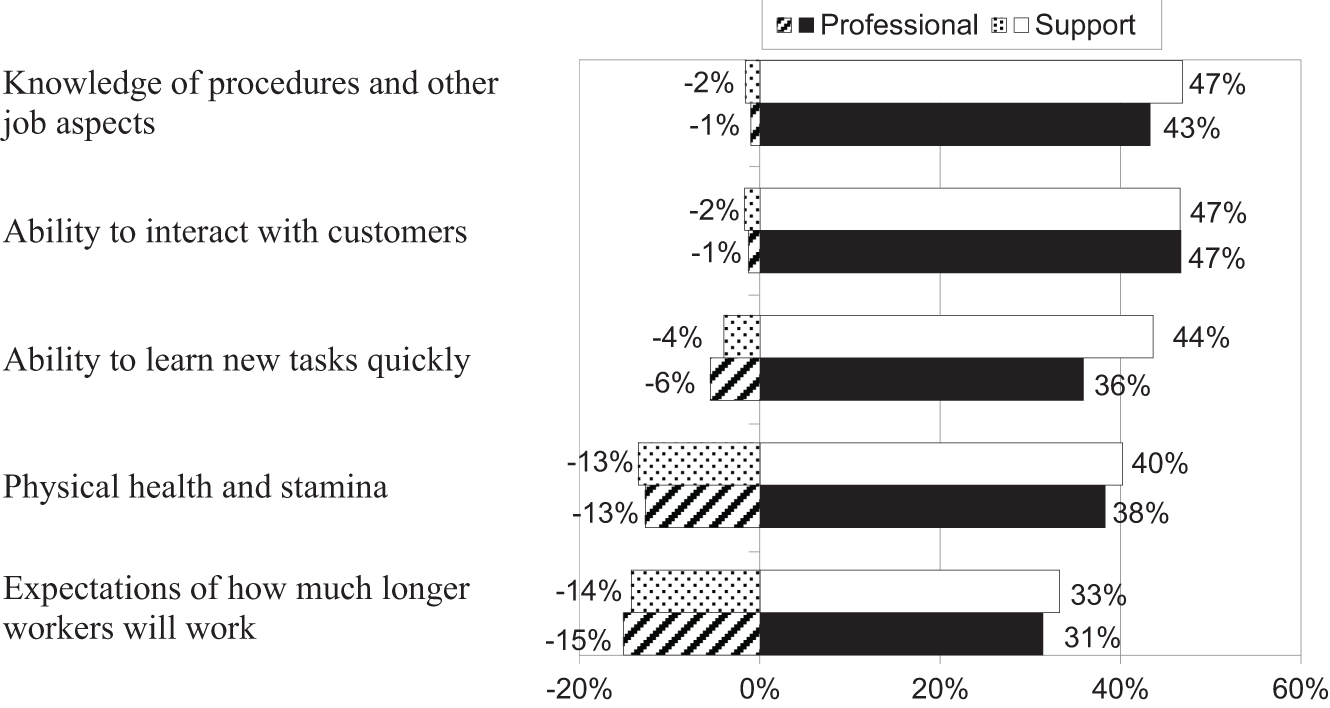
The survey also asked employers about the impact of various characteristics that could affect the productivity of older workers (see Figure 3). Specifically, employers were asked ‘Thinking only of “older” employees, would you say that the following factor has a positive or negative impact on the productivity of employees ages 55 or older?’ They were not asked to compare older and younger workers on the basis of these characteristics, but rather simply assess whether the characteristic has a positive or negative impact. The characteristics most frequently cited as advantageous, for both professional and support workers, are ‘knowledge of procedures and other aspects of the job’ and ‘the ability to interact with customers’, precisely the strengths of older employees cited in the psychological literature.Footnote 17 The least advantageous characteristics are concerns about ‘physical health and stamina’ and ‘expectations of how much longer they will be working’.
Percentage of employers citing various factors as having positive or negative impact on older worker productivity, 2019.

Figure 3 Long description
Horizontal bar graph with two series in a legend: Professional and Support. The horizontal axis shows percent with labeled ticks at minus 20 percent, 0 percent, 20 percent, 40 percent and 60 percent. Five categories are listed on the vertical axis. Knowledge of procedures and other job aspects: Professional minus 2 percent and 47 percent; Support minus 1 percent and 43 percent. Ability to interact with customers: Professional minus 2 percent and 47 percent; Support minus 1 percent and 47 percent. Ability to learn new tasks quickly: Professional minus 4 percent and 44 percent; Support minus 6 percent and 36 percent. Physical health and stamina: Professional minus 13 percent and 40 percent; Support minus 13 percent and 38 percent. Expectations of how much longer workers will work: Professional minus 14 percent and 33 percent; Support minus 15 percent and 31 percent.
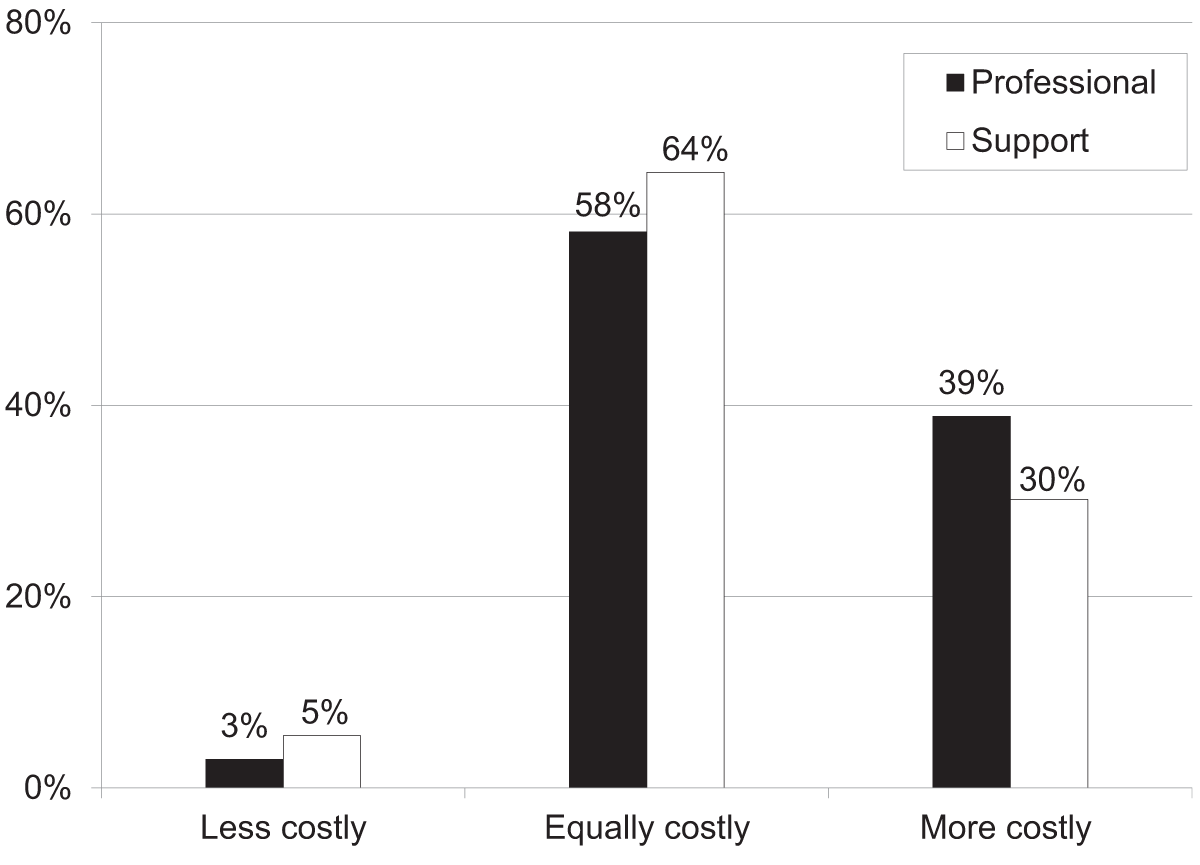
Costs of older workers. While employers tend to see older workers as ‘equally’ or ‘more’ productive than younger workers, they also see them as expensive. Roughly one-third said older workers are more expensive than someone younger, while only about 5 percent said they cost less. The pattern was much the same for professional and for support workers (see Figure 4).
Employer evaluations of the relative cost of older workers, 2019.

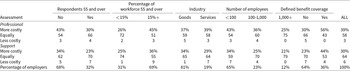
Evaluations of the relative cost of older workers also varied by employer characteristics (see Table 2). Familiarity with older workers – either through the respondent themselves being over age 55 or through having a large proportion of employees over age 55 – produced mixed results. While respondents ages 55 and over were less likely to say that workers their age are relatively expensive, a higher proportion of employers with an older workforce see older workers as more costly. Smaller employers are far more likely to see older workers – both professional and support – as relatively costly, and the assessment does not vary much across industry. Firms with defined benefit coverage, not surprisingly, view older workers as more costly.
Percentage of employers characterizing older workers as ‘more’, ‘equally’, or ‘less’ costly by characteristic

Table 2 Long description
Employers rated whether workers age 55 or older are more, equally, or less costly than younger workers in similar jobs, shown separately for professional and support and production positions and by employer characteristics. Overall, equal cost is the most common response: 58 percent for professional roles and 64 percent for support and production. In professional roles, 39 percent say older workers are more costly and 3 percent say less costly; in support and production, 30 percent say more costly and 6 percent say less costly. Professional roles show a strong size pattern: 56 percent of employers with fewer than 100 employees say older professionals are more costly, versus 25 percent among employers with 1,000 or more employees. For support and production, employers with 15 percent or more of their workforce age 55 or older report fewer “more costly” responses than those under 15 percent (23 percent versus 36 percent) and more “less costly” responses (7 percent versus 1 percent). Defined benefit coverage is associated with higher “more costly” responses in both role groups (professional 56 percent with coverage versus 30 percent without; support and production 44 percent with coverage versus 23 percent without). Percentages may not sum to 100 due to rounding, and results reflect only employers who chose one of the three cost categories.
Notes: Shares refer to employers responding with ‘more’, ‘equally’, or ‘less’ to the question ‘Overall, would you say that employees ages 55 or older in [professional/support and production] positions are more or less costly than younger workers doing similar jobs?’ Percentages may not add up to 100% due to rounding.
Source: Center for Retirement Research at Boston College, Survey of Employer Attitudes towards Older Workers (2019).
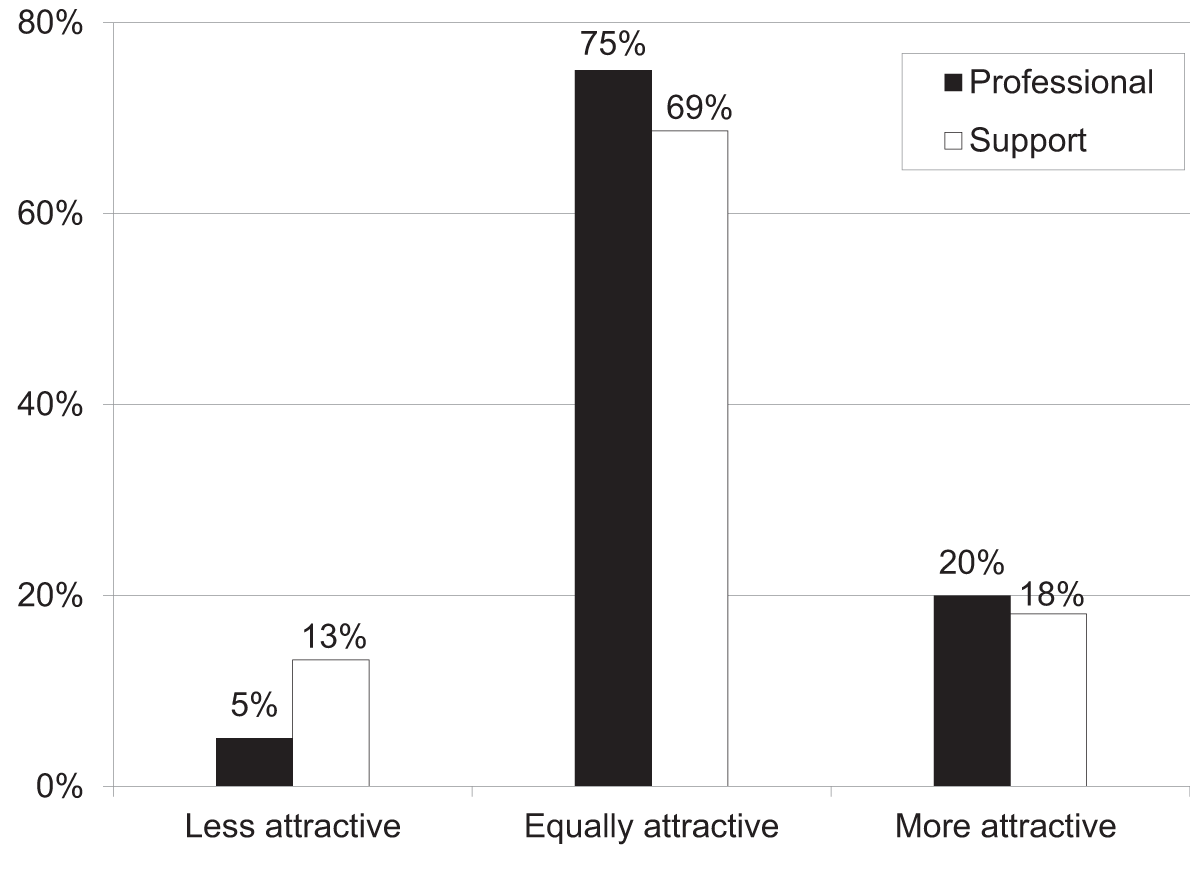
Overall attractiveness of older workers. The final question in the survey asked employers whether an ‘employee or prospect age 55 or older is generally more, the same, or less attractive compared with a younger person capable of the same job’. The assessment up to this point is that older workers are equally or more productive than younger workers, but that they are also more costly. The response to the ‘overall attractiveness’ question suggests that the greater productivity justifies the higher costs. Over two-thirds of the employers surveyed view older employees and younger employees as equally attractive (see Figure 5). This assessment is true for both professional and support workers. It is worth noting that some respondents may view older workers as equally attractive as younger workers only if they are equally capable.
Employer evaluations of the relative attractiveness of older workers, 2019.

The survey nevertheless suggests that professional workers have somewhat better prospects than support workers for extending their careers. One in five employers said older managers or professionals are ‘more attractive’ than someone younger, and only 5 percent said they are ‘less attractive’. By contrast, the gap between ‘more’ and ‘less attractive’ for older support workers is much narrower. The stronger position of professional workers seems based on differences in evaluations of relative productivity. Somewhat more employers reported an age-based productivity differential that favors older professional workers. But the perceptions of relative costs actually favor support, relative to professional, older workers. Thus, the perceived advantages of older professional workers’ productivity seem to outweigh their disadvantage on costs.
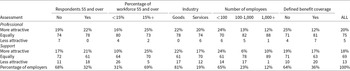
As in Tables 1 and 2, where questions concerned the relative productivity and cost of older versus younger workers, the perceived relative overall attractiveness of older workers varies by the characteristics of the employer (see Table 3). In terms of the age of the respondent, those 55 and older have a slightly better assessment of older professional workers (a group to which they belong), but this perception does not carry over to support workers. In contrast, employers with an older workforce are more attracted to older workers for both professional and support workers. In terms of industry and size, assessments vary little between goods and services, but larger employers are less likely to negatively rate older workers, especially support workers. Finally, defined benefit coverage has a somewhat negative impact on the attractiveness of older workers.
Percentage of employers characterizing older workers as ‘more’, ‘equally’, or ‘less’ attractive by characteristic

Table 3 Long description
Employer ratings compare workers age 55 and older with younger workers in similar jobs, split by job type (professional and support) and by employer characteristics such as share of older respondents, share of older workers, industry, firm size, and defined benefit coverage. Across nearly all groups, “equally attractive” is the dominant response: professional roles are mostly in the low to high 70s percent, and support roles are mostly in the low 60s to high 80s percent. For professional positions, “more attractive” ranges from 12 percent to 25 percent across subgroups, while “less attractive” is generally low, from 0 percent to 7 percent. For support positions, “more attractive” ranges from 6 percent to 25 percent, and “less attractive” varies more widely, from 1 percent up to 26 percent, with the highest “less attractive” among employers with under 15 percent of their workforce age 55 and older. Larger firms (1,000 or more employees) report especially high “equally attractive” shares for both professional and support roles, paired with very low “less attractive.” Employers with defined benefit coverage tend to report higher “less attractive” shares than those without, particularly for support roles. Percentages may not sum to 100 because of rounding.
Notes: Shares refer to employers responding with ‘more’, ‘equally’, or ‘less’ to the question ‘Overall, would you say that employees ages 55 or older in [professional/support and production] positions are more or less attractive than younger workers doing similar jobs?’ Percentages may not add up to 100% due to rounding.
Source: Center for Retirement Research at Boston College, Survey of Employer Attitudes towards Older Workers (2019).
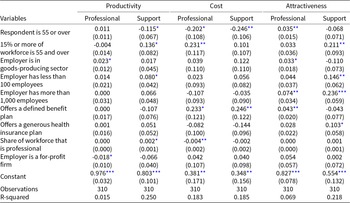
Regression results. To more thoroughly analyze what factors are associated with perceptions of older workers in 2019, ordinary least squares regressions are estimated to control for different employer characteristics as well as to test for statistical significance of any differences. The dependent variables are defined in Table 4.
Attributes used in regression analysis

Table 4 Long description
Regression analysis categorizes three attributes by which assessment level is included as the dependent-variable selection versus excluded. For productivity, the selected assessment is “equally or more productive,” while “less” is excluded. For cost, “more costly” is selected, and “equally or less” is excluded. For overall attractiveness, “equally or more attractive” is selected, while “less” is excluded. The pattern indicates the model treats higher-or-equal ratings as the included category for productivity and attractiveness, but treats higher cost as the included category for cost. The table lists category definitions only and does not provide counts, effect sizes, or statistical results.
That is, the regressions estimate the relationship between the employer characteristics and an assessment that older workers are as good or better than younger workers, depending on the characteristic: equally or more productive than younger workers, more costly than younger workers, and equally or more attractive than younger workers. The treatment of ‘costly’ differs, because being costly is a negative characteristic, so its complement is equally or less costly. These outcomes are estimated separately for professional and support workers. See Table 5.
OLS regression of employers’ attitudes on older workers’ productivity, cost, and overall attractiveness relative to younger workers, by employment type, 2019

Table 5 Long description
Regression results relate employer attitudes about older workers’ productivity, cost, and overall attractiveness (relative to younger workers) to respondent and firm characteristics, reported separately for professional and support jobs. Being age 55 or older is linked to lower cost ratings for older workers in both professional and support roles, and to lower attractiveness ratings in support roles; the productivity association is small and not statistically clear. Having at least 15 percent of the workforce age 55 or older is associated with higher cost ratings in professional roles and higher attractiveness ratings in support roles, with little change in professional productivity. Goods-producing employers show slightly higher productivity and attractiveness ratings for professional roles, while support-role attractiveness is lower and not statistically clear. Smaller employers (under 100 employees) are associated with higher support-role productivity and higher support-role attractiveness; very large employers (over 1,000 employees) are associated with higher attractiveness ratings in both roles, especially support. Offering a defined benefit plan is associated with higher cost ratings in both roles and higher professional-role attractiveness, while generous health insurance is linked to higher support-role attractiveness. Model fit varies by outcome and job type, with the weakest fit for professional productivity and stronger fit for support productivity and support attractiveness; coefficients should be read as associations, not causal effects.
Notes: Standard errors in parentheses.
*** at 99 percent,
** at 95 percent,
* at 90 percent.
Source: Center for Retirement Research at Boston College, Employers and Older Workers: CRR Survey Data (2019).
The regression results reveal four patterns, which are mostly consistent with the descriptive relationships described above.Footnote 18 First, the age of the respondent tends to matter, with respondents ages 55 and older holding more positive views of older professional workers. They view them as equally or more productive, equally or less costly, and equally or more attractive than younger workers. This favorable assessment, however, does not carry over to support workers.
Second, firms in which workers 55 and over comprise 15 percent or more of the workforce have a more positive view of older workers, particularly those in support positions. These views are driven by a perception that older support workers are more productive than their young counterparts, with no offsetting disadvantage in terms of higher cost. In contrast, older professional workers are viewed by such firms as even with younger workers in terms of productivity but significantly more costly, leading to an ambivalent view of their overall attractiveness.
Third, goods-producing firms display a preference for older professional, but not support, workers relative to service firms, a difference driven by positive views of older professional workers’ productivity. Firm size has a non-linear relationship with respect to their view of older workers. Small and large firms view older workers as more attractive than younger workers, relative to medium-size firms, with the magnitude and statistical significance greater for support than for professional workers.
Finally, firms offering defined benefit plans tend to view older workers as significantly more costly. However, they also view older professional workers as more attractive. One interpretation is that firms’ preferences for older professional workers lead them to offer defined benefit plans that retain such workers, even at the cost of extending such plans to support workers (who are not viewed as being more attractive when older).Footnote 19
Thus, overall, most firm characteristics are associated in predictable ways with preferences for older versus younger workers. The question that remains is whether attitudes have changed since the 2006 survey.
4. Comparison of the 2006 and 2019 results
Any comparison of a survey in 2006 with one in 2019 raises questions about how responses could be affected by changes in the nature of employers and older workers themselves and about the comparability of the data.
Changes in employer attitudes toward older workers, 2006 and 2019. Employer attitudes toward older workers could have changed for two major reasons: (1) a change in their concern about discriminating against older workers and (2) an increase in the age of managers, which might lead to a more favorable assessment of older workers (at least those in professional positions, as suggested by the results above).
Employers could have become more or less sensitive to lawsuits related to age discrimination over the period 2006–19. However, the trends in charges related to the Age Discrimination in Employment Act suggest employers should not be any more or less concerned about lawsuits today than in 2006. In 2006, 1,417 cases of age discrimination were either settled with payment to the plaintiff or resulted in a finding of ‘reasonable cause’ against the employer. That number was actually somewhat lower, at 1,288, in 2017, despite a slight increase in the actual number of cases filed against employers (EEOC, 2026). In other words, firms may be slightly more likely to face a charge, but simultaneously less likely to have to pay out money due to that charge.Footnote 20 While the exact effect of this trend on employer responses is unclear, the data do not suggest a sea change in how employers should view the risk of age discrimination charges.
What may be more salient to employers is any statement of preference for some types of workers versus others, particularly when the preference is based on a protected category such as age. Respondents’ greater caution might result in an increased prevalence of declining to say whether older workers are preferred or not, either through saying they are equal to younger workers or simply refusing to answer the question.
The second issue that could affect the views of employers is their own age. With the aging of the workforce, managers too have gotten older. The results of the early survey showed that older managers were more likely to value older workers, particularly professional workers. The results in 2019 qualify this pattern somewhat, but still find that it holds with respect to the professional worker group, of which respondents were themselves members.
Finally, since the 2006 survey was conducted, the relative attractiveness of older workers should have increased. They increasingly look like younger workers in terms of health status, education level, and fluency with technology. Younger workers’ proficiency with complex technology may itself have declined as technology has grown more user-friendly. Moreover, cost differences between older and younger workers should have declined as fewer and fewer workers are covered by defined benefit plans.
Comparability of the data. The goal of the 2019 survey was to replicate the original 2006 survey as closely as possible – including using the same survey firm, asking the same questions, and making only small adjustments to the sampling frame to gather more information. One difference between the two surveys is the data available for re-weighting. While state, industry, and firm size are available for 2019, only industry and firm size were available for the 2006 survey. Thus, while state information is used for weighting the reported 2019 results, only industry and firm size are employed for the comparison of the two surveys. The results differ a bit depending on the weights employed, but using the most information available for 2019 provides the best picture of the current views of employers and using the more limited weights provides the best basis for a comparison. Therefore, the following results are weighted by firm size and industry, but not state. Consequently, numbers in the following figures and tables are slightly different than corresponding numbers in the previous section.
Comparison of surveys. Two interesting points of comparison emerge from the 2006 and 2019 surveys. First, a straightforward accounting of the results shows a much higher prevalence of ambiguous answers and generally a more favorable assessment of older workers than the 2006 survey. Second, a regression including both the 2006 and 2019 surveys confirms the major differences between the two surveys.
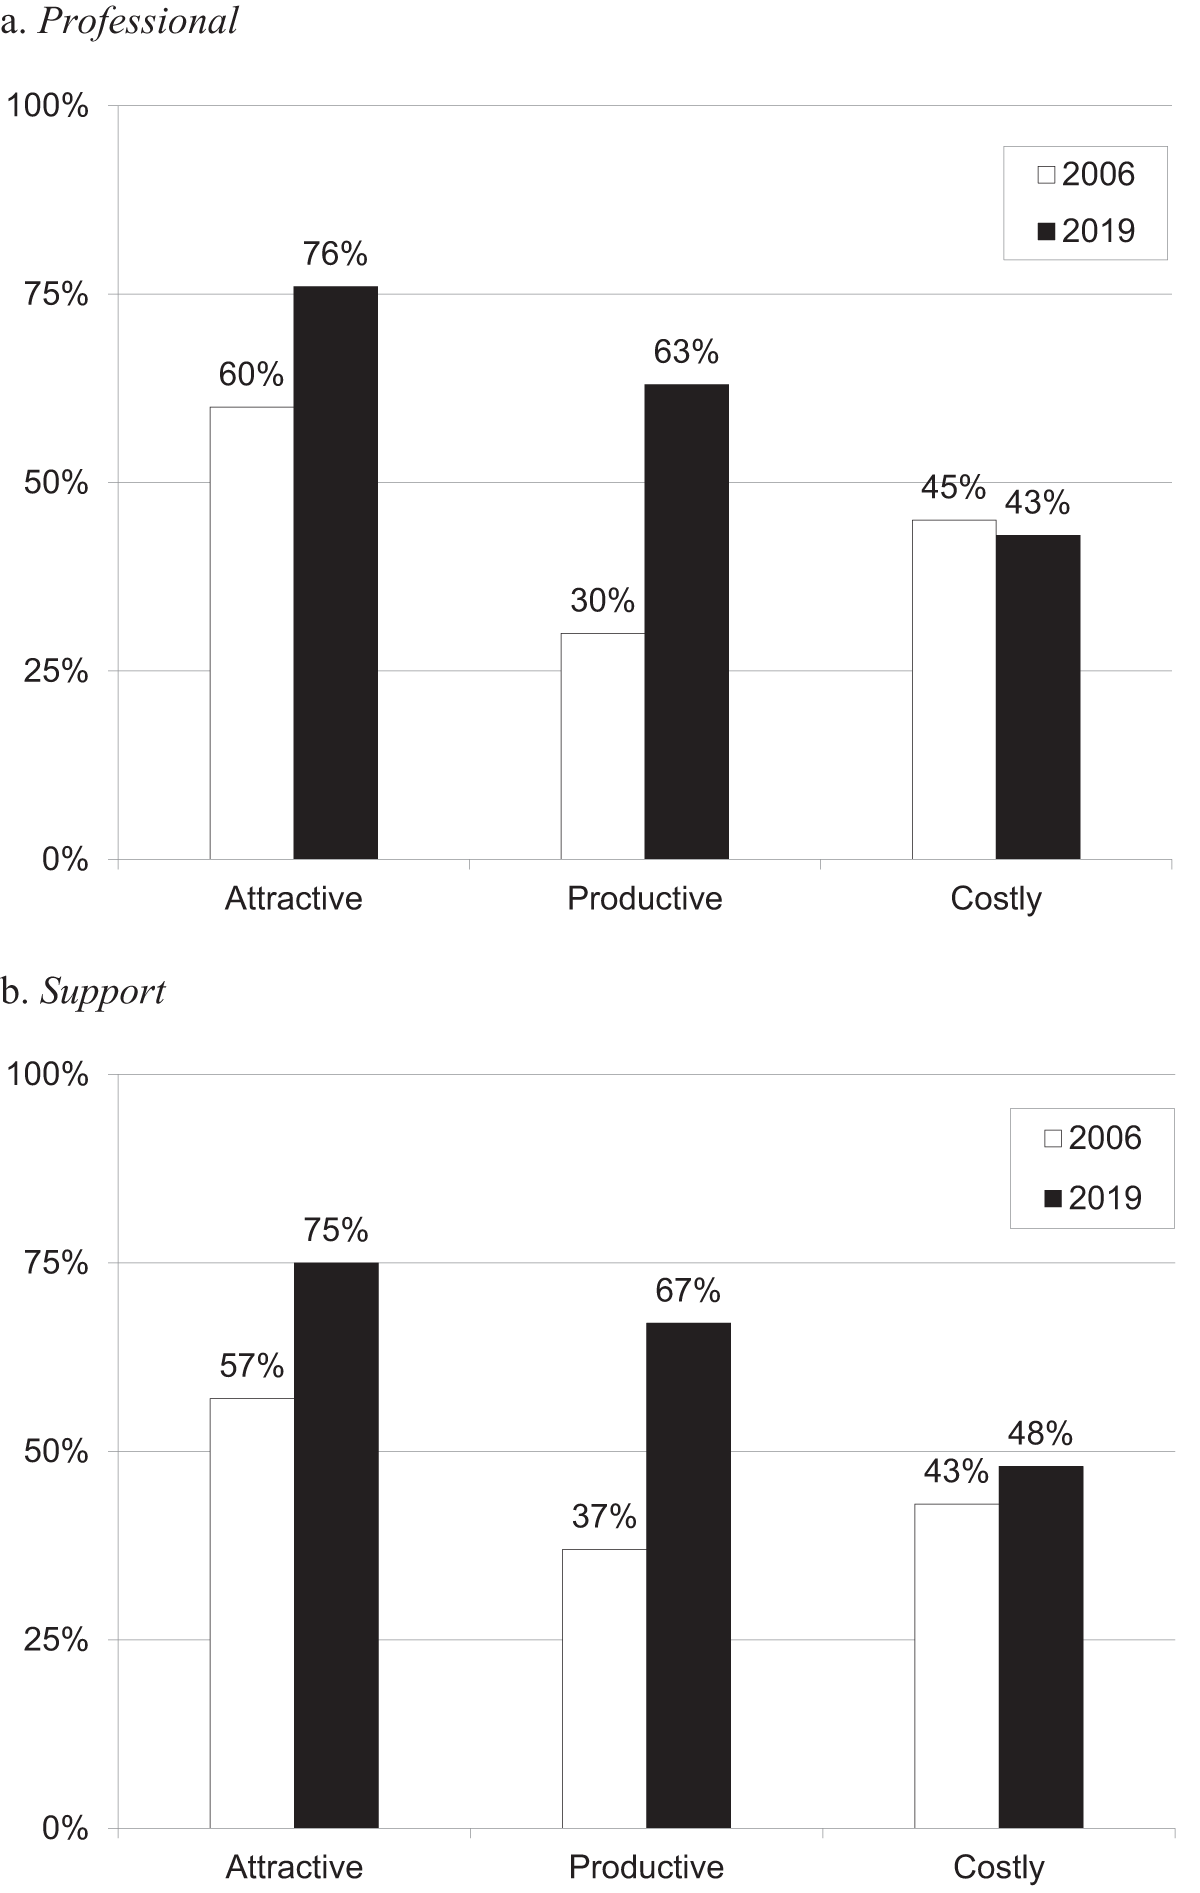
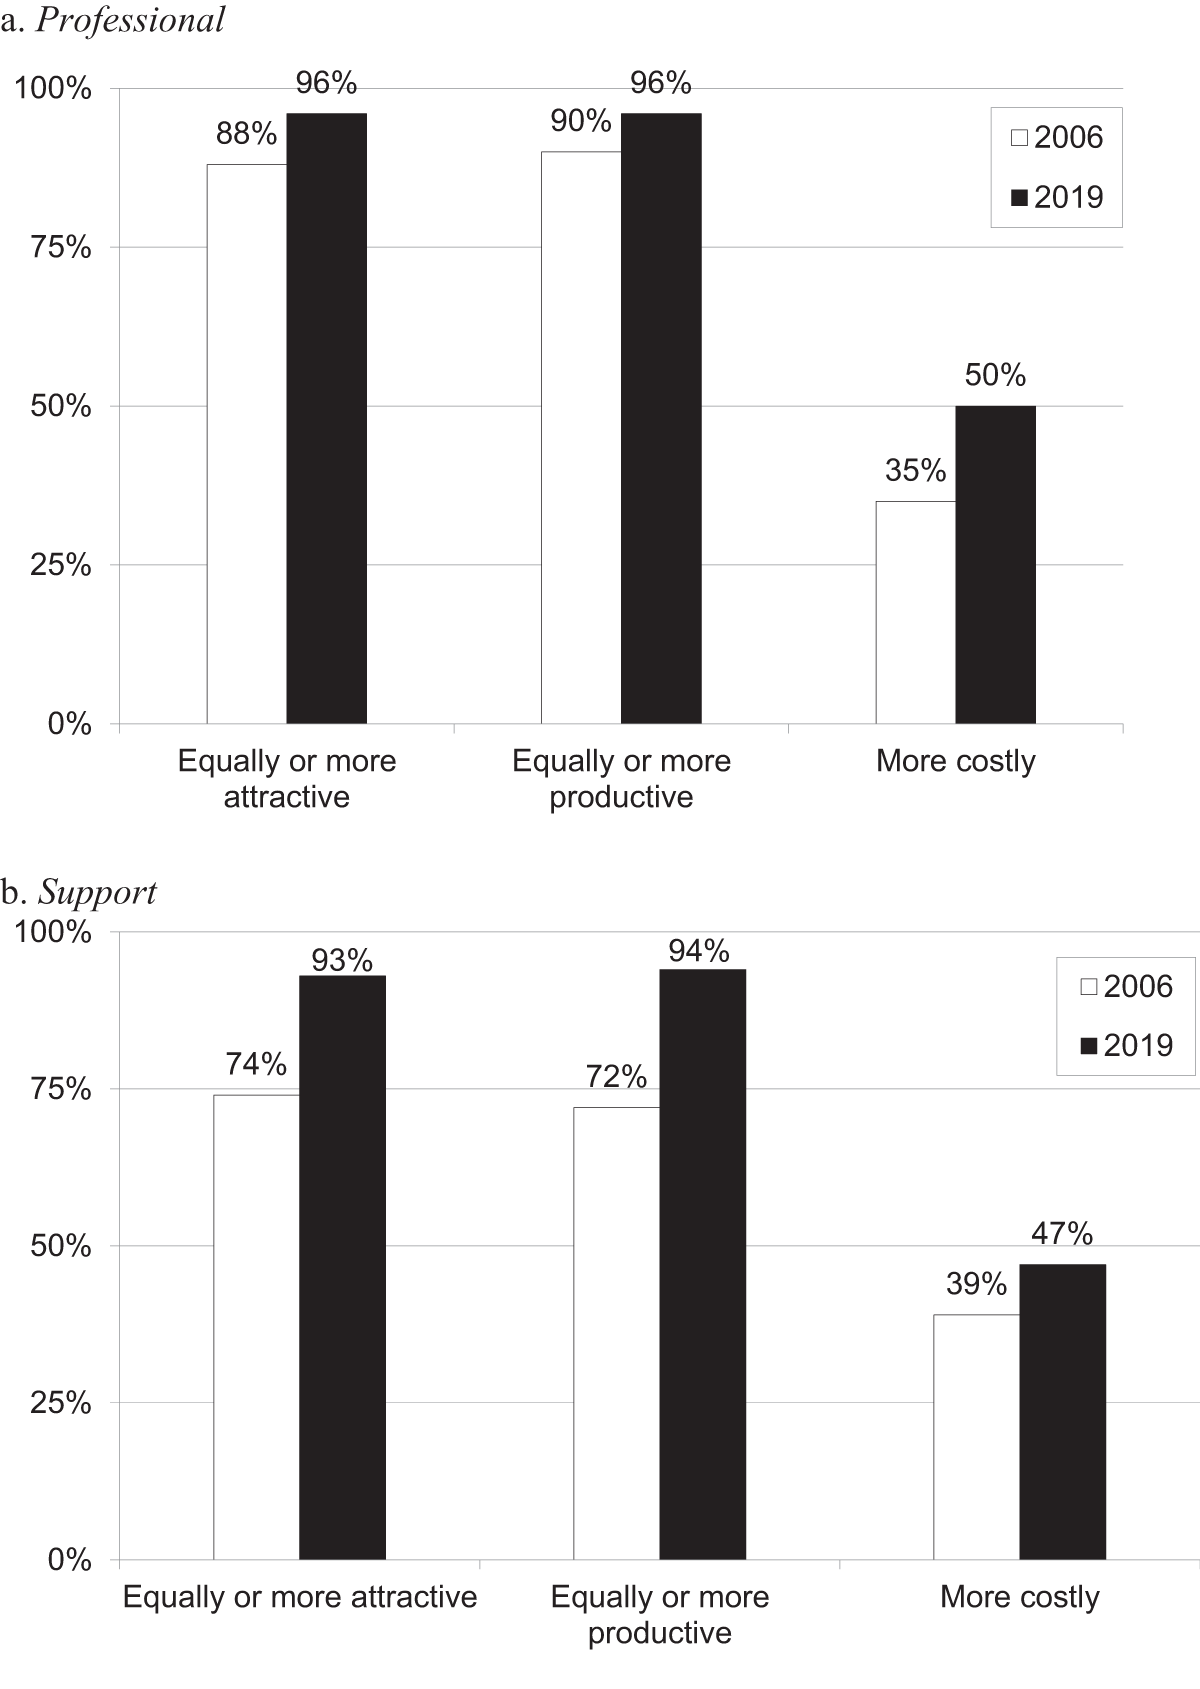
Overall results. The most straightforward way of comparing the results is simply to look at how employers classify older workers in terms of productivity, costs, and attractiveness. Two strong patterns emerge. The first is the higher incidence of ambiguous answers. That is, the percentage of employers characterizing older workers as equal to younger workers in terms of attractiveness and productivity increased substantially between 2006 and 2019 (see Figure 6). The percentages for cost remained relatively unchanged. The second pattern is the improved assessment of older workers. Employers in the 2019 survey found older workers equally or more attractive and productive than younger workers, despite viewing them as somewhat more costly (see Figure 7). The improved assessment of both productivity and overall attractiveness was particularly notable for support workers.
Percentage of firms classifying older workers as equally attractive, productive, and costly as younger workers, 2006 and 2019, professional and support.

Figure 6 Long description
Bar graph titled a dot Professional. Legend: 2006 and 2019. Horizontal axis categories: Attractive, Productive, Costly. Vertical axis label: percent. Vertical axis range: 0 percent to 100 percent, with labeled ticks at 0 percent, 25 percent, 50 percent, 75 percent, 100 percent. Values: Attractive 2006 equals 60 percent, 2019 equals 76 percent. Productive 2006 equals 30 percent, 2019 equals 63 percent. Costly 2006 equals 45 percent, 2019 equals 43 percent. Bar graph titled b dot Support. Legend: 2006 and 2019. Horizontal axis categories: Attractive, Productive, Costly. Vertical axis label: percent. Vertical axis range: 0 percent to 100 percent, with labeled ticks at 0 percent, 25 percent, 50 percent, 75 percent, 100 percent. Values: Attractive 2006 equals 57 percent, 2019 equals 75 percent. Productive 2006 equals 37 percent, 2019 equals 67 percent. Costly 2006 equals 43 percent, 2019 equals 48 percent.
Percentage of firms classifying older workers as equally or more attractive, productive, and costly than younger workers, 2006 and 2019, professional and support.

Figure 7 Long description
Bar graph labeled “a. Professional”. Legend: 2006 and 2019. The horizontal axis categories are “Equally or more attractive”, “Equally or more productive” and “More costly”. The vertical axis shows percent from 0 percent to 100 percent, with labeled ticks at 0 percent, 25 percent, 50 percent, 75 percent and 100 percent. Values shown above bars: Equally or more attractive: 2006 equals 88 percent, 2019 equals 96 percent. Equally or more productive: 2006 equals 90 percent, 2019 equals 96 percent. More costly: 2006 equals 35 percent, 2019 equals 50 percent. Bar graph labeled “b. Support”. Legend: 2006 and 2019. The horizontal axis categories are “Equally or more attractive”, “Equally or more productive” and “More costly”. The vertical axis shows percent from 0 percent to 100 percent, with labeled ticks at 0 percent, 25 percent, 50 percent, 75 percent and 100 percent. Values shown above bars: Equally or more attractive: 2006 equals 74 percent, 2019 equals 93 percent. Equally or more productive: 2006 equals 72 percent, 2019 equals 94 percent. More costly: 2006 equals 39 percent, 2019 equals 47 percent.
Regression results. The second way of comparing the two samples is using a regression framework. The composition of the sample of employers and respondents will naturally differ between the two surveys. While perhaps random, these differences have the potential to affect the time-trend analysis – for example, the early survey found that older respondents found older workers more valuable, so if the new sample is older or younger, it would affect the result. A regression framework can standardize for such variability in order to isolate the time trend:
 \begin{equation}\,\,\,\,\,\,\,\,\,\,\,\,\,{R_i} = {\beta _0} + {\beta _1}I\left( {Survey = 2019} \right) + X{'_i}\beta + {\varepsilon _i}\end{equation}
where the dependent variable  ${R_i}$ is a binary response (e.g., older workers in professional positions are on balance equally or more attractive than younger ones),
 $I\left( {{\text{Survey}} = 2019} \right)$ would indicate the respondent was participating in the 2019 survey, and
 $X{'_i}$ would be a vector of characteristics of employer/respondent such as age and industry. The interpretation of
 ${\beta _1}$ is then simply the difference between the original survey and the current one for an otherwise similar employer/respondent.
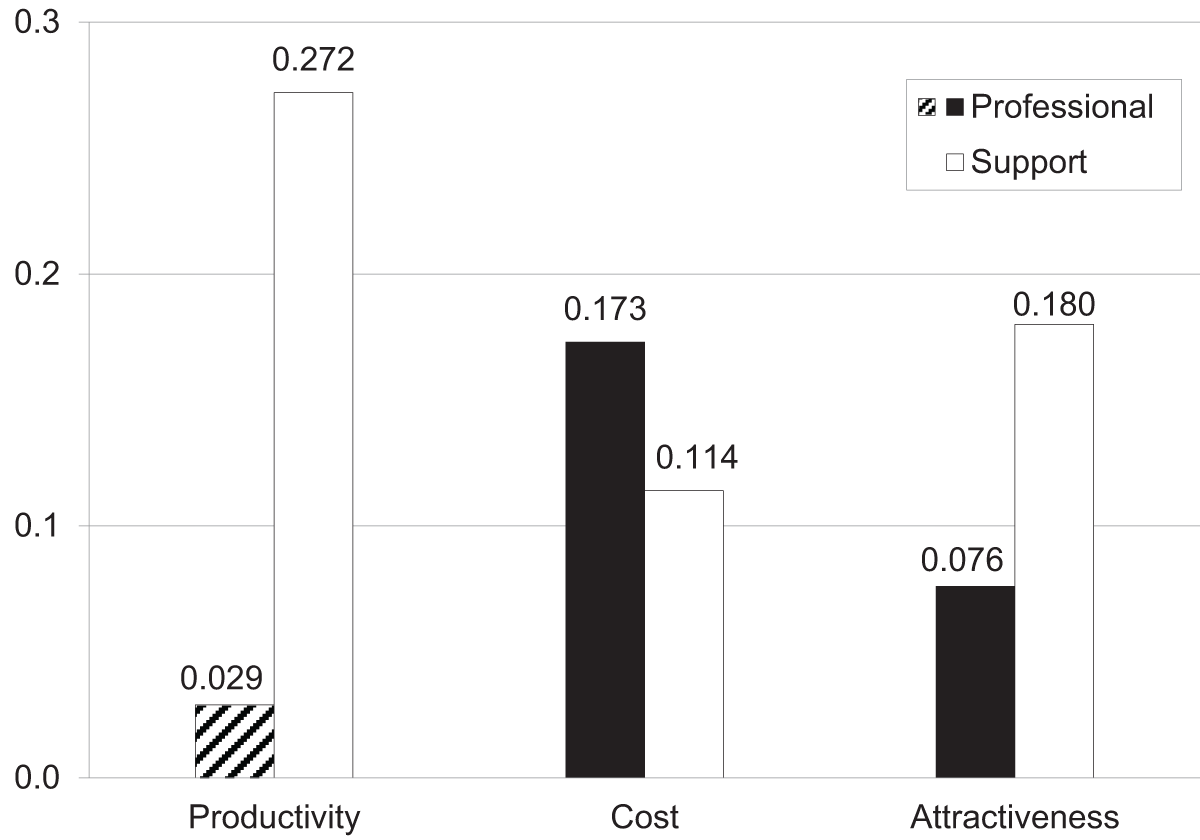
Figure 8 reports the results for the survey-year variable, the impact of being a respondent in 2019, with other firm characteristics controlled for.Footnote 21
Change in perceptions of older versus younger workers by group, 2006–19.

As indicated by the evidence above, the main differences across the two waves of the survey are primarily with respect to views of support workers. Employer assessments of the productivity of these workers increased substantially and more than offset their perceived cost, resulting in a large improvement in the attractiveness of older support workers overall. For professional workers, firms reported a perceived increase in cost and no significant increase in productivity, yet the overall attractiveness improved – albeit by substantially less than for support workers.
It is worth noting that the improvement in views of support workers is driven mostly by a decline in negative views of productivity. Two interpretations of this pattern suggest themselves. The first is that the pattern is consistent with the anecdotal increase in ‘political correctness’ and caution about stating any age-based preference. A more optimistic read of these results takes them at face value and suggests that older and younger workers are truly viewed as more equal than they were 13 years ago. This change would be consistent with the objectively more similar qualifications of older and younger workers.
5. Conclusion
The key result of the 2019 survey of 400 employers is that older workers have reasonably good prospects for extending their working careers. Although older workers are seen as more costly, they are also seen as more productive. The overwhelming majority of employers said older workers were ‘as attractive’ or ‘more attractive’ than a younger employee or prospect. The big news that emerges when comparing the 2019 results with those for 2006 is the improvement in employer perceptions of support workers.
It is always difficult to know how much weight to put on survey results. The key question is the extent to which employer attitudes, which the survey measures, impact actual personnel decisions. Other employer surveys have recorded similar positive evaluations of the productivity of older workers, yet numerous studies have documented discrimination against older workers not only in the hiring process but also in terms of retention. Some of the reasons our findings may differ from prior work are that discrimination may vary at different stages in the hiring process: audit studies may find discrimination at early stages of selecting interview candidates, while prospective older hires who make it past that stage – or, indeed, older current workers – may benefit from a greater awareness on the part of employers of their relative strengths. Some of our results do speak to the fact that familiarity with older workers may improve employer views of their attractiveness as employees. Of course, if part of what makes older workers effective at their jobs is firm-specific human capital, they may be less productive at a new employer if they do change jobs, possibly playing a role in the difficulty older workers face in finding new jobs following a layoff (e.g., Braxton and Taska, Reference Braxton and Taska2023; Azadikhah Jahromi and Callaway, Reference Azadikhah Jahromi and Callaway2022).
Thus, the survey paints a reasonably optimistic picture. The overwhelming majority of employers said older workers were at least as attractive as younger employees. It will not always be easy for older workers to extend their working careers. But the survey suggests that the potential exists. Indeed, recent trends in retirement ages suggest that longer careers are, in fact, being both sought by workers and made possible by employers (albeit leaving room for employers to further cater to later preferred retirement ages, Deshoande et al., Reference Deshoande, Fadlon and Gray2024).



 Open access

