Introduction
Semiconductors have small energy gaps and, in their pure state, are poor conductors and poor insulators. Their magnificent properties have been achieved by functionalization using n- and p-type dopants, leading to p–n junctions, transistors, junction lasers, light-emitting diodes, and an entire technological revolution. For the most part, other defects and impurities must be avoided or eliminated, except for special cases.
Graphene is a two-dimensional material with a unique energy-band structure in which the Fermi “surface” is just two nonequivalent points, called Dirac points, in the Brillouin zone. At nonzero temperatures, both electrons and holes have linear dispersion relations, that is, they behave as massless fermions, whereby their mobilities have unprecedentedly large values.
Pure graphene is not useful for practical applications because of its low carrier density, zero band gap, and chemical inertness. Similarly to semiconductors, however, it offers enormous promise through functionalization by dopants, impurities, and defects. The purpose of this article is to provide an overview of what has been learned so far about the nature and properties of defects, impurities, and the doping process. We also describe the role of such functionalization in practical applications. Whether functionalization will lead to revolutionary applications remains an open issue.
Defects, impurities, and doping
Lattice defects
Point defects and complexes
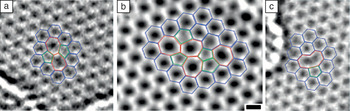
As in carbon nanotubes, the two-dimensional honeycomb lattice of graphene allows for the formation of lattice defects without the removal or addition of carbon atoms (Figure 1). The prototype of such defects is known as a Stone–Wales defect, in which a pair of atoms is rotated by 90° in the plane.Reference Meyer, Kisielowski, Erni, Rossell, Crommie and Zettl1 All atoms in such defects are three-fold-coordinated with no dangling bonds, so they are not very reactive. Because they have high formation energies, they are uncommon in as-grown graphene. Instead, they are encountered after graphene has been irradiated with energetic particle beams (see the later section “Radiation-induced defects”).
Defects imaged by transmission electron microscopy (TEM). Normal six-membered rings are highlighted in blue, five-membered rings in green, and rings with seven or more members in red. (a) Stone–Wales defect, (b) more complex Stone–Wales-like defect, (c) single vacancy. The scale bar in (b) represents 2 Å. Reproduced with permission from Reference 1. ©2008, American Chemical Society.

Vacancies and carbon interstitials (adatoms) and their agglomerates are also not favored in thermodynamic equilibration processes because of high formation energies (the terms interstitial and adatom are not clearly distinguishable in two-dimensional materials).Reference Banhart, Kotakoski and Krasheninnikov2 Nevertheless, they are created by nonequilibrium processes that often occur during either synthesis or irradiation. Even in small numbers, vacancies, interstitials, and complexes of such defects effect significant changes in the electronic, transport, and chemical properties of graphene.Reference Banhart, Kotakoski and Krasheninnikov2, Reference Peres, Guinea and Castro Neto3 More specifically, several such defects are highly reactive and can be used to functionalize graphene in different ways.
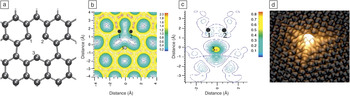
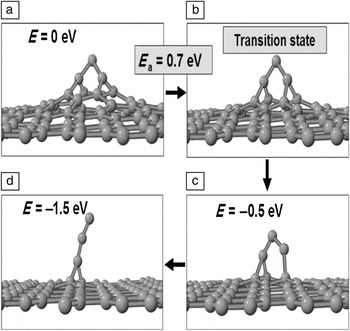
Removal of a carbon atom from a graphene sheet initially creates three two-fold-coordinated atoms (dangling bonds). Subsequent relaxation leads to the formation of a new carbon–carbon bond,Reference El-Barbary, Telling, Ewels, Heggie and Briddon4–Reference Yazyev and Helm7 whereas the third carbon atom remains two-fold-coordinated (Figures 1c and 2). On the other hand, single carbon adatoms on graphene relax to the bridge position (over the center of a carbon–carbon bond) as their lowest-energy configuration.Reference Lee, Kim and Tománek9, Reference Lehtinen, Foster, Ayuela, Krasheninnikov, Nordlund and Nieminen10 Both vacancies and adatoms have a strong tendency to form clusters that have characteristic geometries. In particular, formation of divacancies and multivacancies, amounting to small voids, entails rebonding so that all carbon atoms eventually resume three-fold coordination.Reference Kotakoski, Krasheninnikov, Kaiser and Meyer11 Similarly, diinterstitials are incorporated into the lattice, giving rise to complexes involving pentagons and hexagons, similar to Stone–Wales defects, without any dangling bonds.Reference Meyer, Kisielowski, Erni, Rossell, Crommie and Zettl1 Larger complexes of adatoms form hillocks or protrusions (Figure 3). Adatoms coalescing in the vicinity of vacancies can generate defects with nonhexagonal rings that buckle out of the plane (blisters).Reference Lusk and Carr8
(a) Schematic diagram of a vacancy in graphene; (b) the calculated electron density (e/Å3) around the vacancy; and (c) the spin density (e/Å3), which reflects the electron density of the dangling-bond state on the lower two-fold-coordinated atom. Parts (a)–(c) reproduced with permission from Reference 5. ©2004, Institute of Physics Publishing. (d) Atomically resolved scanning tunneling microscopy (STM) image of a vacancy in graphite in a field of normally bonded atoms. Part (d) reproduced with permission from Reference 8. ©2008, American Physical Society.

Simulated self-healing of hillocks on graphene: (a) initial configuration with a defect complex of three carbon interstitials in a capped-hillock formation, (c–d) protrusions containing three carbon interstitials, and (b) transition state for the transformation from structure (a) to structure (c). The final three-carbon-interstitial protrusion is mobile and can thus anneal out at graphene edges or adjacent materials. Reproduced with permission from Reference 12. ©2009, Elsevier.

The overall significance of defects for the properties of graphene depends on their postformation evolution and dynamics. Key issues are the stability and diffusivity of defect clusters. Whereas the diffusion barriers are prohibitively high for divacancies (7 eV)2 and multivacancies, they are low (1–2 eV) for certain adatom clusters.Reference Tsetseris and Pantelides12 Thus, vacancy clusters are immobile at practical temperatures (a few hundred degrees Celsius), whereas adatoms and adatom complexes can move easily even at low temperatures (100–200°C).
Such considerations are helpful in identifying the likely nature of residual defects after long annealing. Enhanced stability and low diffusivity suggest that the most likely residual defects are multivacancies and adatom pairs in the form of 7–5–5–7 hillocksReference Tsetseris and Pantelides12 (not to be confused with the planar Stone–Wales defect, which also includes two pentagons and two heptagons but has no extra atoms). In contrast, individual adatoms and protrusions with three carbon members self-heal by migrating to the edge of a graphene layer (Figure 3).Reference Tsetseris and Pantelides12 Given that some defect species are stable and immobile, it might, in principle, be possible to arrange them in an ordered fashion and create defect-based graphene superstructures. For example, 7–5–5–7 adatom pairs could form a line, an extended geometry first proposed for carbon nanotubes.Reference Sternberg, Curtiss, Gruen, Kedziora, Horner, Redfern and Zapol13
Theoretical calculations have led to a proposal for healing vacancies.Reference Wang and Pantelides14 When graphene is exposed to CO gas, a vacancy can catch a CO molecule, healing the vacancy but leaving a dangling oxygen atom. Subsequent or even simultaneous exposure to NO gas can remove the dangling oxygen atom by forming NO2molecules that desorb.
Line defects
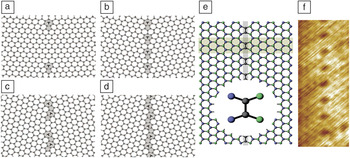
Grain boundaries are intrinsic line defects that are typically present in large-area graphene sheets produced by chemical vapor deposition (CVD) on a metal substrateReference Wintterlin and Bocquet15 or by epitaxial growth on SiC.Reference Varchon, Mallet, Magaud and Veuillen16 The structure of grain boundaries is determined by the in-plane tilt angle θ between adjacent grainsReference Yazyev and Louie17 (Figure 4). It consists of repeated pentagon/heptagon pairs and sometimes octagons, which act as dislocation cores and can be imaged using transmission electron microscopy and scanning tunneling microscopyReference Huang, Ruiz-Vargas, van der Zande, Whitney, Levendorf, Kevek, Garg, Alden, Hustedt, Zhu, Park, McEuen and Muller20–Reference Lahiri, Lin, Bozkurt, Oleynik and Batzill23 (see the article in this issue by Huang et al.). Often, grain boundaries are not straight but rather have a serpentine structure.Reference Huang, Ruiz-Vargas, van der Zande, Whitney, Levendorf, Kevek, Garg, Alden, Hustedt, Zhu, Park, McEuen and Muller20
Structures of grain boundaries in (a–b) zigzag-oriented and (c–d) armchair-oriented graphene sheets with varying tilt angles θ = (a) 5.5°, (b) 21.7°, (c) 15.8°, and (d) 28.7°. The heptagon–pentagon pairs constitute dislocation cores, denoted by “T” symbols whose stem represents the orientation of the added line of atoms. Parts (a)–(d) reproduced with permission from Reference 18. ©2010, American Association for the Advancement of Science. (e) Schematic diagram of a line defect in graphene, including an expanded view of the atomic structure, and (f) atomically resolved STM image of the line defect shown in panel (e). Parts (e) and (f) reproduced with permission from Reference 19. ©2011, American Physical Society.

Grain boundaries have unusual effects on mechanical properties: High-tilt-angle grain boundaries have no effect on graphene’s mechanical strength, whereas low-tilt-angle grain boundaries degrade strength. This effect has been explained as resulting from the ability of seven-membered carbon rings at large-angle grain boundaries to better accommodate strain that can produce rupture.Reference Grantab, Shenoy and Ruoff18
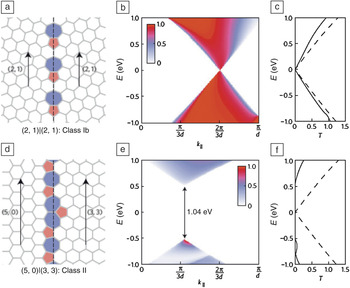
The effects of grain boundaries on carrier transport differ depending on the grain-boundary structure (Figure 5), resulting in a tunable mobility.Reference Yazyev and Louie24 In so-called class I grain boundaries, including all symmetrical grain boundaries, the projected periodicities of the lattice on each side match in a way that allows carriers to cross freely even at the Dirac point. In class II grain boundaries, no such momentum-conserving transmission is possible, except for carriers with much higher energy.
First-principles calculations suggest that electron transport through grain boundaries in graphene falls into two classes, depending on the orientations of the two grains relative to the boundary. (a) Atomic structure of a class I grain boundary (θ = 21.8°). (b) Transmission probability T through this class I grain boundary as a function of transverse momentum k ‖ and energy E, showing states with matching k ‖ values on both sides, even at the Dirac point. (c) Zero-bias total transmission per unit length through the class I grain boundary as a function of energy (solid line) compared to that of ideal graphene (dashed line). (d) Atomic structure of a class-II grain boundary (θ = 30°). (e–f) Corresponding k ‖-resolved and total carrier transmissions through the class II grain boundary, showing allowed transitions only at higher energy. Reproduced with permission from Reference 24. ©2010, Nature Publishing Group.

Grain boundaries also reduce carrier mobility because of enhanced scattering, impacting the use of graphene as a transparent conductor in large-area applications. The use of high-temperature and low-pressure CVD has been found to minimize the density of nuclei, yielding larger grains and higher mobilities.Reference Li, Magnuson, Venugopal, Tromp, Hannon, Vogel, Colombo and Ruoff25, Reference Günther, Dänhardt, Wang, Bocquet, Schmitt and Wintterlin26 Because the orientation of the grains is determined by interactions with the substrate, another ongoing effort to achieve larger grains is to use an alloy substrate (e.g., copper–nickel alloy) to tailor the interface binding.Reference Chen, Cai, Piner, Suk, Wu, Ren, Kang and Ruoff27
The interaction of point defects with grain boundaries has also been studied theoretically.Reference Wang, Puzyrev and Pantelides28 It was found that strained bonds at heptagons and pentagons at grain boundaries attract interstitials and vacancies, respectively. These point defects can recombine locally, whereby grain boundaries can efficiently anneal point defects.
In addition to grain boundaries, another line defect is possible: a kind of stacking fault, as shown in Figure 4e–f. This defect was found by theoretical calculations to act as a semitransparent “valley filter,” differentially scattering carriers from the two nonequivalent conduction-band valleys associated with the two Dirac points. Theoretical calculations indicate that carriers arriving at this line defect with a high angle of incidence are transmitted with a valley polarization near 100%.Reference Gunlycke and White19
Doping by impurities
Replacement of a carbon atom by boron or nitrogen shifts the Fermi level of graphene into the valence or conduction band, resulting in p- or n-type conduction, respectively. For low densities of boron or nitrogen impurities, transport remains essentially ballistic, whereas for higher densities, charge-carrier motion is diffusive with weak-localization effects present.Reference Lherbier, Blase, Niquet, Triozon and Roche29
In practice, the incorporation of substitutional dopant atoms into graphene is a challenge. Dopant incorporation can be achieved either during synthesis of graphene or after synthesis by implantation. For example, growth by CVD in ambient ammonia results in the incorporation of nitrogen atoms.Reference Wei, Liu, Wang, Zhang, Huang and Yu30 The process, however, also leads to the formation of pyridinic and pyrrolic nitrogen geometries. Likewise, implantation with dopants poses the subtle task of attaining substitutional configurations as the most prevalent residual defect.Reference Lehtinen, Kotakoski, Krasheninnikov, Tolvanen, Nordlund and Keinonen31 One possible solution for eliminating unwanted defects after doping is to use annealing in different ambient atmospheres (e.g., NH3, N2) in a postimplantation or postgrowth stage.Reference Guo, Liu, Chen, Zhu, Fang and Gong32
Theoretical calculations have led to a possible alternative method of incorporating substitutional nitrogen in graphene.Reference Wang and Pantelides14 If vacancies are first introduced by irradiation and then NO gas is introduced, NO molecules can be captured at the vacancies. Another NO molecule passing by can then remove the attached oxygen atom by forming NO2. The same process does not work as well if NH3is used instead of NO. The proposed scheme using vacancies and NO gas has not yet been tried in practice.
Doping by adsorbates
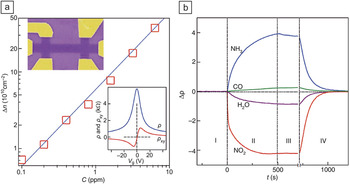
As shown in Figure 6a, when a single-layer graphene device is exposed to different concentrations of NO2 gas at room temperature, the number of charge carriers increases proportionally to the NO2 concentration. A change, Δρ, in the resistivity of graphene is observed when graphene is treated with several different gases (NO2, NH3, H2O, and CO), as shown in Figure 6b. It was found that NO2 and H2O treatments induce holes, whereas exposure to NH3 and CO ambients gives rise to electron doping. All of the devices recover their undoped state after annealing at 150°C in a vacuum (Figure 6b), suggesting that these molecules physisorb on the graphene surface. NO2 doping creates p-type graphene because the lowest unoccupied molecular orbital lies 0.3 eV below the Dirac point, whereby the Fermi energy is shifted down by 0.3 eV. Charge transfer per NO2molecule is minimal (∼0.1 electron).Reference Schedin, Geim, Morozov, Hill, Blake, Katsnelson and Novoselov33, Reference Leenaerts, Partoens and Peeters34
(a) Change in charge carrier density, Δn, in single-layer graphene exposed to different concentrations, C, of NO2. Insets show the gated Hall-bar structure (top; width = 1 μm) and the data used to deduce the density (bottom). V G, gate voltage; ρ, longitudinal resistivity; ρxy, transverse resistivity. (b) Changes in resistivity, Δρ, caused by exposing graphene to various gases diluted in concentration to 1 ppm. The positive (negative) sign of a change indicates electron (hole) doping. Region I, in a vacuum before its exposure; II, exposure to a diluted chemical; III, evacuation of the experimental setup; and IV, annealing at 150°C. Reproduced with permission from Reference 33. ©2007, Nature Publishing Group.

Doping of graphene nanoribbons
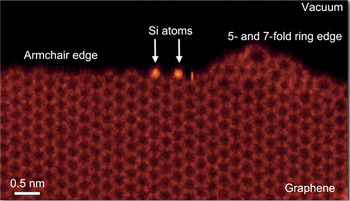
The task of substitutional doping becomes more complex for the graphene nanoribbons (GNRs) described in the introductory article in this issue. In this case, the effect of doping depends on the position of the dopants relative to the edges and the type of ribbon (e.g., width, edge morphology).Reference Biel, Triozon, Blase and Roche35, Reference Martins, Miwa, da Silva and Fazzio36 Edges are typically classified as zigzag or armchair, which is useful for calculations, but real edges can be more complex and can also contain uncontrolled impurities (Figure 7).Reference Zhou, Pennycook and Idrobo37
Z-contrast TEM image, in which brightness differences reflect differences in atomic number, of a real graphene edge, showing decoration by silicon atoms. Adapted from Reference 37.

Calculations have found that boron dopants at the edge of zigzag GNRs transform the GNRs into semiconductors, eliminating the characteristic peak near the Fermi level that is associated with edge states. Substitutional boron and nitrogen atoms in GNRs act as scattering centers, the strengths of which are different for up and down spin channels.Reference Biel, Triozon, Blase and Roche35, Reference Martins, Miwa, da Silva and Fazzio36
For certain concentrations and GNR widths, boron and nitrogen substitutional doping can lead to strong localization effects and a mobility gap of as much as 1 eV.Reference Biel, Triozon, Blase and Roche35 Edge doping of GNRs also results in modification of the antiferromagnetic state present in zigzag GNRsReference Cervantes-Sodi, Csányi, Piscanec and Ferrari38 and half-metallicity.Reference Wu, Wu and Zeng39 In addition, recent theoretical studiesReference Jiang, Turnbull, Lu, Boguslawski and Bernholc40 have shown that edge doping by nitrogen can create levels in the conduction band or in the bandgap of armchair GNRs.
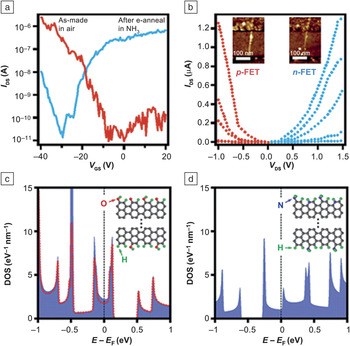
Recent experiments showed that electrothermal reactions in an ammonia ambient can turn graphene nanoribbons n-type.Reference Wang, Li, Zhang, Yoon, Weber, Wang, Guo and Dai41 The effect is shown clearly in the experimental current–voltage curves in Figure 8 and is corroborated by theoretical density-of-states results for certain types of nitrogen configurations at GNR edges. It should be noted, however, that the experimental capacitance–voltage data do not really exclude the possibility that other dopant structures, for example, physisorbed or chemisorbed ammonia-related configurations, might, in fact, be responsible for the n-type behavior of GNRs.
(a–b) Current–voltage characteristics for graphene-based field-effect transistors (FETs). The as-grown p-channel transistor behavior (red, V GS = –40 V, –37 V, –34 V, –31 V, and –28 V from top to bottom) is converted to n-channel behavior (blue, V GS = 40 V, 35 V, 30 V, 25 V, and 20 V from top to bottom) after electrothermal annealing (e-anneal) in ammonia. (c–d) Theoretical density of states (DOS) data for (c) oxygen-related and (d) nitrogen-related impurity configurations (insets) at the edge of a graphene nanoribbon. The calculated Fermi levels below and above the gap could account for the p-type and n-type doping in panels (a) and (b), respectively. The red dashed curve in (c) is the DOS projected onto the carbon backbone. Reproduced with permission from Reference 41. ©2009, American Association for the Advancement of Science.

Radiation-induced defects
Energetic beams of electrons, protons, and other particles introduce point defects such as vacancies for subsequent functionalization with impurities. If graphene is to be used in aerospace and defense electronics, one must investigate defects and defect reactions that can be induced by the unusual radiation environments encountered in these applications. Radiation-induced defect creation has been investigated by simulating the evolution of graphene when one atom acquires a certain recoil momentum.Reference Yazyev, Tavernelli, Rothlisberger and Helm42, Reference Kotakoski, Meyer, Kurasch, Santos-Cottin, Kaiser and Krasheninnikov43 In addition to vacancies and interstitials, it was found that Stone–Wales-type defects (Figure 1) and other intricate structures can form.
The direct interaction of a highly energetic proton with graphene has also been simulated by time-dependent density functional theory, yielding information on energy transfer as a function of impact parameter and proton energy.Reference Krasheninnikov, Miyamoto and Tomanek44, Reference Bubin, Wang, Pantelides and Varga45 Most of the energy (~99%) is transferred to electrons, which does not cause vacancy creation. The latter occurs only through a kick to a nucleus at very small impact parameter.
Unlike particle beams, x-rays cannot induce atomic displacements because they carry very small momentum, but they do generate large concentrations of electron–hole pairs. In silicon electronics, the main problem is in the gate dielectric, which contains hydrogen atoms bound at various sites that are released by holes. Both holes and hydrogen ions migrate to the interface, where they can depassivate defects or simply be captured as positive charge. Any graphene-based metal–oxide–semiconductor field-effect transistors (MOSFETs) are likely to suffer from similar or related processes.
Recent investigations of 10-keV x-ray- and ozone-exposure-induced defect formation in suspended graphene found a substantial increase in the resistance.Reference Zhang, Newaz, Wang, Bhandaru, Zhang, Fleetwood, Bolotin, Pantelides, Alles, Schrimpf, Weiss, Reed and Weller46 The charge-neutral point also shifts to higher voltages with increasing total dose. Similar behavior was found for graphene-on-SiO2. First-principles calculations of the relevant binding energies and of reaction and diffusion barriers led to the conclusion that oxygen adsorption and reactions can lead to the observed degradation.Reference Zhang, Newaz, Wang, Bhandaru, Zhang, Fleetwood, Bolotin, Pantelides, Alles, Schrimpf, Weiss, Reed and Weller46
Magnetic defects
Although early reports of defect-induced magnetism in graphene were controversial, recent experiments definitively settled the debate, showing that fluorine adatoms and vacancies, introduced in controllable ways in different samples, resulted in unambiguous paramagnetism, but no ferromagnetism.Reference Nair, Sepioni, Tsai, Lehtinen, Keinonen, Krasheninnikov, Thomson, Geim and Grigorieva47 These results are in agreement with the expectation that individual defects with unpaired electrons have a magnetic moment and the absence of a plausible mechanism for magnetic ordering.
For a fluorine adatom, the presence of an unpaired spin is obvious because fluorine has an odd number of electrons. In the case of a vacancy, magnetism has been attributed to the unpaired dangling bond (illustrated in Figure 2).Reference Ma, Lehtinen, Foster and Nieminen5 However, it is not clear how removing a carbon atom with an even number of electrons yields an unpaired electron. Where is the spin of the unpaired p z electron, which would ordinarily participate in the extended π-bonding network? Calculations by the authors indicated that the vacancy has a single unpaired electron because the absence of an energy gap allows half-filling of the highest-occupied orbitals. Thus, there are N + ½ spin-up electrons and N – ½ spin-down electrons. It follows that, if a gap is opened up by any means, a single unpaired spin would no longer be possible. Transition-metal atoms embedded at vacancies or divacancies in graphene exhibit unusual magnetic properties.Reference Krasheninnikov, Lehtinen, Foster, Pyykko and Nieminen48 An iron atom in a single vacancy is not magnetic, whereas a gold or copper atom in a single vacancy is magnetic. An iron atom in a divacancy, by contrast, has a high magnetic moment.
Just as defects can introduce magnetic moments, they can also disrupt existing magnetic ordering. For example, although theoretical calculations indicate that GNR edge states are spin-polarized,Reference Son, Cohen and Louie49 subsequent calculations found that defects suppress the magnetic ordering at the edges.Reference Jiang, Lu and Bernholc50
Functionalization by defects
In this section, we highlight the role of impurities and defects in functionalizing graphene for practical applications.
Electronic devices
The manipulation and control of impurities and defects are critical to using graphene for electronic devices. As in the case of semiconductors, one must intentionally introduce impurities to functionalize graphene in desirable ways and at the same time either avoid introducing or passivate undesirable defects. Dopants enhance the carrier density, but they also act as Coulomb scatterers that reduce carrier mobility. Nevertheless, experiments have shown that the carrier mobility in doped graphene remains high in comparison with values in semiconductors. The absence of an energy gap, however, means that a field-effect transistor made of graphene would always be “on.” This feature makes doped graphene unsuitable for logic applications, which require an off state and a large on/off ratio in the source–drain current. On the other hand, radio-frequency (RF) analog electronic devices, in which the gate voltage is alternating, do not require an off state. They are always on, and the source–drain current is modulated by the gate voltage.Reference Schwierz51, Reference Avouris52
Graphene electronic devices also face other challenges. For example, graphene and metals typically have different work functions, so that charge transfer inevitably occurs, creating a dipole layer that bends the graphene bands for some distance into the graphene channel. This unwanted “doping” amounts to a p–n-junction-like barrier that impedes transport.Reference Avouris52
Another challenge is the fabrication of gate stacks without large densities of interfacial defects, a problem that is familiar in efforts to fabricate field-effect transistors using semiconductors other than silicon. A good example is SiC, which has ideal properties for high-power, high-temperature devices, but defects at the SiC–SiO2 interface reduce the channel mobility to a small fraction of the bulk SiC carrier mobility. Partial passivation has been achieved,Reference Chung, Tin, Williams, McDonald, Di Ventra, Pantelides, Feldman and Weller53, Reference Wang, Dhar, Wang, Ahyi, Franceschetti, Williams, Feldman and Pantelides54 but the carrier mobility is still too low. It is no surprise, therefore, that defects at graphene–dielectric interfaces have been found to cause a large reduction of carrier mobilities in graphene,Reference Farmer, Chiu, Lin, Jenkins, Xia and Avouris55 although the nature of these defects and techniques for passivating them remain open issues. One promising option was recently demonstrated: use of BN layers as a substrate functioning as an insulator for back-gating.Reference Dean, Young, MericI, Lee, Wang, Sorgenfrei, Watanabe, Taniguchi, Kim, Shepard and Hone56 BN is an isomorph of graphite with a large energy gap (∼6 eV). The resulting channel mobilities are quite high (∼60,000 cm2 V–1 s–1 at a carrier density of ∼1 × 1012 cm–2 at 2 K, ∼40,000 cm2 V–1 s–1at room temperature). For applications, one typically needs both a substrate and a top gate, which inevitably leads to more mobility degradation.
Liquids with high dielectric constants have been found to enhance carrier mobilities significantly,Reference Newaz, Puzyrev, Wang, Pantelides and Bolotin57 but again, they are not likely to be practical for applications.
For logic applications, an energy gap is essential. Theory has shown that a pattern of adsorbates, such as hydrogen or oxygen, opens up an energy gap,Reference Sofo, Chaudhari and Barber58, Reference Boukhvalov and Katsnelson59 but the net result is really an altogether different material, no longer strictly two-dimensional. All of the same issues then arise as for other semiconductor films: a substrate and a gate dielectric with a small enough density of interface defects to yield acceptable mobilities.
Another way to introduce an energy gap in graphene is to use nanoribbons. The energy gap has been found to vary inversely with the GNR width, but acceptable values of the energy gap are obtained only in ultranarrow nanoribbons that present a technological challenge.Reference Son, Cohen and Louie60 An intriguing result was recently obtained using theoretical calculations: Boron impurities at GNR edges enlarge the energy gap, which shows promise for using wider nanoribbons.Reference Biel, Triozon, Blase and Roche35
As one ponders the potential use of graphene as an electronic device (see the article in this issue by Avouris and Xia), one must recognize that replacing silicon, as is often envisioned, is a very tall order. A single chip now has several billion transistors that are individually addressable using tens of kilometers of wire. Chips are made on 30-cm wafers, and 45-cm wafers are on the horizon, at enormous costs that would be recovered from higher throughput. To replace silicon, a technology based on a new material must achieve that level of integration at lower cost, an achievement that is extremely unlikely. As silicon technology is exploring alternative higher-mobility materials for the channel of a MOSFET, graphene is a potential candidate, but it must have an energy gap and must sustain high mobility when sandwiched between the substrate and a gate dielectric. Niche applications, where a particular material provides unique advantages, are, of course, always possible, but such applications for graphene have not yet been demonstrated.
Optoelectronic devices
Graphene is transparent to light, so it can be used as a transparent conductor in optoelectronic devices, including solar cells, potentially replacing indium tin oxide (ITO). Here again, graphene must be doped for it to have acceptable conductivity.Reference Blake, Brimicombe, Nair, Booth, Jiang, Schedin, Ponomarenko, Morozov, Gleeson, Hill, Geim and Novoselov61 An increase in conductivity, however, typically lowers transmittance. Calculations of sheet resistance versus transmittance suggest that graphene can compete with ITO and ultimately win because of its chemical stability and mechanical strength.Reference Bae, Kim, Lee, Xu, Park, Zheng, Balakrishnan, Lei, Ri Kim, Song, Kim, Kim, Ozyilmaz, Ahn, Hong and Iijima62 For large-area applications, however, growing single-crystal graphene is a technological challenge (see the articles in this issue by Nyakiti et al. and Bartelt and McCarty). Grain boundaries, which reduce conductivity, are inevitable.
Catalysis
In fuel cells, platinum is the material of choice for the oxygen reduction reaction (ORR), but it suffers from deactivation by CO. Pristine graphene cannot compete with platinum because it is chemically inert. Nitrogen-containing graphene (N-graphene), however, has been found to have about three times higher electrocatalytic activity than commercially available Pt/C electrodes.Reference Qu, Liu, Baek and Dai63 N-graphene also exhibits higher long-term stability against CO deactivation. Quantum mechanical calculationsReference Qu, Liu, Baek and Dai63 suggested and scanning tunneling microscopy imagesReference Zhao, He, Rim, Schiros, Kim, Zhou, Gutiérrez, Chockalingam, Arguello, Pálová, Nordlund, Hybertsen, Reichman, Heinz, Kim, Pinczuk, Flynn and Pasupathy64 confirmed that the enhanced chemical activity is due to charge localization around the nitrogen atoms. Experiments have also established that substitutional nitrogen exhibits a higher ORR activity than pyridinic nitrogen.Reference Niwa, Horiba, Harada, Oshima, Ikeda, Terakura, Ozaki and Miyata65
First-principles simulations have elucidated the underlying mechanism for this enhanced chemical activity of N-graphene.Reference Yu, Pan, Cao, Hu and Bao66 Basically, substituted nitrogen, because of its charge and spin redistribution, provides active binding sites for reactants and intermediates, which facilitates the ORR reaction. The nitrogen content can vary in a large range depending on the experimental procedure, providing the possibility to further enhance the chemical activity.
Graphene with defects can also be used to anchor active catalysts (see the article in this issue by Liu et al.). Platinum clusters on reduced graphene oxide show high catalytic reactivity for the methanol oxidation reaction compared to a commercially available Pt/C catalyst,Reference Yoo, Okata, Akita, Kohyama, Nakamura and Honma67 possibly because defects enhance the binding between metal and graphene, which inhibits the aggregation of metal nanoparticles. In such applications, graphene is mainly a template that provides a large surface area and various active binding sites. First-principles simulations suggest strong charge redistribution around the metal cluster induced by binding to the defects.Reference Zhou, Zhang, Dai, Zhang and Feng68
Nanoplasmonics
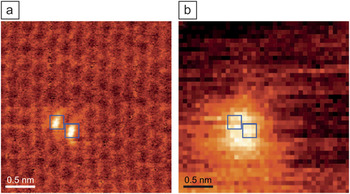
Impurity complexes, including complexes that involve intrinsic defects such as vacancies, are also known to occur. We mentioned earlier examples of nitrogen-containing complexes. It has been demonstrated that atom-by-atom imaging and chemical identification of impurities in graphene-like BN monolayers is possible.Reference Krivanek, Chisholm, Nicolosi, Pennycook, Corbin, Dellby, Murfitt, Own, Szilagyi, Oxley, Pantelides and Pennycook69 Recently, a defect consisting of two adjoining five-fold rings formed by the exchange of two carbon atoms for one silicon atom and a substitutional nitrogen atom bonded directly with the silicon atom was imaged directly using an aberration-corrected scanning transmission electron microscope (Figure 9).Reference Zhou, Lee, Nanda, Pantelides, Pennycook and Idrobo70 Simultaneous electron energy-loss spectroscopy (EELS) showed that the surface plasmon resonance of graphene was enhanced at this defect and at a pair of such defects. The results show that graphene containing particular defects could be used in the development of atomic-scale nanoplasmonics and quantum plasmonic devices. For example, a line of silicon impurities could act as a plasmonic wave guide.
(a) Z-contrast image of two adjacent substitutional silicon atoms in monolayer graphene. (b) Plasmon map obtained from electron energy-loss spectroscopy data in the 11–18 eV range. Reproduced with permission from Reference Reference Zhou, Lee, Nanda, Pantelides, Pennycook and Idrobo70. ©2012, Nature Publishing Group.

Summary
Graphene has many unique and unusual properties that make it an attractive material for many applications, including electronic and optoelectronic devices, catalysis, and nanoplasmonics. All such applications, however, depend on enhanced functionalization through the control of defects, impurities, and adsorbates. When semiconductors came on the scene in the 1940s, they led to truly revolutionary applications. It remains to be seen whether graphene will merely try to compete to replace other materials in known applications or lead to some truly revolutionary breakthroughs.
Acknowledgments
This work was supported in part by the DTRA Basic Research Program (Grant HDTRA1-10-1-0016), the Department of Energy Basic Energy Sciences, the Department of Energy (Grant DE-FG02-09ER46554), and the McMinn Endowment at Vanderbilt University. The authors thank A.V. Krasheninnikov for useful comments on the manuscript.