1. Introduction
Efficient inter-island transportation systems are crucial for the economic development of islands (Rutz and Coull, Reference Rutz and Coull1996). Short sea shipping (SSS) has traditionally served as the primary mode for island-mainland and inter-island connections (Mitropoulos et al., Reference Mitropoulos, Antypas and Kepaptsoglou2022; Tovar et al., Reference Tovar, Hernández and Rodríguez-Déniz2015). However, this waterborne transport mode faces weather-related reliability issues (Grifoll et al., Reference Grifoll, Osés and Castells2018; Suárez-Alemán et al., Reference Suárez-Alemán, Campos and Jiménez2014) and longer travel durations (Becker et al., Reference Becker, Burgess and Henstra2004; Bendall and Brooks, Reference Bendall and Brooks2011). Furthermore, SSS struggles to accommodate the rapidly growing demand for inter-island transportation. Over the past decade, China’s large-scale infrastructure initiatives have developed fixed inter-island links such as bridges and subsea tunnels, gradually replacing traditional waterborne transport. This transformation has significantly diminished SSS’s historical role in facilitating island connectivity while reshaping regional transportation systems. The emergence of multimodal alternatives presents challenges and opportunities: traditional SSS confronts inevitable market share reduction, whereas road transport gains new market potential. The precise magnitude and implications of these systemic changes remain underexplored and thereby constitute the central focus of our research.
In recent decades, the competitive dynamics between SSS and road transport have been extensively studied through multiple lenses. While SSS frequently operates as either a complementary or alternative mode to road transport, it also plays an essential role in overcoming geographical barriers and addressing critical mobility requirements (Morales-Fusco and Sauri, Reference Morales-Fusco and Sauri2009). Academic investigations reveal this complex relationship: Raza et al. (Reference Raza, Svanberg and Wiegmans2020) analyse modal shift patterns from road to maritime transport, whereas Sakib et al. (Reference Sakib, Appiotti, Magni, Maragno, Innocenti, Gissi and Musco2018) identify port infrastructure quality, accessibility standards and multimodal integration as crucial determinants for SSS’s potential dominance in land–sea passenger transport systems. Environmental comparative analyses further demonstrate SSS’s advantages in emission reduction compared to road alternatives (Vallejo-Pinto et al., Reference Vallejo-Pinto, Garcia-Alonso, Fernández and Mateo-Mantecón2019), with specific operational models such as pallet-based, short-haul shipping showing measurable atmospheric benefits over truck transportation (Brooks and Wilmsmeier, Reference Brooks and Wilmsmeier2017). These studies collectively illustrate an interdependent evolution where both modes simultaneously compete and complement each other within transportation networks. Notably, while infrastructure advancements predictably enhance road transport’s market share, SSS retains unique strategic value in specific operational contexts, ensuring its continued relevance within integrated transport systems.
Passenger mode selection typically involves multidimensional evaluations of travel time, transfer frequency, walking distance, costs, safety, comfort, service quality and environmental impact (Choocharukul and Van, Reference Choocharukul and Van2008; Dehghani et al., Reference Dehghani, Adury, Bradley and Gihring2002). Comparative analyses reveal modal trade-offs: while SSS demonstrates cost advantages, road transport maintains competitiveness through superior time efficiency, operational flexibility and reliability (Suárez-Alemán, Reference Suárez-Alemán2016). Empirical evidence further illustrates how perceptual differences shape modal preferences. Rigas (Reference Rigas2009) and Hillel et al. (Reference Hillel, Bierlaire, Elshafie and Jin2021) established that passengers’ perceived service disparities between SSS and air transport significantly influence mode choice. Although travellers are willing to pay premium prices for seamless door-to-door intermodal experiences, residential location emerges as a critical moderating factor (Efthymiou and Papatheodorou, Reference Efthymiou and Papatheodorou2015). Recent methodological advancements have enhanced understanding of spatiotemporal influences. Zhang et al. (Reference Zhang, Yang, Zhen, Lobsang and Li2021) identified how vulnerable spatiotemporal travel patterns and geographical constraints reconfigure transport preferences. Through analysing multi-day GPS datasets in Shanghai, Huang et al. (Reference Huang, Gao, Ni and Liu2021) demonstrated that travel chain structures systematically affect journey mode selection within origin–destination (OD) pairs. Despite these insights, critical research gaps persist. Current studies predominantly investigate mode choice through aggregate passenger preferences while neglecting individual heterogeneity’s moderating effects. Furthermore, existing methodologies frequently fail to holistically assess user experiences across entire journey chains, particularly regarding transfer convenience and multimodal integration quality.
The competition between SSS and road transport intensifies in island contexts where these modes dominate transportation networks (Moeckel et al., Reference Moeckel, Fussell and Donnelly2015). Hybrid quantitative–qualitative analyses reveal SSS’s operational synergies with road systems (Reis et al., Reference Reis, Fabian Meier, Pace and Palacin2013), while conditional logit models demonstrate SSS’s heightened cost sensitivity compared to road alternatives, with elasticity analyses suggesting ecotax policies could induce modal shifts (García-Menéndez et al., Reference García-Menéndez, Martínez-Zarzoso and De Miguel2004). Subsequent studies identify port accessibility, infrastructure quality and door-to-door distance as critical freight selection factors (García-Menéndez and Feo-Valero, Reference García-Menéndez and Feo-Valero2009), corroborated by multinomial logit (MNL) models confirming transport cost as the primary passenger mode determinant (Arencibia et al., Reference Arencibia, Feo-Valero, García-Menéndez and Román2015). Empirical validations range from Brisbane’s OD commuter mode comparisons quantifying ferry premiums (Tanko et al., Reference Tanko, Cheemarkurthy, Kihl and Garme2019) to logarithmic regression analyses of sustainable ferry operations (Tsoi et al., Reference Tsoi and Loo2021), yet cross-model comparisons remain absent. Current research bifurcates into micro-level individual characteristics and macro-level OD corridor constraints, while holistic assessments of transfer convenience and multimodal integration persist as gaps. Against this backdrop, Zhoushan – a pivotal Chinese archipelago undergoing bridge–tunnel infrastructure transitions – provides an ideal natural laboratory for applying logit-based formulations, conducting cost–time sensitivity analyses and evaluating SSS viability amidst emerging multimodal competition.
This study establishes three interconnected research objectives: (1) systematically analyse passenger mode selection dynamics between SSS and road transport through stated preference (SP) surveys employing anonymised questionnaires, identifying critical behavioural determinants; (2) operationalise advanced logit-based formulations – including mixed logit (ML) and latent class (LC) models – for robust estimation of mode choice parameters; and (3) conduct policy-sensitive simulations evaluating how strategic variable adjustments reshape modal market shares.
The research delivers dual scientific contributions: Methodologically, it pioneers an integrated modelling framework synergising MNL, random parameter multinomial logit (RPMNL), and finite mixture models (FMM), enhanced through the incorporation of spatial constraint variables and semi-parametric heterogeneity analysis. This approach addresses critical limitations in conventional discrete choice analyses by capturing individual preference heterogeneity and geographical confinement effects inherent to island transportation systems. The study draws on Zhoushan’s transformative infrastructure development, particularly the introduction of cross-sea expressways that have disrupted the traditional dominance of SSS, to generate transferable insights. The findings provide evidence-based recommendations for sustainable intermodal transition and propose a conceptual blueprint that may benefit global island economies facing similar infrastructure modernisation challenges.
The paper adopts a structured analytical framework comprising five integrated sections. Following a contextual overview in Section 1 that establishes the research rationale, Section 2 delineates the methodological architecture through three advanced discrete choice formulations: the MNL baseline, its RPMNL accounting for preference heterogeneity and an FMM capturing latent class segmentation. This section further specifies variable conceptualisation strategies and survey instrumentation protocols governing data collection. Section 3 systematically presents empirical findings from model estimations, while Section 4 engages in critical discourse by evaluating policy-sensitive scenario simulations through marginal effect analyses. The study culminates in Section 5 with synthesised theoretical contributions and evidence-based recommendations for coastal transportation policymakers, distilling essential implications for sustainable intermodal system optimisation.
2. Methods and data
This investigation adopts a three-stage discrete choice modelling approach to decode passenger modal preferences between SSS and road transportation systems. The analytical progression commences with a baseline MNL formulation rooted in a systematic utility maximisation framework. Subsequently, methodological extensions are implemented through two advanced specifications: (1) an RPMNL model accommodating continuous taste heterogeneity via normally distributed coefficients, and (2) an FM model identifying discrete preference segments through LC analysis. Covariate integration follows a hierarchical protocol, initially embedding core determinants (travel cost, time, socioeconomic attributes) within the MNL structure before introducing stochastic heterogeneity parameters. Technical specifications adhere to maximum simulated likelihood estimation protocols, with model fitness evaluated through Bayesian Information Criterion (BIC) comparisons.
2.1. Logit-based methods
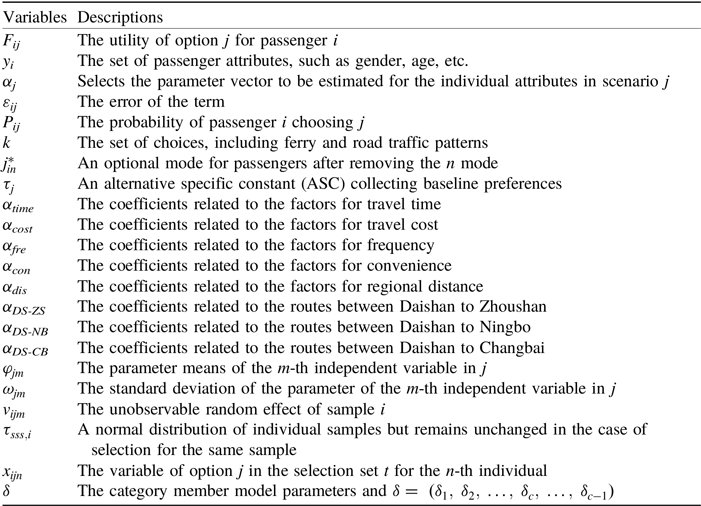
Table 1 lists variables in the models.
Variables of the models

2.1.1. Multinomial logit model
MNL is a multivariate probability model, a frequently used discrete selection model that is widely used in classification and evaluation to predict travel patterns and destination choices (Molloy et al., Reference Molloy, Becker, Schmid and Axhausen2021; Rezaei et al., Reference Rezaei, Khojandi, Haque, Brakewood, Jin and Cherry2022). Thrane and Christer (2015) analysed tourists’ transportation mode choices using MNL and found that trip distance variables and travelling features are the most important factors in these choices. For some selections in random multi-classification, problems can be analysed using standard MNL or by building more complex logit models.
The standard MNL is the base of the entire discrete choice pattern architecture and the straightforward form of the multi-classification discrete choice pattern architecture. MNL is based on the hypothesis of utility maximisation and random utility, which requires the introduction of utility functions:
 $${F_{ij}} = {{\rm{\alpha }}_j}y_i^{'} + {\varepsilon _{ij}}$$
where
 $i,\;j\; = \;1,2,\;3 \ldots, \;n$
.
Therefore, the probability of passenger
 $i$
choosing option
 $\;j\;$
is:
 $${P_{ij}} = P\left( {{F_{{\rm{ij}}}} \gt {F_{{\rm{ik}}}}} \right),\;j \ne k$$
Let
 $\;{\varepsilon _{ij}}$
be subject to a generalised extremal distribution; then, the probability of passenger
 $i$
choosing
 $j$
is:
 $${P_{ij}} = {{{\bf{exp}}({\alpha _j}y_i^{'})} \over {\mathop \sum \nolimits_{k\; = 1}^j {\bf{exp}}({\alpha _j}y_k^{'})}}$$
When constructing a logistic regression model with maximum likelihood, the maximum likelihood function is:
 $${L_i}\left( \theta \right) = \mathop \prod \limits_{n = 1}^n {P_{inj_{in}^*}}\left( \theta \right)$$
The model is adjusted by explanatory variables to include the characteristics of the covariates that describe the survey samples. Every covariate captured in the investigation was examined for its influence on the effectiveness of road travel compared to SSS, and the vital covariates were reserved. Equation (5) explores the eventual stochastic utility function of the MNL model:
 $$\matrix{ {{v_{ijm}} = {\tau _j} + {\alpha _{time}}{y_{time,ijm}} + {\alpha _{cost}}{y_{cost,ijm}} + {\alpha _{fre}}{y_{fre,ijm}} + {\alpha _{con}}{y_{con,ijm}} + {\alpha _{dis}}{y_{dis,ijm}}} \cr { + \left( {j = = 1} \right)\left( {{\alpha _{DS - ZS}}{y_{DS - ZS}} + {\alpha _{DS - NB}}{y_{DS - NB}} + {\alpha _{DS - CB}}{y_{DS - CB}}} \right)} \cr } $$
where
 $j\; = \;1\;or\;2$
represents SSS or road.
 ${\tau _j}$
is normalised to 0 for one option. The shifting for SSS utility obtained by adding covariates with
 $j = \;1\;equals$
1 for SSS, otherwise 0.
2.1.2. Random parameter multinomial logit model
The base MNL models collect different choices connected with the investigated attributes of passengers. However, some non-observed heterogeneous data cannot be captured by the base model (Deng, Reference Deng2022; Salas et al., Reference Salas, De la Fuente, Astroza and Carrasco2022). To solve the limitation of individual differences and the independence of irrelevant alternatives hypothesis, the RPMNL model is introduced (Bagloee and Withers, Reference Bagloee and Withers2019).
The overall form of the RPMNL base is consistent with that of the MNL model, such as in Equation (3). The parameters of the random parameter logit (RPL) model are non-fixed, and the component
 $m$
of the parameter αj is:
 $${{\alpha _{ijm}} = {\varphi _{jm}} + {\omega _{jm}}{v_{ijm}}}$$
where
 ${v_{ijm}}$
means variances are 0 and 1, respectively. So, the likelihood function can be generated from Equation (4) as follows:
 $${{{\rm{L}}_{\rm{i}}} = \mathop \int \nolimits_{{{\rm{\alpha }}_{\rm{i}}}} \mathop \prod \limits_{n = 1}^n {{\rm{P}}_{{\rm{inj}}_{{\rm{in}}}^{\rm{*}}}}\left( {{\alpha _i},\tau } \right)}$$
The RPMNL model has high data requirements, but the sample size of this paper is small. Thus, the RPMNL model can gather only the successive stochastic heterogeneity in the baseline sensitivity of SSS and τ sss . This collects other differences between participants whose covariates in Equation (5) were not captured. This stochastic heterogeneity is incorporated into the ASC indicators as follows:
 $${\tau _{sss,i}}\sim N\left( {{\gamma _{sss}},{\mu _{sss}}} \right)$$
It indicating that, in this case, the SSS baseline preferences can obtain the average value and reference standard from the estimated value by γ sss and μ sss .
2.1.3. Finite mixture model
The sample size influences the accuracy of research findings, as larger samples generally better capture the diversity and variability of research subjects, reduce errors and improve the accuracy of results. A small sample size may fail to capture all anomalies and trends, resulting in lower accuracy of the results, which may lead to one-sided and misleading conclusions. However, when considering random heterogeneity, while a large sample size usually improves the universality of the research results, the analysis of representative samples is used to obtain more powerful and applicable results to ensure the reliability of statistical inference. In this study, due to the small sample size, the RPMNL model is limited in its ability to incorporate stochastic heterogeneity within the explanatory variables. However, it is insufficient to consider only random heterogeneity in constants since explanatory variables have random heterogeneity due to individual characteristics. To address this limitation, we introduce the finite mixture (FM) model. The FM model combines potential variables with taxonomic variables to capture the heterogeneity in all samples, while using covariates to explain the population-level heterogeneity without relying on predefined assumptions regarding the distribution patterns of the parameters (Brathwaite and Walker, Reference Brathwaite and Walker2018; Lazarsfeld and Henry, Reference Lazarsfeld and Henry1969).
Suppose the sample had
 $n$
individuals, each with
 $T$
selections, each with
 $J$
options. If individual
 $n$
selects option
 $\;j$
in the set t,
 ${y_{njt}} = 1$
, otherwise
 ${y_{njt}}$
= 0. This assumes that the number of potential classes in the sample of n individuals is C, and the parameters of the different classes are different; that is, potential class
 $\beta \; = \;\left( {{\beta _1}{\beta _2},\; \ldots, \;{\beta _c} \ldots, \;{\beta _c}} \right)$
. When an individual
 $n$
is in category
 $C$
, the probability of selection is:
 $${P_n}\left( {{\beta _{}}} \right) = \mathop \prod \limits_{i = 1}^i \mathop \prod \limits_{n = 1}^n {\left[ {{{{\bf exp} \left( {{\beta _c}{y_{ijn}}} \right)} \over {\mathop \sum \nolimits_{k = 1}^j {\bf exp} \left( {{\beta _c}{y_{ijk}}} \right)}}} \right]^{{x_{ijn}}}}$$
In cases where it is not possible to determine the specific classification of an individual
 $n$
, it is necessary to specify a non-conditional likelihood value of the individual selection, which is equal to the weighted mean for the individual
 $n$
in all categories. The probability of the
 $n$
-th individual falling into category
 $C$
is:
 $${P_{cn}}\left( \delta \right) = {{{\bf exp} \left( {{\delta _c}{x_n}} \right)} \over {1 + \mathop \sum \nolimits_{m = 1}^{c - 1} {\bf exp} \left( {{\delta _m}{x_n}} \right)}}$$
For the identification of the problem,
 ${\delta _c}$
is defined as 0, and
 $c$
is for individual attribute variables such as age, place of residence, destination, etc. Thus, the probability that option
 $j\;$
(not included in
 $J$
alternatives) is chosen by an individual
 $n$
in category
 $C$
in selection situation
 $u$
is:
 $${P_{nuj\mid c}}\left( \delta \right) = {{{\bf exp} {P_{cn}}\left( \delta \right)} \over {\mathop \sum \nolimits_{m = 1}^J {\bf exp} \left( {{P_{num\mid c}}} \right)}}$$
where
 ${P_{num\mid c}}$
is the selection utility in category
 $C$
, so the marginal probability of passenger
 $n$
selecting alternative
 $j$
is:
 $${P_{nj}}\left( \delta \right) = \mathop \sum \limits_{c = 1}^C {P_{nuj\mid c}}{P_{nc}}$$
To verify the number of classes in the FM model, a range of models was evaluated. Due to the heterogeneity of the study sample, every class is perceived to be different in obtaining the algorithm output. In the FM model, adding classes increases the number of parameters; at the same time, the likelihood ratio (LR) test,
 ${\rho ^2}$
measurement, Akaike information criterion (AIC) and Bayesian information BIC are examined for appended parameters:
 $${\bf ln}L\left( {\alpha, \delta } \right) = \mathop \sum \limits_{n = 1}^N {\bf ln} \mathop \sum \limits_{c = 1}^C {P_{nuj}}\left( \delta \right){P_n}\left( {{\delta _c}} \right)$$
The number of levels depends on the value of the AIC and BIC. The smaller the AIC and BIC, the greater the fitting degree of the model. When the results drawn by the AIC and BIC are inconsistent, BIC generally prevails (Lin and Dayton, Reference Lin and Dayton1997).
By comparing the AIC and BIC values in the FM model, we found that the second type has lower AIC and BIC values at the same time, and the p-value is less than 0.05, with an obvious significance level. Therefore, we choose to divide the data into two potential categories (Class 1 and Class 2).
2.2. Case study description: Zhoushan Archipelago
2.2.1. A brief description of the Zhoushan Archipelago
The Zhoushan Archipelago is situated on the coast of the East China Sea and comprises 1,390 islands covering an area of approximately 22,200 km2 and a population of 1.2 million (see Figure 1). This region is famous for its abundant fishery resources and numerous tourist attractions. The Ningbo–Zhoushan Port is the largest port in the world (Feng et al., Reference Feng, Grifoll, Zheng, Martin Mallofre, Murphy and Li2021); however, for the majority of islands in Zhoushan, inter-island transport relies on ferries only. This means SSS, primarily in the form of ferry transport, has played a vital role in supporting local economic activities. Since 2006, the island-linking project has resulted in the construction of more than 20 bridges within the Zhoushan area, reshaping the local transport system and providing options for local transportation. Consequently, SSS is no longer the only transport mode linking islands with Zhoushan as well as connecting Zhoushan and the mainland.
Location of the study area.

As indicated in Figure 1, Daishan Island is the second-largest island in the Zhoushan Archipelago. For a long time, SSS has been the only mode of transportation available to connect Zhoushan and Daishan, with ferry journeys taking approximately 2 h. The opening of Zhoudai Bridge in 2021 introduced a new expressway connecting Zhoushan and Daishan, reducing the travel time to just 40 min. This new road transport option has significantly disrupted the traditional role of SSS. It is in this context that this paper investigates the inter-island travel mode choice between road transport and SSS.
2.2.2. Definitions of the model variables
According to Grisolía and de Dios Ortúzar (2024), the factors affecting travel mode choice are as follows: (1) travel time, (2) travel cost, (3) ferry/bus frequency, (4) transfer times, (5) egress time to the destination time, (6) time to arrival at departure and (7) waiting time. In this survey, the researchers found that some respondents lacked a clear definition of ‘transfer times’ and ‘waiting time’. For the sake of accuracy, these two variables are combined into a single variable labelled ‘convenience’. The same applies to ‘egress time to the destination time’ and ‘time to arrival at departure’, which were merged into a unified variable termed ‘distance to departure/destination’. As a result, the impact factors were refined to five variables, which were subsequently analysed in the model estimation:
-
1. Travel time: The total time required for a one-way road trip or ferry crossing from the OD, encompassing both travel time and waiting time. The travel modes include walking, cycling and taxi. The time for driving to the pier or bus station is comparable to the time taken by taxi; therefore, in this case, private cars are categorised as taxis.
-
2. Travel cost: The total expenses incurred by respondents during the whole journey, including bus tickets, boat tickets, riding expenses, taxi fees, car fuel costs, and road toll.
-
3. Ferry/bus frequency: The number of departures per day by ferries or buses.
-
4. Convenience: A composite measure of the overall travel experience of passengers, including factors such as the distance from the starting point to the bus station or pier by different modes, the distance from the bus station or pier to the destination by different modes, transport service, transfer times, and waiting time.
-
5. Distance to departure/destination: The distance between non-major traffic areas, including the distance from the starting point to the bus station or pier, and the distance from the bus station or pier to the destination, is referred to as ‘regional distance’.
This paper also involved Alternative Specific Constants (ASC) for ferries and vehicles.
2.3. Data organisation and preliminary computations
2.3.1. Survey
Data about travel mode choice was collected using structured questionnaires through individual interviews. These data were acquired based on a SP survey (Shakeel and Hossein Rashidi, Reference Shakeel and Hossein Rashidi2022) implemented in Daishan, Zhoushan and Changbai on weekdays from September to December 2021. Given that the majority of respondents were residents of Daishan Island – a population characterised by an ageing demographic with limited proficiency in using electronic devices – a traditional paper-based questionnaire was employed for the interviews. Paper questionnaires are limited to respondents who can be physically reached, and the samples may not fully cover the target population. However, they can include individuals with disabilities in using electronic devices in the survey samples. Field questionnaire surveys can effectively collect target data, establish a deeper communication relationship with respondents, increase the trust and response rate of respondents, better control the survey process, minimise information misunderstanding or omission, and improve the accuracy and reliability of data.
A specific questionnaire was developed for each region of the study and divided into the following eight steps:
-
1. Obtain general information on the characteristics of the interviewees.
-
2. Obtain the departure locations of interviewees to evaluate the convenience of the travel.
-
3. Record the travel activities of interviewees, especially the departure and destination of the trip.
-
4. Consult about the travel experience and the last trip made by the interviewees.
-
5. Travel performance test (the travel mode consists of 13 choices).
-
6. Evaluate the validity and rationality of the travel performance test.
-
7. Obtain passenger opinions on sea and land transportation.
-
8. The final choice of the interviewees.
Considering the purposes of this study, the focus is on the statistical analysis of the information collected in the first five parts of the questionnaire.
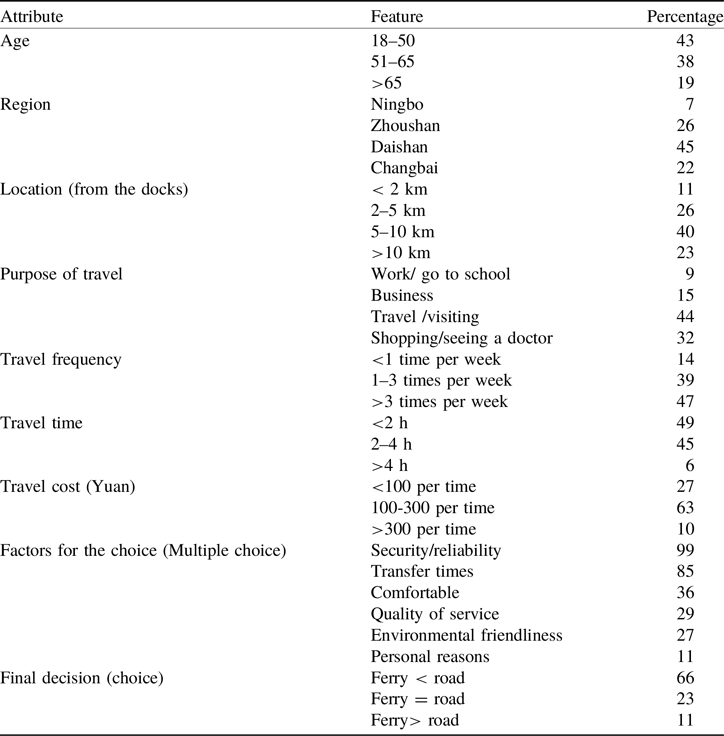
To safeguard the privacy of participants, the survey was conducted anonymously, and all respondents were adults aged over 18 years. A total of 517 samples were collected for this survey. We removed some respondents from the sample according to Step 6; for example, passengers who reported suffering from seasickness or carsickness, or expected travel time during the period when the ferry was suspended, and interviewees who claimed that they had never considered a ferry (vehicle). After filtering, the number of questionnaires available was then reduced to 376. The data were categorised by different routes and regions (Li et al., Reference Li, Hensher and Ho2020; Pan and Zuo, Reference Pan and Zuo2020) and analysed to determine the relationship between preference and travel time, product value and product urgency. In addition, the four covariates – personal characteristics, destination, situational variables, and itinerary – were incorporated to better understand the personal background of passengers. All of these were captured by continuous variables and a virtual coded mixture model (see Table 2).
Characteristic statistics of the SP survey in the sample

For this SP survey, the retest reliability method was applied to identify and reduce sample bias. The second questionnaire survey was conducted on the weekend of January 2021. The same questionnaire was used to retest within the same sampling interval, and the effective sample data of 95 respondents were obtained. The reliability coefficient of this questionnaire was 91.3%. According to the conclusion by DeVellis and Thorpe (Reference DeVellis and Thorpe2021), the data in this paper have reference value.
This study considered the travel time and travel cost for every available mode, including: (1) arriving at a port or station by car, taxi, walking, cycling, or bus; (2) the waiting time of the five modes, and (3) the number of transfer times in the OD region (including the five modes). To estimate the time of arrival and departure, we measured the distances between shipping and land transportation, the distance and the speed of all five modes. The travel time was calculated by using the distance and speed of the five modes. Their practical latency times were recorded at the stations, and these data were applied to establish the available alternative values for travellers who did not choose these modes of transport. The waiting times for the remaining modes were collected immediately from the interviewees, and the average value was also allocated to road travellers who had effectively utilised these modes.
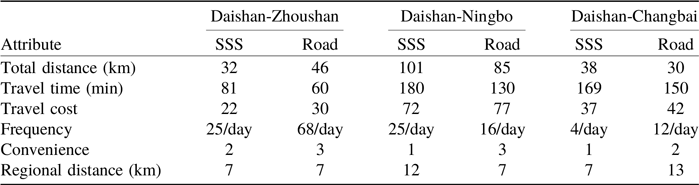
After the Zhoudai Bridge was opened for traffic, the ferry sailings arriving at and departing from the Gaoting terminal were discontinued by the government. As a result, the only remaining maritime departure point on Daishan Island is now located more than 40 km away from the mainland starting point. The remaining operational maritime traffic routes are Xiushan–Sanjiang and Xiushan–Sanjiang (Haifeng) – Changbai. However, this study exclusively considers the situation between the road and a hypothetical SSS option. The selected OD pairing is the SSS that can be substituted by Zhoudai Bridge to access Daishan Island. In this sense, the three corridors (OD pairs) are selected as shown in Figure 2. Table 3 lists the parameters of the three corridors.
OD pairs in the study area.

Mode characteristics and attribute level as road/ferry transport conditions

The ‘Convenience’ was assigned a scale where 1 is low convenience, 2 is a general level of convenience, and 3 is high convenience. To facilitate respondents’ understanding and ease of response, the variable ‘Convenience’ was quantified by setting the number of transfer times to 2 and the frequency to one per hour, in which case Convenience = 2. If the transfer is less than 2 times and there is more than one flight per hour, Convenience = 3; if the transfer is more than 2 times and the flight frequency is less than once per hour, Convenience = 1. Regional distance refers to the distance of walking, cycling or taxi from the departure to the pier (bus station), or from the pier (bus station) to the destination.
2.3.2. Preliminary computations
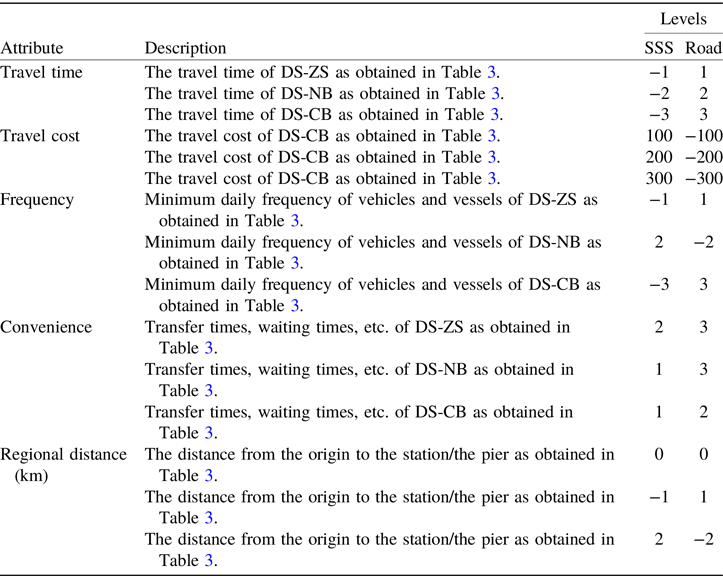
The model variables underwent evaluation to ensure their suitability prior to parameter estimation. Table 4 reveals the attribute levels used in the SP. These levels provide insight into strategies for improving the performance of the SSS by categorising the variables accordingly.
Factors and the counterpart attribute level

3. Results
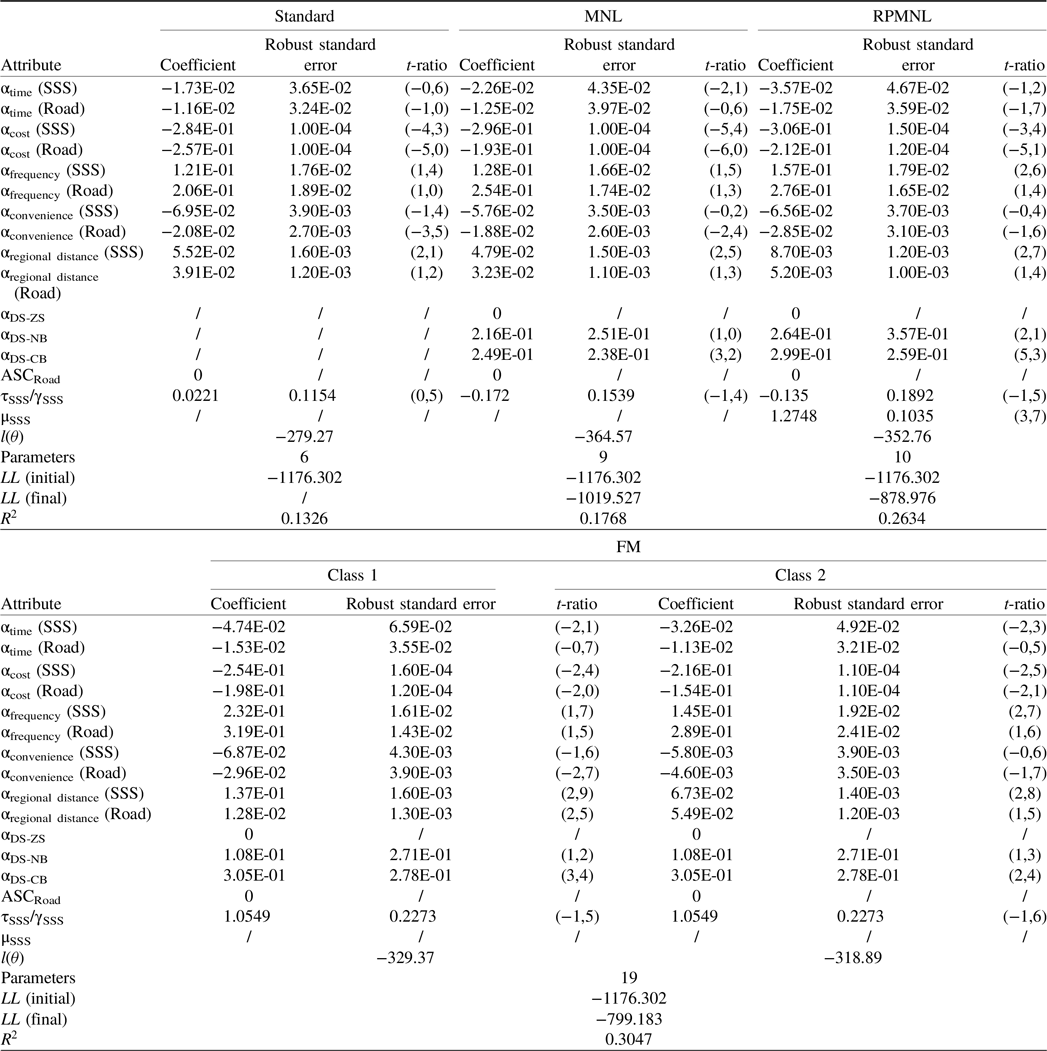
Table 5 reports the estimated results. The increase of the robust standard deviation indicates that a gradual improvement in the joint significance of all coefficients across the models, with subsequent models demonstrating enhanced adaptability as reflected by the log-likelihood values. The normal statistical tests are employed in the analysis, for example, the robust standard error, the t-ratio and the ρ 2 statistic about constant-only models (de Dios Ortúzar and Willumsen, Reference de Dios Ortúzar and Willumsen2012). The signs of all parameters align with theoretical expectations, and the majority of them are significantly different from zero at the 95% confidence interval, apart from the MNL model and the FM model. Incorporating additional covariates into the MNL model results in a log-likelihood improvement of 156.775 units, alongside an increase in four parameters. This rejects the null hypothesis, which posits no difference at the basic confidence level of the likelihood ratio test. The RPMNL model improves the likelihood by adding a random parameter to capture random heterogeneity, which leads to a further increase of 150.551 units. The FM model uses a likelihood ratio test and gets a step further with an enhancement of 79.793 units, while it performs significantly better than the two MNL models. Based on the evaluation of the three fitting statistics, the fit of the FM model is preferable to that of the MNL models.
Model results

Interpretation of the results proceeded with checking the estimation of parameters in the four models in Table 5. As reported in these models, all the coefficients have the expected signs, and most parameters are available for road and SSS. The negative coefficients for αtime, αcost and αconvenience indicate that the increase in travel time, travel cost and convenience will decrease the negative utility of the option to which this change is applied. The positive estimate coefficients for αfrequency and αregional distance, demonstrating an increment in each, will lead to a rise in the utility of the substitute to which this change is applied. Compared with other basic factors, the convenience and the distance between departure and the port on SSS, as well as the travel cost and the distance between departure and the station on the road option, make a slightly higher contribution to the utility. This indicates that passengers opting for SSS prioritise journey convenience, whereas those choosing road transport are more concerned about travel costs. A reasonable explanation for this is that the restricted island traffic conditions have affected the islanders’ consumption patterns. Therefore, islanders tend to prioritise financial cost and journey experience over time-related factors.
To determine the baseline route preference for SSS, the attributes of the three routes are encoded by a nonlinear encoding method in the shape of virtual encoding. The attribute standard of the Daishan-Zhoudai Bridge (DS-ZS (αDS-ZS)) is regarded as the reference standard. It can be inferred from the results that, all other things being equal, passengers on the Daishan to Ningbo route (DS-NB (αDS-NB)) prefer SSS to travel more than passengers on the Daishan-Changbai route (DS-CB (αDS-CB)). In discussing the problems facing the SSS on Daishan Island, it is imperative to consider this variable because the low port transport rate limits the shipping traffic on Daishan Island. At least 10% of ferry trips on Daishan Island are suspended due to inclement weather and traffic control, resulting in a low passenger traffic rate for SSS. But DS-CB involves only a 1.8 nautical mile crossing, meaning that the impact of such objective factors is minimal. Nevertheless, the DS-CB transport on SSS has a low transit frequency, which is extremely inconvenient. Consequently, passengers choose road transportation to greatly improve the convenience and efficiency of the journey. This study ignores the passengers’ place of residence, financial background and other factors. The following section evaluates these important impact factors.
4. Discussion
4.1. Passenger heterogeneity
The value of ASCRoad in each model is 0, which indicates that the respondents are willing to accept other schemes, and travellers do not have a basic preference, or external incentives can change preferences (Hess and Adler, Reference Hess and Adler2007; Morfopos et al., Reference Morfopos, Kopsidas and Kepaptsoglou2024) for SSS in the process of travel selection. This suggests the presence of heterogeneity among respondents across all models, which becomes more pronounced in the RPMNL model. The standard deviation of the random coefficients in the model indicates the presence of unobserved variables, which are associated with the standard deviation of the random parameters and the dispersion of the mean of the sample data. With the FM model, it was observed that respondents could be divided into two distinct classes, each displaying differing sensitivities to explanatory variables. The results revealed significant differences in preferences between the two groups, and especially in the sensitivity of the explanatory variables.
Almost all the explanatory variables in the model have a significant effect on utility in class 1, while only time and convenience affect utility in class 2, and the importance is different for each class; the results thus show a different behavioural process. The first kind of passenger likely has psychological habits (Devarasetty et al., Reference Devarasetty, Burris and Shaw2012). Without strong external stimulation, such people will generally stick to the familiar path they choose. In this case, travellers prioritise experiential factors, such as convenience over time-related concerns. This behaviour is particularly prominent in the DS-ZS region, where personal attributes heavily influence travel decisions. Travellers do not have family cars, prefer to choose familiar routes or consider that the supporting services of decades-old routes are better. Such travellers always have obvious heterogeneity in travel cost changes. As the explanatory variables increase, the utility of SSS decreases. So, it is necessary to discuss the effect of the constraint on the utility function as a positive and negative dependent variable change (Hensher et al., Reference Hensher, Rose and Greene2008). Higher travel frequency amplifies the negative impact of increased travel costs on SSS utility. This underscores the need for differentiated ticket pricing strategies tailored to groups with different travel frequencies.
Another type of passenger behaviour involves a change in a single independent variable that exerts a disproportionate effect on the utility function compared to other explanatory variables, and even minor changes cannot be ignored (Börjesson, Reference Börjesson2008). The utility of the objective scheme function shifts to the alternative, resulting in direct competition between the two transport modes (Meunier and Quinet, Reference Meunier and Quinet2012). For passengers travelling by road, there is a strong preference for minimising travel time. These individuals prioritise travel time both on and off the road, a pattern that is particularly evident in the DS-NB region. The transfer times and waiting time are reduced, and road travel utility is increased, while the utility of SSS is reduced. The total travel time utility is the primary determinant of their choice, whereas travel costs have a less significant direct impact on their decision-making. This is related to the purpose of the passengers, as many of these passengers commute or travel at public expense. Based on such passengers, a differentiated SSS scheme design should be implemented for different travel purposes and different income groups. Additionally, competitive total travel times need to be developed to attract such passengers. The classification of passengers into groups is influenced by uncertainty factors that are not directly observable. Each sample has the possibility of being assigned to another class, as the individual choice leads to a different distribution probability. Thus, the classification is based on the selected characteristics of the interviewees.
This paper considers the heterogeneity of research samples by incorporating objective constraints in specific areas according to different travel purposes and payment methods. A multi-dimensional comparative analysis is conducted, leading to the conclusion that the factors affecting travel modes are dynamic. This is different from the prejudice measurement standard of public transport formulated by Murray et al. (Reference Murray, Walton and Thomas2010), which declares the differences between cities are mainly based on the social norms and service quality of prejudice. The passenger allocation framework established by Nguyen et al. (Reference Nguyen, Pallottino and Malucelli2001) only considers the departure time and route selection, whereas the findings of this study provide a valuable supplement. Melis et al. (Reference Melis, Queiroz and Sörensen2024) analyse the on-demand public transport system according to passengers’ travel purpose, travel type and travel interval, but restrict their analysis to buses and subways. We consider all possible travel schemes and align the most suitable travel scheme for different groups of passengers.
4.2. Sensitivity analysis
The results suggest that adjusting the key variables can influence the traveller’s decisions regarding their transportation choices, aligning with the perspectives of Yang and Chen (Reference Yang and Chen2009). Passengers generally prefer transfers that require less movement and shorter durations (Uchida et al., Reference Uchida, Oshima and Hondou2008). Therefore, the convenience and the distance between the point of departure and the pier or station play the most significant role. Whether or not it is convenient to arrive at the pier, the number of transfer times also directly affects the consumer’s decision. Another important variable that cannot be ignored is travel cost. While passengers exhibit high sensitivity to costs within a specific mode of transport, the total travel cost, which incorporates multiple variables, is of greater importance (Brons et al., Reference Brons, Pels, Nijkamp and Rietveld2002). Variations in total travel costs across SSS and road transportation modes directly impact the maximisation of travel utility. Once the fixed channel is built, the government should establish a competitive ferry pricing system benchmarked against road pricing to encourage cost-sensitive traffic to shift towards SSS. The key to improving the competitiveness of SSS on Daishan Island is to achieve no-transfer access to the terminal and reduce the total travel cost of SSS by increasing the availability of shorter vehicle routes and frequencies.
The subsequent step involves analysing the travel time associated with reference variables. Shortening the travel time has the potential to increase the number of SSS passengers (Grisolía and de Dios Ortúzar, Reference Grisolía and de Dios Ortúzar2010). Among the two main groups identified in the survey, the majority of individuals who are less sensitive to travel time are islanders. Their long-term traffic inconvenience has shaped a slower pace of life, greatly reducing the sensitivity of the time factor. With the formation of transportation of the proposed competitive pattern, connectivity in island areas will be improved, which will increase cohesion with the mainland and promote its openness (Rigas, Reference Rigas2012). As a result, time sensitivity among these individuals may increase. The time cost can be reduced by reducing the number of transfers and the waiting times simultaneously. In addition, increased service frequency can be achieved by stimulating greater SSS passenger traffic, enabling ferries to provide services at the appropriate frequency, and effectively reducing travel time (Konstantinus et al., Reference Konstantinus, Zuidgeest, Hess and de Jong2020). The other type of individuals is mainly those making business trips to the island, most of whom are willing to pay higher travel costs in exchange for a shorter travel time. For different individuals, consumption and inertial choices formed over time are the competitive advantages of SSS. To obtain a larger market share, a competitive price system can be established to accommodate different travel purposes and travel frequencies. This approach is critical for the sustainable development of SSS.
5. Conclusions
This study employs the standard logit model as its foundational framework, extends the analysis via the MNL model, and subsequently implements the RPMNL model to mitigate limitations stemming from individual heterogeneity and the restrictive independence of irrelevant alternatives assumption. Additionally, the FMM is applied to account for random heterogeneity inherent in small-sample variables. To systematically compare passenger mode choices between SSS and road transport while examining preference variations across OD intervals, an anonymous SP survey was administered. Critical variables were incorporated to estimate model parameters. such as travel time, cost, transfer frequency, service intervals (ferry/bus), convenience and terminal proximity. The principal findings are summarised below:
Firstly, this analysis identifies transfer frequency, terminal proximity and travel cost as the three most influential factors shaping commuter mode choice, with the RPMNL model demonstrating significant random heterogeneity in passenger preferences. Results reveal that modal selection depends on traveller characteristics: SSS adoption is predominantly driven by convenience factors – specifically, reduced transfer frequency, optimised ferry/bus scheduling and shorter waiting times – whereas road commuting decisions are primarily cost-sensitive, reflecting a fundamental trade-off between journey quality and financial considerations. The FMM model further delineates route-specific preference patterns, showing that passengers travelling from Daishan to Ningbo (DS-NB) – the longest corridor – favour SSS, while those on the Daishan-Changbai (DS-CB) route, characterised by the shortest maritime segment (1.8 nautical miles) and limited sailings that diminish SSS’s comparative advantages, prioritise road transport for its minimal transfer requirements. To enhance SSS competitiveness, policymakers should tailor operational strategies to travel purpose and frequency through measures such as streamlining pier transfers, augmenting peak-period ferry availability on short routes and implementing dynamic pricing systems – including tiered fares for commuters versus leisure travellers, express ferry services with time-based surcharges and road-competitive tariff structures – to incentivise modal shifts.
Secondly, islanders’ lower time sensitivity, distinctive consumption patterns and travel comfort prioritisation constitutes a strategic competitive advantage for SSS. To secure market dominance and sustainable growth, operators must establish a dynamic equilibrium between temporal efficiency and cost-effectiveness. This requires governments to prioritise infrastructure modernisation through targeted public funding, specifically enhancing terminal facilities and boarding processes to elevate the passenger experience. Concurrently, implementing an integrated multimodal fare system – covering maritime and terrestrial transport at market-competitive rates – alongside frequency-based subsidy schemes for regular travellers, will incentivise SSS adoption. Such measures align with islanders’ preference for comfort-driven, cost-conscious mobility and are projected to secure robust community endorsement, reinforcing SSS’s position as a socially and economically viable transport solution.
This study employs stated preference data to qualitatively evaluate mode choice determinants, with findings inherently constrained by respondent biases and the exclusive reliance on SP-derived parameters, including impact factor costs. While the modest sample size necessitates caution in generalising results, future research should prioritise validation through revealed preference data integration or hybrid SP-RP models, supplemented by expanded datasets to quantify variable elasticity. Methodological extensions could involve designing dynamic SSS fare structures benchmarked against road transport pricing, optimising temporal coordination between ferry and feeder-bus networks, and assessing supply-side operator incentives to holistically refine multimodal SSS systems. Crucially, while the Zhoushan Archipelago’s distinct geoeconomic and infrastructural profile offers insights for island-based mobility studies, contextual specificity limits direct applicability to other regions; divergent travel behaviours may emerge in archipelagos with varying spatial configurations, economic development stages, or transport resource allocations. Thus, while this framework informs analogous island contexts, its broader relevance requires empirical validation across heterogeneous settings to establish transferable operational principles.
Acknowledgements
The authors would like to thank the anonymous referees for their helpful comments on this paper. Their comments significantly increased the quality of this paper.
Funding statement
This research was partially funded by the ‘Research Base on Digital Economy Innovation and Linkage with Hub Free Trade Zones’, a key research base of philosophy and Social Sciences in Ningbo and National ‘111’ Centre on Safety and Intelligent Operation of Sea Bridges (grant number D21013).
Competing interests
The authors declared no potential conflicts of interest with respect to the research, authorship and/or publication of this paper.