Introduction
Theories about seedling survival with respect to conspecific seedling density or distance to adult trees, suggest it is advantageous for a tree to disperse its seeds so that offspring retain the benefits of the parent's environment but also escape the disproportionate mortality associated with high seedling densities near the parent tree (Bolker & Pacala Reference BOLKER and PACALA1999, Howe & Smallwood Reference HOWE and SMALLWOOD1982). There is strong selection for mechanisms that increase survival and Janzen (Reference JANZEN1970) and Connell (Reference CONNELL, den Boer and Gradwell1971) suggested that by lowering the risk of density- and distance-dependent mortality, seed dispersal confers an advantage in offspring survival with increased dispersal distance (Nathan & Casagrandi Reference NATHAN and CASAGRANDI2004, Turner Reference TURNER2001), i.e. the escape hypothesis (Howe & Smallwood Reference HOWE and SMALLWOOD1982).
Density- and distance-dependant mortality patterns are generally produced by specialized invertebrate predators (seed and foliage) and soil-borne fungal pathogens that are characterized by low mobility, in contrast to wide-ranging, mammals or generalist invertebrate predators that rarely produce such patterns (Hammond & Brown Reference HAMMOND, BROWN, Newbery, Prins and Brown1998). In general, in species capable of long-distance dispersal, such density- and distance-dependent patterns result in high mortality and low recruitment of tree propagules that fail to disperse far enough from the parent tree (Augspurger Reference AUGSPURGER1983, De Steven & Putz Reference DE STEVEN and PUTZ1984, Howe et al. Reference HOWE, SCHUPP and WESTLEY1985, Packer & Clay Reference PACKER and CLAY2000) resulting in a hump-shaped recruitment curve with distance from the parent (Janzen Reference JANZEN1970). However, depending on dispersal ability, density- and distance-dependent mortality may operate at different spatial scales in different species. Poor-dispersing species, such as those with ballistic or gravity-dispersed seeds, may be disadvantaged by density-dependent agents of mortality, and experience high mortality close to parent trees where seedling density is likely to be high. A large seed crop may be synchronously produced in some poor-dispersing species to counter the effects of predation by swamping and satiating predators (Blundell & Peart Reference BLUNDELL and PEART2004a, Curran & Leighton Reference CURRAN and LEIGHTON2000, Hart Reference HART1995, Toy Reference TOY1991), also resulting in a hump-shaped recruitment curve. Thus, a hump-shaped recruitment curve may arise in ballistically dispersed species where the seed dispersal kernel is humped-shaped (Neubert & Parker Reference NEUBERT and PARKER2004) and where density- and distance-dependent mortality effects on seedlings are invariant or negatively dependent over a small spatial scale (McCanny Reference MCCANNY1985, Nathan & Casagrandi Reference NATHAN and CASAGRANDI2004). Therefore, to explain successful recruitment in a poor-dispersing species where most propagules may not ‘escape’, it is necessary to investigate density-related survivorship or mortality at small spatial scales.
We examine the advantages of seed dispersal away from parent trees for seedling survival in Philenoptera sutherlandii (Harv.) Schrire (synonym: Millettia sutherlandii Harv.), a common canopy tree species in Ongoye Forest, South Africa. This species has large woody pods that dehisce while still on the tree, expelling seeds. Seed germination success is relatively high but seedlings are tender and easily killed by adverse growing conditions, herbivores or pathogens (Coates Palgrave Reference COATES PALGRAVE2002). As the seeds are initially ballistically or gravity-dispersed, the options for escaping the crown shadow of the parent tree are limited and we expected seedling survival to be density-dependent in this species. We determine: (1) the spatial relationship between seedling density and distance from adult trees – the recruitment pattern, (2) the effect of distance from the nearest P. sutherlandii adult on seedling survival, (3) the effect of the density of conspecific seedlings on seedling survival, (4) the role of insect herbivory in seedling mortality, and lastly we (5) evaluate the local spatial scale, if any, at which density-dependent seedling mortality operates.
METHODS
The Ongoye Forest Reserve (28°50′S, 31°42′E; 3900 ha), created in 1914, is located on the Ongoye hills (altitude: 305–490 m), which are 12 km from the coast in KwaZulu-Natal province, South Africa. The reserve comprises a species-rich coastal scarp forest (2611 ha) set in a mosaic of coastal grassland and rocky granitic outcrops (1277 ha). Scarp forest physiognomy is characterized by a poorly developed herb layer, a well-developed seedling and sapling stratum, an open understorey and a medium to high canopy (15–25 m; von Maltitz et al. Reference VON MALTITZ, MUCINA, GELDENHUYS, LAWES, EELEY, ADIE, VINK, FLEMING and BAILEY2003). The density of understorey (3–8 m) and canopy trees (> 8 m) is 718 and 246 ha−1 respectively, and the mean canopy tree species richness per 0.0625-ha plot is 9 (Krüger & Lawes Reference KRÜGER and LAWES1997).
The study species, P. sutherlandii, is restricted to coastal scarp forests in the Eastern Cape and KwaZulu-Natal provinces in South Africa (Coates Palgrave Reference COATES PALGRAVE2002). It has an aggregated distribution in the forests, is locally common (31% cover at Ongoye), tall (20–25 m) and has a spreading crown (radius <10 m) (Krüger & Lawes Reference KRÜGER and LAWES1997). The flat seed pods (pod length = 12 cm) are abundantly produced and contain four flat seeds (15 × 10 mm). The seeds are toxic and have high germination success. There is no recorded secondary dispersal by caching mammals, for example, P. sutherlandii is not listed among the food plants of the red squirrel (Paraxerus palliatus ornatus (Gray, Reference VILJOEN1864)) endemic to Ongoye forest (Viljoen Reference VILJOEN1980). Rotenone, similar isoflavones, and saponins are present in the highly toxic seeds and diterpenoid alkaloids (which have a cardiotonic and highly toxic effect) and hydrocyanic acid may be present (Allen & Allen Reference ALLEN and ALLEN1981, Hutchings et al. Reference HUTCHINGS, SCOTT, LEWIS and CUNNINGHAM1996, van Wyk et al. Reference VAN WYK1997).
In February 2004 we identified and marked (with a small, inconspicuous tag) 180 newly established P. sutherlandii seedlings (hereafter referred to as focal seedlings) in a 50 × 100-m area containing 30 adult P. sutherlandii trees. We systematically searched for seedlings around adult trees up to half the distance between neighbouring adult trees. From the latter we estimated the probable dispersal kernel based on the frequency distribution of seedlings from an adult. We assumed a monotonically decreasing (negative exponential decay) seed-rain profile, although theory suggests that ballistic dispersal may result in a hump-shaped seed dispersal kernel (Neubert & Parker Reference NEUBERT and PARKER2004). All selected seedlings were at the late cotyledon or primary leaf stage and roughly the same size (15.2 ±2.4 cm tall, mean ± 1 SD, range = 9–23 cm, n = 180), vigorous (2.31 ± 1.12 leaves per seedling, mean ± 1 SD, range = 1–6 leaves, n = 180) with no apparent signs of disease, decay, or herbivory. Seedling survival was recorded 15 mo later in April 2005. In between times we monitored (June 2004, October 2004) seedling survival and recorded signs of herbivory. We did not encounter herbivory by vertebrates, and although some seedlings were attacked by pathogens they were most severely affected by invertebrate herbivory. Survival of the focal seedlings was measured relative to the density of conspecific seedlings and the distance of a focal seedling to the trunk base of the nearest conspecific adult. Adults were defined as reproductively mature individuals. We measured seedling density in nested concentric circular plots of 0.5, 1.0, 1.5, 2.0 m radii, centred on the marked focal seedlings. We used naturally established seedlings instead of transplants to reduce the mortality related to transplant shock, but also to preserve the natural seedling density and distance range.
The data for the relationship between seedling density and distance of the focal seedling from a potential parent tree were heteroscedastic (‘envelope effect’, sensu Thomson et al. Reference THOMSON, WEIBLEN, THOMSON, ALFARO and LEGENDRE1996; Levene test, P < 0.001) and not suitable for analysis using ordinary least squares (OLS) regression. The confounding effect of this heteroscedasticity is statistically controlled for by quantile regression, which estimates multiple rates of change (slopes) from the minimum to maximum response, providing a more complete picture of the relationships between variables (seedling density and distance) missed by standard regression methods (Cade & Noon Reference CADE and NOON2003). Quantile regressions were conducted using the software program Blossom (Cade & Richards Reference CADE and RICHARDS2005). In a ballistically dispersed species we expected that seed and seedling mortality would be highest close to adult trees so that seedling density should increase with increasing distance from the adult tree to a distance where seed dispersal effects cause seedling density to decline again. We tested the fit of the data to this escape hypothesis, where the humped shape in seedling density over distance from an adult is described by a modified Ricker function, y = β0Xβ1eβ2Xε. We used the linearized form of the Ricker function, ln (y + 1) = ln(β0) + β1ln(X) + β2X + ln(ε), in the quantile regressions.
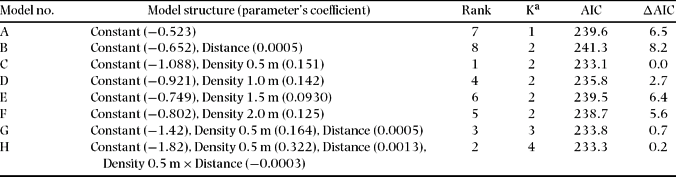
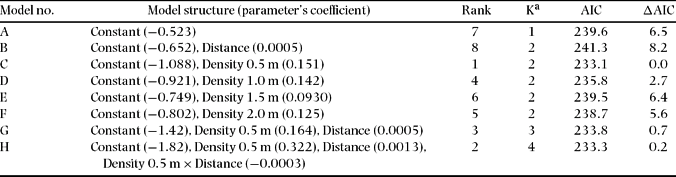
Survival data were analyzed using Generalized Linear Models (GLM). Because a seedling either survived or died during the course of the experiment, we modelled seedling survival using binomial proportions and a logit link function (McCullagh & Nelder Reference MCCULLAGH and NELDER1989) in the GLM routine in GenStat 9.1. We fitted the main effects of seedling density (at different spatial scales) and distance from the nearest P. sutherlandii adult tree on focal seedling survival. To avoid data dredging, eight candidate models were formulated a priori (Burnham & Anderson Reference BURNHAM and ANDERSON2002). Because our density data were not independent from one another, we built the models sequentially using only one seedling density scale in each model (Table 1, Model C to F) to determine at what spatial scale (i.e. plots of radius 0.5, 1.0, 1.5, 2.0 m) seedling density had an effect on seedling survival. We selected the best model (in this case Model C) and built two further models to examine the interaction between seedling density and distance from the nearest P. sutherlandii adult tree. Akaike's information criterion (AIC) was used to select the most parsimonious model (Anderson et al. Reference ANDERSON, BURNHAM and WHITE1994). The AIC balances the fit of the model against the number of parameters used in the model (Anderson et al. 2001). The AIC is calculated as Residual Deviance + 2K (McCullagh & Nelder Reference MCCULLAGH and NELDER1989), where K is the number of parameters in the model. The model with the smallest AIC value (and a difference of at least two AIC units from other models) was accepted as the best fit to the data. Models that differed by < 2 in AIC value were regarded as equivalent and the model with the fewest parameters was favoured (Anderson et al. Reference ANDERSON, BURNHAM and WHITE1994).
Structure and rankings of models used to estimate the distance-dependent and density-dependent patterns of seedling mortality in Philenoptera sutherlandii. K is the number of parameters in the model; AIC is Akaike's Information Criterion and is used to select the best model. ΔAIC is the difference in AIC value between a model and the best fit model (ΔAIC = 0).
RESULTS
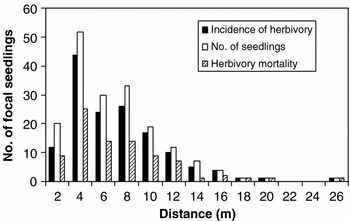
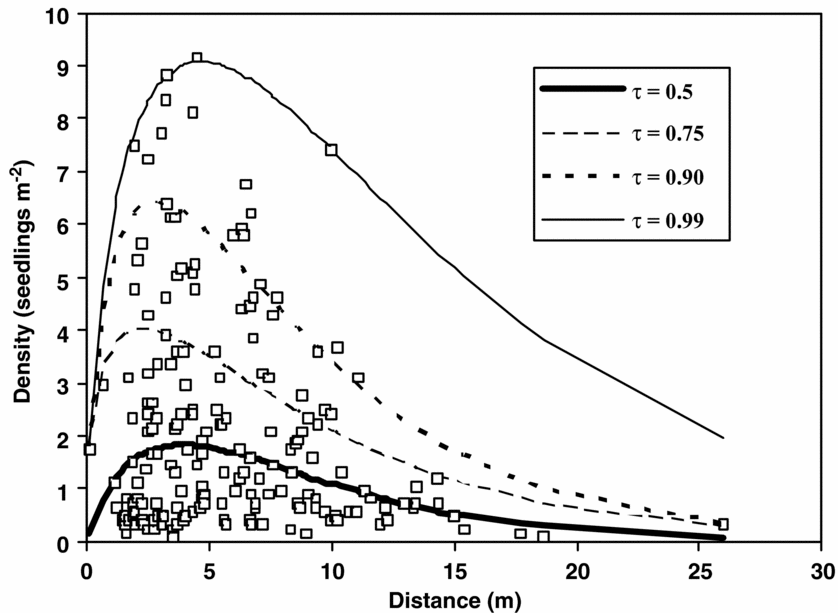
The distance between the focal seedling and the nearest adult P. sutherlandii ranged from 0.1 m to 26.0 m (5.9 ± 3.9 m; mean ± 1SD, n = 180). As P. sutherlandii is relatively common, it was difficult to find a distance > 26 m between a seedling and an adult tree. Based on the frequency distribution of focal seedlings, the putative dispersal kernel was hump-shaped with few focal seedlings close (≤ 2 m) to an adult and a long tail (Figure 1). The shape of the probable dispersal kernel gives rise to a hump-shaped recruitment curve (Figure 2). Seedling density increased with increasing distance up to 4 m from an adult tree and then gradually decreased to < 1 seedling m−2 at distances > 12 m. These effects are best revealed at the higher seedling densities associated with upper quantiles (τ), where the effects of factors other than density-dependent predation are minimal (Figure 2). However, even the 0.50 quantile showed the non-linear trend in seedling density with increasing distance from an adult, confirming that the Ricker function is a good estimator of the underlying biological relationship (the recruitment curve) between seedling density and distance from an adult.
Frequency distribution of focal (sampled) seedlings from the nearest adult tree, and the distance-dependent incidence of herbivory and insect-related mortality of these focal seedlings.

Quantile regression estimates (τ = 0.99, 0.90, 0.75, 0.5) were used to describe the recruitment curve or changes in seedling density with distance from the nearest adult tree. Changes in seedling density (y) are modelled as a function of distance (x) based on a modified Ricker function. The recruitment curve (τ = 0.5) is a typical humped shape.
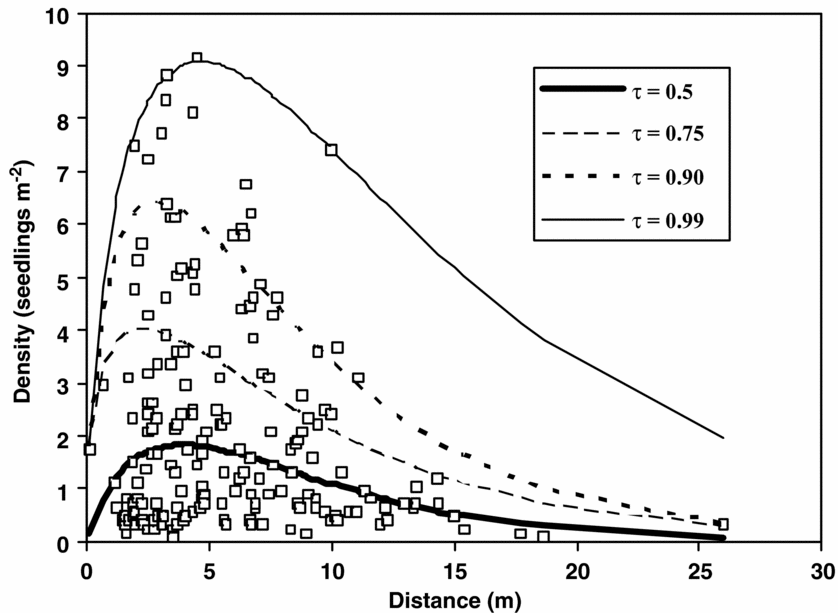
To be certain that seedling survival is due to the effect of density-dependent predation and not density-dependent conspecific competition, (1) seedling mortality must be demonstrably due to predation (herbivory), and not an unknown factor that could be ascribed to competition between seedlings, and (2) seedlings at higher densities closer to an adult should have lower survival than seedlings at lower densities farther from an adult. Seedling density near P. sutherlandii adult (< 12 m) trees varied, ranging from 0.08 to 9.15 seedlings m−2, and few seedlings were found at a distance > 16 m (0.08–1.19 seedlings m−2; Figure 2). By the end of the experiment (after 432 d) 63% of the 180 seedlings had died (note that seedling survival had not stabilized by the end of the study yielding a short-term survival of 37%). Most seedlings showed signs of insect herbivory during the experiment and 47% of the 180 seedlings died from predation (i.e. 74% of mortalities were due to insect herbivory). Of the 61 surviving seedlings at the end of the experiment, 94% showed signs of insect herbivory with 52% moderately to severely affected. It appears that insect predation rather than competition among seedlings is the important mortality effect on seedlings in this species. However, there was no distance-dependent pattern to the insect predation. Seedlings at higher densities closer to an adult did not have significantly lower survival than seedlings at lower densities at the edge of the parental crown shadow (χ2 = 2.63, df = 8, P = 0.95). Few seedlings established > 12 m from an adult and few of these survived herbivory (Figure 1) resulting in a negative correlation between seedling density and survival overall.
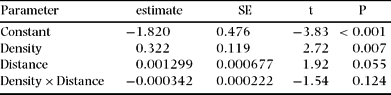
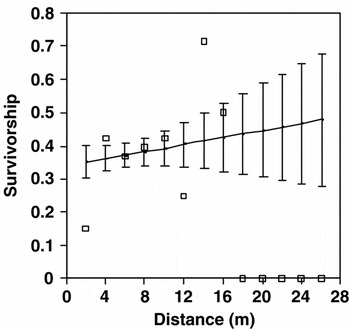
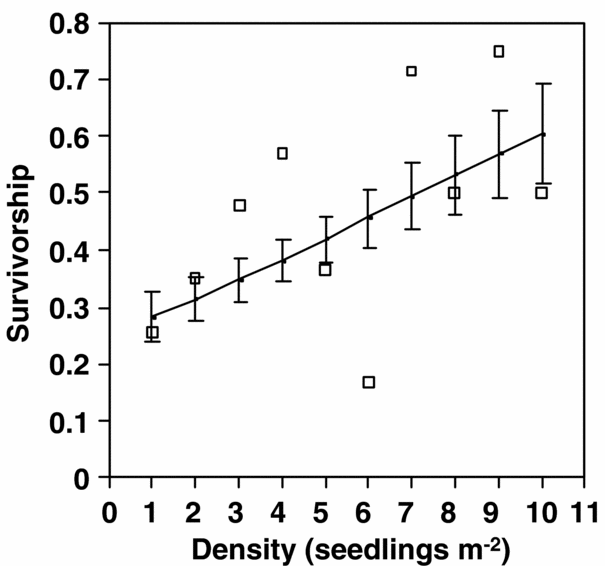
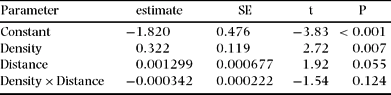
In the analysis of seedling survival the best-fit GLM was Model C (Table 1), which included only seedling density within a 0.5-m radius of the focal seedling. The full model (Model H) including the effect of distance was a marginally worse fit than Model C (ΔAIC = 0.2), indicating that seedling survival was only weakly affected by distance from the nearest P. sutherlandii adult tree (Table 2; Figure 3). Furthermore, there was no significant interaction between seedling density and the distance from the nearest P. sutherlandii adult tree (Model H), supporting the conclusion that seedling survival is more likely a function of local seedling density (Figure 4) than distance from the nearest conspecific adult.
Parameter estimates (± SE) for the logistic regression of focal seedling survival (n = 180 seedlings) on seedling density and distance from the nearest adult tree. The model (Model H, Table 1) was a good fit to the data (χ2 = 4.11, P = 0.006).
Observed (open squares) and predicted survivorship (± 1 SE) over 15 mo of Philenoptera sutherlandii seedlings. Survival is statistically invariant (slope = 0.0013, t = 1.92, P = 0.06) with distance from the nearest adult tree.

Observed (open squares) and predicted survivorship (± 1 SE) over 15 mo of Philenoptera sutherlandii seedlings in relation to seedling density (slope = 0.322, t = 2.72, P = 0.007).
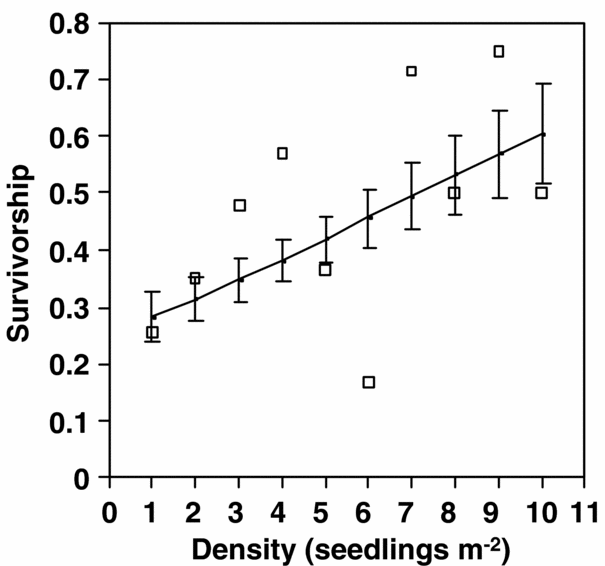
The survival of the focal seedlings was best described by seedling density measured over a small area (plot of 0.5 m radius; Model C); the most likely spatial scale over which insects may judge prey or food density. The fit between seedling survival and density progressively faded with increasing plot area (see density coefficient in Table 1) so that seedling density in the larger plots (1.5 and 2 m radius plots) was not a good estimator of seedling survival.
Discussion
Our two main aims were to (1) quantify the distribution of seedlings relative to adult trees, and (2) determine whether distance and/or density-dependent seedling survival affects seedling distributions in the ballistically (short-distance) dispersed tree species, Philenoptera sutherlandii. Most seedlings established beneath the parent tree so that density was a unimodal function of distance (Figure 2), and seedling survival was expected to be negatively density-dependent and positively distance-dependent (Hart Reference HART1995, Houle Reference HOULE1995, Willson Reference WILLSON1993). Contrary to expectation, seedling survival was positively density-dependent in this species. In addition, although seedling survival was relatively high after 15 mo (37%), it was not significantly distance-dependent within the parent crown shadow, but was positively density-dependent beyond it. Species with short-distance dispersal are predisposed to an aggregated distribution with the potential to dominate forest ecosystems (Howe Reference HOWE1989, Gilbertiodendron dewevrei forest groves – Hart Reference HART1995, some dipterocarps – Appanah & Turnbull Reference APPANAH and TURNBULL1998). Negative density-dependent survival is thought to prevent such species from dominating forest ecosystems (Connell Reference CONNELL, den Boer and Gradwell1971, Connell et al. Reference CONNELL, TRACEY and WEBB1984, Harms et al. Reference HARMS, WRIGHT, CALDERON, HERNANDEZ and HERRE2000, Howe Reference HOWE1989, Janzen Reference JANZEN1970, Webb & Peart Reference WEBB and PEART1999) and forms the basis of the escape hypothesis (Howe & Smallwood Reference HOWE and SMALLWOOD1982) in which high seedling survival is associated with low seedling densities further away from parent trees. Philenoptera sutherlandii is a puzzle because although its seedlings do not escape the effects of either distance- or density-dependent mortality in the predicted way, this species population is clearly regulated and does not dominate the tree community as much as one might expect.
Ballistic species are often pod-bearing and dehiscent legumes (Fabaceae) (Malo Reference MALO2004, Raghu et al. Reference RAGHU, WILTSHIRE and DHILEEPAN2005) and prolific seeders like P. sutherlandii. Prolific seed production (and rapid germination) is one way to counter density-dependent seed predation (Curran & Leighton Reference CURRAN and LEIGHTON2000, Curran & Webb Reference CURRAN and WEBB2000, Hart Reference HART1995, Willson Reference WILLSON1993) and a large seed crop is associated with predator satiation in some mast-fruiting tree species (Blundell & Peart Reference BLUNDELL and PEART2004a, Curran & Leighton Reference CURRAN and LEIGHTON2000, Toy Reference TOY1991). Howe (Reference HOWE1989) predicted that species with short-range dispersal (e.g. ballistic dispersal) and high seed production should be common, highly aggregated, and have evolved chemical or mechanical defences against seed predators, pathogens and herbivores that act in a density-dependent manner. These predictions are all fulfilled in P. sutherlandii – the species has a clumped distribution, is common (relative dominance = 31%), and the seeds are certainly toxic (Allen & Allen Reference ALLEN and ALLEN1981, Hutchings et al. Reference HUTCHINGS, SCOTT, LEWIS and CUNNINGHAM1996, van Wyk et al. 1997), while relatively low levels of vertebrate herbivory (12%) of seedlings suggest they may be toxic to vertebrates too, although most seedling mortality (74%) was due to herbivory by insects. In species with very short-distance dispersal, high seedling densities (and chemical defences) may satiate predators so that at least some seedlings survive in close proximity to the parent tree (Du et al. Reference DU, GUO, GAO and MA2007, Forget Reference FORGET1992, Wright et al. Reference WRIGHT, MULLER-LANDAU, CALDERON and HERNANDEZ2005, Xiao et al. Reference XIAO, ZHANG and WANG2005), but with the disadvantage that at low seedling densities towards the edges of the dispersal kernel, seedling mortality can be very high. The latter scenario is supported in this study (Figures 3 and 4). Seedling densities were relatively high and seedling survival was not distance-dependent within the crown shadow (< 10 m) of P. sutherlandii trees (Figure 3). Thus, ballistically dispersed P. sutherlandii seedlings did not escape distance-dependent mortality effects in the way predicted by the escape hypothesis, which in turn may cause stabilizing selection for adaptations (e.g. copious seed production, rapid germination, chemical defences) that ensure recruitment within their crown shadow.
Negative density-dependent and positive distance-dependent seedling survival are suggested to cause a hump-shaped recruitment curve in many species (Howe & Smallwood Reference HOWE and SMALLWOOD1982, Nathan & Casagrandi Reference NATHAN and CASAGRANDI2004). McCanny (Reference MCCANNY1985) has argued, however, that this unimodal recruitment pattern is one of five possible distinct types of distance-dependent recruitment patterns. Here we show that although seedling survival is positively density-dependent and not distance-dependent, P. sutherlandii nevertheless displays a typical humped-shaped distance-dependent population recruitment pattern. Such a recruitment pattern is possible, and indeed likely, in ballistic species where the seed dispersal kernel is humped-shaped (Neubert & Parker Reference NEUBERT and PARKER2004) and where density- and distance-dependent mortality effects on seedlings are invariant or negatively dependent over a small spatial scale (McCanny Reference MCCANNY1985, Nathan & Casagrandi Reference NATHAN and CASAGRANDI2004). It is probable that the initial dispersal kernel was hump-shaped in P. sutherlandii, as uniform distance-dependent mortality within the crown shadow of the parent tree would preserve the initial shape of the dispersal kernel, further suggesting that the shape of the recruitment curve is not entirely due to differential mortality of seedlings.
Uniform distance-dependent survival may occur if more generalized seed and seedling predators, insects in this case, are attracted to the adult trees but also tend to forage farther away (Nathan & Casagrandi Reference NATHAN and CASAGRANDI2004). In ballistic species with short dispersal distances, predation pressure by insect herbivores may select for the large seed crops that generate the high densities needed to satiate seed and seedling predators. Predator (insects) satiation is thus a plausible explanation for the pattern of greater seedling survival at higher seedling densities close to P. sutherlandii adults (Augspurger & Kitajima Reference AUGSPURGER and KITAJIMA1992, Blundell & Peart Reference BLUNDELL and PEART2004b, Burkey Reference BURKEY1994). This study supports the proposition that through predator satiation, the potential effects of strong density-dependent mortality of P. sutherlandii seedlings within the seed shadow of the parent tree are reduced, permitting sufficient recruitment for persistence of this common species.
Invariant distance- or negative density-dependent mortality trends could also be due in part to the relatively short period of this study. In ballistic dispersers, the poor dispersal in space may be compensated by better dispersal in time. For example, although ballistochorous seed dispersal in G. dewevrei resulted in few seeds establishing >10 m from the parent tree and seed survival was low (0.3%), seedling survival was high over 10 y (49%) (Hart Reference HART1995). At Ongoye forest P. sutherlandii seedling survival was relatively high (37%) over the short-term (15 mo) yielding a seedling density of 2.17 seedlings m−2 (cf. 2.42 seedlings m−2 in Boudreau & Lawes Reference BOUDREAU and LAWES2005). However, seedling survival had not stabilized by the end of the study and estimates from sapling to seedling ratios suggest 2% of seedlings survive to become saplings and trees in the long term (Boudreau & Lawes Reference BOUDREAU and LAWES2005). In summary, the aggregated distribution of P. sutherlandii adults is explained by the establishment of their seedlings close to parent trees, and their long-term survivorship accounts for their being common in the tree community. In the long term, high levels of seedling predation lead to sapling densities that are comparable to other less-abundant species at Ongoye forest (see Table 1 in Boudreau & Lawes Reference BOUDREAU and LAWES2005; note Millettia = Philenoptera).
Our data do not support the escape hypothesis of density-dependent seedling survival and distance-dependent escape from mortality effects (Forget Reference FORGET1992, Hammond & Brown Reference HAMMOND, BROWN, Newbery, Prins and Brown1998, Hammond et al. Reference HAMMOND, BROWN and ZAGT1999, Hart Reference HART1995, Itoh et al. Reference ITOH, YAMAKURA, OGINO and LEE1995, Kitajima & Augspurger Reference KITAJIMA and AUGSPURGER1989, Mack et al. Reference MACK, ICKES, JESSEN, KENNEDY and SINCLAIR1999). Nevertheless, spatial heterogeneity in P. sutherlandii seedling density resulted from a combination of a potentially humped-shaped dispersal kernel (arising from ballistic seed dispersal), relatively high but invariant seedling survival within the crown shadow of parent trees, and negative density-dependent seedling mortality at distances beyond it. Seedling mortality was caused mostly by insect herbivory and these generalist seed and seedling predators, by causing similar mortality risk over a local spatial scale, may select for short-dispersal distance, high seed production and reproductive strategies that in general ensure propagule survival through predator satiation.
ACKNOWLEDGEMENTS
We are grateful for financial support from the Sappi-WWF TreeRoutes Partnership, the Fonds Québécois de Recherche sur la Nature et les Technologies (Fonds NATEQ) and the National Research Foundation of South Africa (Conservation and Management of Ecosystems and Biodiversity) under Grant Number 2069339. Any opinion, findings and conclusions or recommendations expressed in this material are those of the authors and do not necessarily reflect the views of the National Research Foundation. We are grateful to Sharon Louw and Graham Keat of Ezemvelo KwaZulu-Natal Wildlife for their support, Catherine Perrier, Stefanie Pollock and Robyn Wethered for their help in the field, and to Colin Chapman for reading early drafts of this paper. This study would not have been possible without the logistical support provided by the Mazda Wildlife Fund.