1 Introduction
1.1 Sex differences in speech production
Speaker sex differences in adults have been reported in the temporal domain of speech. For example, faster speaking rates (Jacewicz, Fox & Wei Reference Jacewicz, Fox and Wei2010) and shorter acoustic vowel durations (e.g. Simpson Reference Simpson1998, Whiteside Reference Whiteside1996) have previously been attributed to male speakers. However, there is also evidence to suggest that sex differences in vowel durations are complex, and that these differences are context-dependent (Simpson & Ericsdotter Reference Simpson and Ericsdotter2003). In addition, there are reports of speaker sex differences in the spectral parameters of speech. For example, a more distinct and larger vowel space has been found for women's formant data (e.g. Traunmüller Reference Traunmüller1988, Lee, Potamianos & Narayanan Reference Lee, Potamianos and Narayanan1999, Whiteside Reference Whiteside2001, Simpson Reference Simpson2009). These speaker sex differences in vowel spaces could be attributed to the sexual dimorphism in supralaryngeal dimensions (i.e. the oral cavity to pharynx ratio). However, evidence suggests that some sex differences in speech production might also be a function of sociocultural factors (e.g. Henton & Bladon Reference Henton and Bladon1985; Byrd Reference Byrd1992, Reference Byrd1994; Whiteside Reference Whiteside2001). The sex differences in speaking style in more formal settings observed by Byrd (Reference Byrd1992, Reference Byrd1994), the fuller phonetic forms displayed by women (Whiteside Reference Whiteside1996), as well as the greater phonetic distinctiveness of vowels (e.g. a larger vowel space for women) found in Lee et al.'s (Reference Lee, Potamianos and Narayanan1999) database (Whiteside Reference Whiteside2001) suggest that lower degrees of coarticulation might also be a feature of women's speech. This suggestion is supported by McLeod et al. (Reference McLeod, Baillargeon, Metz, Schiavetti and Whitehead2001), who found significantly steeper second formant (F2) locus equation slopes for male than for female speakers, thereby suggesting higher levels of coarticulation for male speakers. Considering these previously reported speaker sex differences, the following hypotheses were investigated in this study. Firstly, female speakers were expected to exhibit longer utterance and vowel durations than male speakers. Secondly, it was predicted that male speakers would show greater degrees of coarticulation than female speakers. The faster speaking rates attributed to male speakers may suggest faster mean rates of formant change. However, differences in vocal tract dimensions (Fitch & Giedd Reference Fitch and Giedd1999) and the more peripheral and larger vowel space of female speakers (Whiteside Reference Whiteside2001) may contribute to larger changes in formant frequencies over time. On this basis, an additional hypothesis was that male speakers would exhibit slower mean rates of formant change in the acoustic signal, despite articulatory movements which cover a greater distance.
1.2 Temporal and spectro-temporal measures of speech
The focus of this study was on spectro-temporal measures which may hypothetically vary as a function of speaker sex. In addition to measuring utterance and vowel durations, this study quantified the degree of coarticulation by calculating the absolute formant frequency changes in the first three formants between vowel onset and temporal midpoint for each participant (see Equation 1).
 \begin{linenomath}\begin{equation*}
{\rm Equation}\;1\!:\quad \Delta {\rm Fn} = ||{\rm Fn}_{{\rm midpoint}} - {\rm Fn}_{{\rm onset}} ||\end{equation*}\end{linenomath}
Smaller absolute formant changes (e.g. smaller ΔF2 values) have been associated with greater degrees of coarticulation, because smaller differences between vowel onset and midpoint formant values may indicate an approximation of both vowel and consonant targets (e.g. Fowler Reference Fowler1994, Brancazio & Fowler Reference Brancazio and Fowler1998). In order to control for sex differences in vocal tract dimensions, the absolute formant frequency changes were also normalised for each participant (see Equation 2).
 \begin{linenomath}\begin{equation*}
{\rm Equation}\;2\!:\quad {\rm norm}\Delta {\rm Fn} = [2\Delta {\rm Fn}/({\rm Fn}_{{\rm onset}} + {\rm Fn}_{{\rm midpoint}} )]\end{equation*}\end{linenomath}
As a measure of dynamic changes in the formant frequencies, mean rates of formant frequency change were calculated based on the absolute formant changes and vowel durations for each participant (see Equation 3 where tvowel is the duration of the vowel).
 \begin{linenomath}\begin{equation*}
{\rm Equation}\;3\!:\quad {\rm rFn} = \Delta {\rm Fn}/(0.5 \times {\rm t}_{{\rm vowel}} )\end{equation*}\end{linenomath}
During the production of CV sequences, these have been shown to indirectly correlate with the mean velocity of the active articulators while moving from the release of the preceding consonant to the vowel target (e.g. Simpson Reference Simpson2001, Chang, Ohde & Conture Reference Chang, Ohde and Conture2002). Greater mean rates of formant change may be interpreted as being indicative of faster movements of the active articulators. To facilitate direct comparisons between the male and the female data, mean rates of formant frequency change were also normalised for each participant (see Equation 4).
 \begin{linenomath}\begin{equation*}
{\rm Equation}\;4\!:\quad {\rm normrFn} = [2\,{\rm rFn}/({\rm Fn}_{{\rm onset}} + {\rm Fn}_{{\rm midpoint}} )]\end{equation*}\end{linenomath}
In addition to absolute formant changes, F2 locus equations were derived to gauge the degree of coarticulation (see Equation 5). These are linear regression functions based on the F2 values at vowel midpoint (independent variable), and F2 values at vowel onset (dependent variable).
 \begin{linenomath}\begin{equation*}
{\rm Equation}\;5\!:\quad {\rm F}2_{{\rm onset}} = {\rm slope} \times {\rm F}2_{{\rm midpoint}} + {\rm y \hbox{\rm -} intercept}\end{equation*}\end{linenomath}
The linear relationship of the second formant in vowel onset and target position was first observed by Lindblom (Reference Lindblom1963). Later studies, such as Krull (Reference Krull1987), applied F2 locus equations to quantify coarticulation by analysing the slope of the linear regression function; steeper slopes (and corresponding lower y-intercept values) were associated with greater degrees of coarticulation and shallower slopes (and corresponding higher y-intercept values), with the converse. Although the relationship between articulatory data and F2 locus equations is not linear, it has been shown to be lawful (Löfqvist Reference Löfqvist1999; Tabain Reference Tabain2000, Reference Tabain2002). In addition, more recently, Iskarous, Fowler & Whalen (Reference Iskarous, Fowler and Whalen2010) and Lindblom & Sussman (Reference Lindblom and Sussman2012) have demonstrated a link between articulatory data and F2 locus equations.
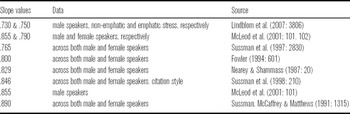
Studies on F2 locus equations for CV sequences have consistently reported place of articulation effects. For example, slopes for the bilabial plosives such as /b/ are consistently steeper and corresponding y-intercepts, lower, compared to those observed for the alveolar cognate /d/ (e.g. Fowler Reference Fowler1994, Sussman et al. Reference Sussman, Bessell, Dalston and Majors1997, Sussman, Dalston & Gumbert Reference Sussman, Dalston and Gumbert1998, McLeod et al. Reference McLeod, Baillargeon, Metz, Schiavetti and Whitehead2001). These observations suggest that /b/ in CV sequences has the highest levels of coarticulation with the ensuing vowel, and therefore the lowest levels of articulatory resistance due to the independence between the main articulators involved in the production of /bV/: the lips and the lingual system. However, while bilabials display the steepest slopes across different places of articulation, the slope values for /bilabial plosive – V/ sequences vary across a range of studies (see Table 1 for examples).
Examples of mean slope values from a selection of published studies reported for /bV/ sequences.

In addition to place of articulation effects on F2 locus equations (e.g. Sussman et al. Reference Sussman, Bessell, Dalston and Majors1997, Reference Sussman, Dalston and Gumbert1998), studies have also found evidence for allophonic variation and vowel context effects (Sussman, McCaffrey & Matthews Reference Sussman, McCaffrey and Matthews1991; Fowler Reference Fowler1994; Sussmann et al. Reference Sussman, Bessell, Dalston and Majors1997, Reference Sussman, Dalston and Gumbert1998). While numerous studies report vowel context effects in locus equations between front (shallower slopes and higher y-intercept values) and back vowels (steeper slopes and lower y-intercept values) for velar plosives (Sussman et al. Reference Sussman, McCaffrey and Matthews1991, Reference Sussman, Bessell, Dalston and Majors1997, Reference Sussman, Dalston and Gumbert1998), others report on similar, if less marked, effects for both bilabial and alveolar plosives (Fowler Reference Fowler1994). Taken together, the place of articulation and vowel context effects on F2 locus equations provide evidence for phonetic context effects on coarticulation effects indexed by F2 locus equations.
This additional measure of coarticulation was used in the current study because F2 locus equations preserve the phonetic context (F2 values at onset and midpoint), whereas the absolute formant changes merely encode the differences. F2 locus equation slopes can be compared using a large sample Z-test for parallelism (Kleinbaum & Kupper Reference Kleinbaum and Kupper1978) based on all individual data points (multiple repetitions/contexts), while comparisons of absolute formant changes are based on mean values per speaker group and subtle effects may not be detected. Lastly, as the phonetic context is largely preserved in F2 locus equations, and onset values are plotted as a function of vowel midpoint/target values, they have the capacity to encode the degree of anticipatory (right-to-left) coarticulation, which has been attributed to speech planning processes (e.g. Fowler & Saltzman Reference Fowler and Saltzman1993), while absolute formant changes encode both anticipatory and perseverative (left-to-right) coarticulation simultaneously.
2 Method
2.1 Stimuli
The stimuli used in the current investigation formed part of a larger study on syllable frequency and speaker sex effects on speech production (Herrmann Reference Herrmann2011). The aim of the current study was to focus specifically on the effects of speaker sex on the temporal and spectro-temporal parameters of speech in the production of the following monosyllabic words by twenty-four native speakers of British English: /bɪz, bɪs, bɪt, bɪb, bɛd, bɛk, bɛst, buːst/. The original primary selection criteria for these stimuli were their frequency of occurrence (per million words, pmw) in spoken language (Baayen, Piepenbrock & van Rijn Reference Baayen, Piepenbrock and van Rijn1993) and a matched phonetic makeup across two narrow frequency bands (325–356 pmw and 1–7 pmw). Other places of articulation for the word-initial plosive were not considered, as no further stimuli could be phonetically matched across frequency categories (Herrmann Reference Herrmann2011). However, frequency effects are not the focus of this analysis.
2.2 Speakers
Eleven male and thirteen female native speakers of English (mean age: 20;1 (i.e. 20 years and one month); SD: 1;8; range: 18–24 years) participated in the study. None of the participants had a known speech or language impairment and all passed a hearing test prior to the experiment, using a Kamplex Screening Audiometer (AS7) with an upper hearing level of 20 dB.
2.3 Data collection
Speech accommodation in interactional settings is a well-established phenomenon; speakers have been found to adjust their speech and vocal patterns to accommodate to those of their interlocutors (Giles, Coupland & Coupland Reference Giles, Coupland, Coupland, Giles, Coupland and Coupland1991). Furthermore, behavioural studies have found strong links between perception and behaviour in face-to-face social interactions with evidence for ‘chameleon effects’ (the unintentional, non-conscious mimicry of others) between individuals (Chartrand & Bargh Reference Chartrand and Bargh1999). Moreover, there is also evidence for individual differences in these effects where those who are profiled as displaying higher levels of empathy also appear to exhibit higher levels of mimicry (Chartrand & Bargh Reference Chartrand and Bargh1999). Therefore, in order to limit the effects of speech accommodation and mimicry which might occur in a social interactional face-to-face setting, the list of speech stimuli were presented to individual participants auditorily as a series of recorded prompts. A single-walled sound attenuating booth was used to secure high quality recordings. Furthermore, no experimenter was present within the sound booth during the recording sessions. While it is acknowledged that some speech accommodation and mimicry might occur when only auditory information is presented, the same fixed protocol for speech data collection was adopted for each of the 24 participants to control for these effects across speakers. The speech stimuli were presented to each participant via loudspeakers to avoid the Lombard effect (Lombard Reference Lombard1911, Junqua Reference Junqua1993). All the prompt speech stimuli were produced by a single adult male speaker and were presented in a randomised order. Participants were required to listen to a stimulus, repeat it during a constant 2.5-second inter-stimulus interval, listen again, repeat again, and so forth for ten repetitions of the same stimulus; a tone after the tenth repetition signalled the presentation of a new stimulus. For example, the stimulus /bɛst/ would be presented to be repeated by the participant during a 2.5-second inter-stimulus interval. This would be repeated until ten instances of /bɛst/ were recorded. A tone would then alert the participant that the next stimulus would be a new word, e.g. /bɪs/. The recorder used to collect the speech samples was a Marantz PMD670, and its settings were mono at a sampling frequency of 22.05 kHz and a 16-bit amplitude resolution. The microphone was a Sennheiser MD425, and was placed on a microphone stand at a distance of approximately 20 cm from each participant's mouth. For each participant 80 sound files were recorded (8 monosyllables × 10 repetitions), yielding a potential total of 1,920 sound files (80 × 24 participants) for analysis. Incorrect or incomplete productions (truncated by the inter-stimulus interval) were discarded, as well as a number of productions, which did not warrant an acoustic analysis due to voice quality (whisper/breathy). These amounted to 119 sound files, leaving a total of 1,801 sound files for acoustic analysis.
2.4 Data analysis
The acoustic analyses were carried out with Praat (Boersma & Weenink Reference Boersma and Weenink2008). TextGrid files were used to mark the acoustic onset and offset of the speech productions in order to calculate the utterance duration. Utterances with unreleased plosives in word-final position were measured to the acoustic offset of the speech signal, for example, to the end of the final glottal pulse or to the breathy vowel offset. The vowel duration was measured between the first glottal pulse and the final glottal pulse. This interval was also used to calculate the temporal midpoint of the vowel.
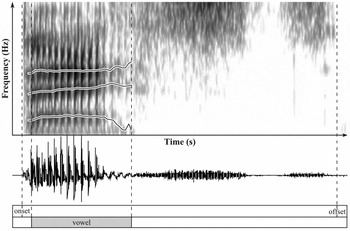
Figure 1 shows an overview of these points for the stimulus /bɛst/. The start point of the vowel interval was marked at the first glottal pulse as seen in the spectrogram; the peak of the first excitation within the sound pressure waveform was selected. The end point was similarly marked based on the visual examination of both spectrogram and sound pressure waveform: after the last glottal pulse as seen in the spectrogram, the end of the last periodic excitation of the sound pressure waveform was selected. In cases where the final consonant was voiced, visual examination was extended to the acoustic energy distribution of higher frequencies, in particular around the second formant and its end.
Example spectrogram and waveform of /bɛst/: Acoustic onset and offset were marked to calculate the utterance duration, the vowel was marked on the interval tier starting from the first glottal pulse to calculate vowel duration and its temporal midpoint. Formant measures (F1, F2, F3) were automatically taken at vowel onset and its calculated temporal midpoint. These were used to calculate the absolute formant changes and mean rates of formant change in F1, F2, and F3, and to derive F2 locus equations.

The frequencies of the first three formants were measured at the vowel onset and the calculated temporal midpoint. Based on these measures, the absolute formant frequency change in F1, F2, and F3 (see Equation 1) as well as the mean rate of formant frequency change in F1, F2, and F3 (see Equation 3) were calculated. Absolute formant frequency changes and the mean rates of change for F1, F2 and F3 were also normalised (see Equations 2 and 4, respectively). F2 locus equations (e.g. Sussman et al. Reference Sussman, McCaffrey and Matthews1991, Reference Sussman, Bessell, Dalston and Majors1997, Reference Sussman, Dalston and Gumbert1998; Sussman Reference Sussman1994; Iskarous et al. Reference Iskarous, Fowler and Whalen2010; Lindblom & Sussman Reference Lindblom and Sussman2012) were derived from the F2 measurements obtained at the vowel onset (first glottal pulse) and the temporal midpoint of the vowel (see Equation 5). This method of measuring the F2 midpoint at the temporal midpoint varies from those adopted in other investigations. For example, some studies have adopted visual inspection methods to determine steady state vowel midpoints or the maxima/minima points within a vowel's formant structure (e.g. Sussman et al. Reference Sussman, McCaffrey and Matthews1991, Fowler Reference Fowler1994, Sussman Reference Sussman1994, Lindblom et al. Reference Lindblom, Agwuele, Sussman and Cortes2007), while others have measured vowel targets at a specified time point from the first glottal pulse/plosive release of a CVC syllable (e.g. Nearey & Shammass Reference Nearey and Shammass1987, McLeod et al. Reference McLeod, Baillargeon, Metz, Schiavetti and Whitehead2001). It also varies from a hybrid approach which is based on both visual inspection and the use of temporal vowel midpoints (e.g. Sussman et al. Reference Sussman, McCaffrey and Matthews1991, Fowler Reference Fowler1994). One advantage of the adopted method is the increased consistency in conducting measurements across different CV contexts. Linear regression analyses based on the vowel midpoints and vowel onsets yielded slope, y-intercept, and R2 values for all speech tokens.
2.5 Intra-rater reliability
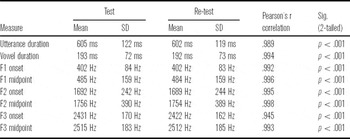
All measures were subjected to an intra-rater reliability test. A data sample (c. 10%) of the recordings was analysed by the first author for a second time approximately one year after the first measurements were taken. One year was considered to be a significant time lapse to ensure robust intra-rater reliability measurements. Table 2 summarises the mean and standard deviation values of utterance and vowel duration, as well as the first three formants at both vowel onset and temporal midpoint. The Pearson's r correlation values (between .945 and .998) indicate high levels of agreement between the two sets of measurements.
Mean and standard deviation values of the acoustic parameters tested for intra-rater reliability (on c. 10% of the entire data set). The Pearson's r correlation values (between .945 and .998) suggest high levels of agreement between the two sets of measurements.

2.6 Statistical analysis
The temporal and spectro-temporal measures investigated in the study were analysed statistically using analysis of variance with speaker sex as the between-subjects factor. The linear regression analyses representing the F2 locus equations yielded slope, y-intercept, and R2 values for all speech tokens. The slope values for the F2 locus equations were tested for statistical sex differences using a ‘large-sample Z-test for parallelism’ (Kleinbaum & Kupper Reference Kleinbaum and Kupper1978: 101–102), and the y-intercept values were tested for statistical sex differences using a ‘large-sample Z-test for common intercept’ (Kleinbaum & Kupper Reference Kleinbaum and Kupper1978: 103–105). The former of these two statistical methods tests whether the slopes of two linear regression lines are the same or different, and the latter, whether their y-intercepts are the same or different. If the slopes are the same (i.e. not statistically significantly different), they are described as parallel if they do not share the same intercept, or as coincident lines if they share the same slope and intercept. Two linear regression lines can share the same intercept but have different slopes, and intersecting regression lines have different slopes and different intercepts (see Kleinbaum & Kupper Reference Kleinbaum and Kupper1978: 97–98). The difference in the correlation coefficients underlying the R2 values of the F2 locus equations was tested using Fisher's zr transformation test (e.g. Fisher Reference Fisher1950; Ferguson Reference Ferguson1959: 195–196).
3 Results
3.1 Utterance and vowel duration
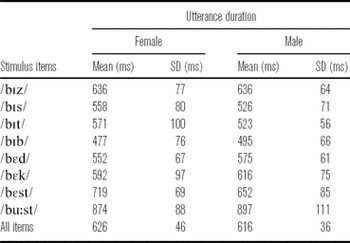
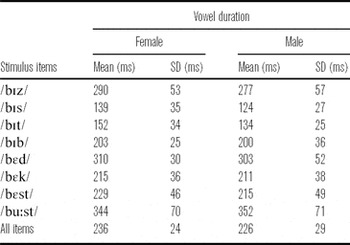
Tables 3 and 4 summarise the mean and standard deviation values for utterance and vowel duration by stimulus item and speaker sex, as well as by speaker sex across all stimuli. The differences between the male and female data were not significant for either utterance duration (mean difference: 9.48 ms [F(1,22) = 0.309, p > .05]) or vowel duration (mean difference: 10.57 ms [F(1,22) = 0.951, p > .05]).
Mean and standard deviation values of utterance duration by stimulus item and speaker sex, as well as across all stimulus items by speaker sex.

Mean and standard deviation values of vowel duration by stimulus item and speaker sex, as well as across all stimulus items by speaker sex.

3.2 Absolute formant frequency and normalised frequency changes
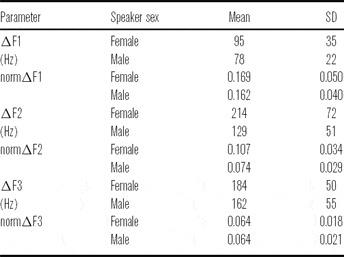
Table 5 summarises the mean values of the absolute formant frequency changes ΔF1, ΔF2, and ΔF3, and corresponding normalised values by speaker sex. There was no significant speaker sex effect for either ΔF1 (mean difference: 16.77 Hz [F(1,22) = 1.901, p > .05]) or ΔF3 values (mean difference: 21.97 Hz [F(1,22) = 1.040, p > .05]), which were lower for male speakers. However, male speakers displayed significantly lower ΔF2 values than female speakers (mean difference: 84.96 Hz [F(1,22) = 10.609, p < .005]). The pattern of speaker sex effects was replicated across the normalised values for the three formant frequencies (normΔF1 – mean difference: 0.007 [F(1,22) = 0.148, p > .05]; normΔF2 – mean difference: 0.032 [F(1,22) = 6.069, p < .05]; normΔF3 – mean difference: 0.00026 [F(1,22) = 0.001, p > .05]).
Mean and standard deviation values of the absolute formant changes in F1 (ΔF1), F2 (ΔF2) and F3 (ΔF3) (in Hz) and corresponding normalised values (normΔF1, normΔF2, normΔF3) by speaker sex.

3.3 Mean rate of formant frequency change and normalised rates of frequency change
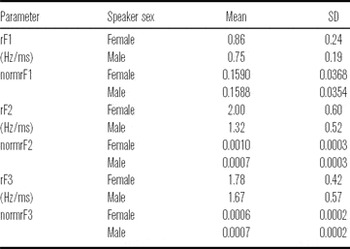
Table 6 summarises the mean values of the mean rate of formant frequency changes for rF1, rF2, and rF3, and corresponding normalised values by speaker sex. There was a significant effect of speaker sex on rF2, where female speakers showed faster mean rates of formant change than male speakers (mean difference: 0.68 Hz/ms [F(1,22) = 8.657, p < .01]). There were no significant sex differences for either rF1 (mean difference: 0.10 Hz/ms [F(1,22) = 1.321, p > .05]) or rF3 (mean difference: 0.12 Hz/ms [F(1,22) = 0.326, p > .05]). The pattern of speaker sex effects was broadly similar across the normalised values for the three formant frequencies. However, the sex effects for F2 were diminished, and only approached significance (normrF1 – [F(1,22) = 0.00012, p > .05]; normrF2 – [F(1,22) = 4.003, p = .058]; normrF3 – [F(1,22) = 0.209, p > .05]).
Mean and standard deviation values of the mean rates of formant frequency change in F1 (rF1), F2 (rF2) and F3 (rF3) (in Hz/ms) and corresponding normalised values (normrF1, normrF2, normrF3) by speaker sex.

3.4 F2 locus equation data
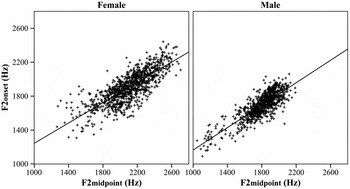
Figure 2 displays the F2 locus equations of the monosyllables grouped by speaker sex. The males showed a significantly steeper slope (.661) than the females (.598) [Z = 2.84, p < .005]. The y-intercept for the men's data samples (503 Hz) was found to be significantly lower compared to the women's (645 Hz) [Z = –3.27, p < .001]. The correlation coefficients underlying the R2 values for the male (r = .819) and female (r = .785) data were also significantly different [zr = 2.02, p < .05].
Scattergraphs depicting the F2 locus equations of the monosyllabic words grouped by speaker sex (female: left panel (n = 974; slope = .598; y-intercept = 645; R2 = .616); male: right panel (n = 827; slope = .661; y-intercept = 503; R2 = .670).

3.5 Post-hoc analysis of vowel effects
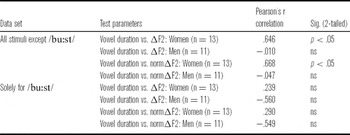
There is evidence to suggest that vowel quality plays some role in speaker sex differences (Simpson & Ericsdotter Reference Simpson and Ericsdotter2003). Therefore, a post-hoc analysis examining vowel effects was also conducted. Vowel duration, ΔF2 and normΔF2 values were examined as a function of vowel quality for men and women. Firstly, ΔF2 and vowel duration values for all stimuli except /buːst/ were examined using Pearson's product moment correlation test. This was done separately for the men and women. This was repeated for the normΔF2 and vowel duration values. Secondly, the whole set of the aforementioned analyses was repeated for the data solely representing /buːst/. This yielded eight sets of correlation coefficients, which are provided in Table 7.
Pearson's correlation coefficients for vowel duration, ΔF2 and normΔF2 values for men and women as a function of vowel context (all data except /buːst/, and solely data for /buːst/).

The results summarised in Table 7 suggest a vowel quality × speaker sex interaction. The correlation between vowel duration and ΔF2 values was significant for the female speakers for all stimuli combined except /buːst/ (r = .646, p < .05), but not for male speakers (r = –.010, p > .05). This sex difference was replicated for the correlation between vowel duration and normΔF2 values. However, when considering solely the data obtained for /buːst/, the correlations between vowel duration and ΔF2 values or vowel duration and normΔF2 values were not significant for either women or men.
4 Discussion
Female speakers exhibited trends for longer utterance and vowel durations than male speakers, but these differences were not significant. This provides only weak support for the first hypothesis and some of the temporal sex differences reported in the literature, where female speakers have been found to exhibit significantly longer vowel and utterance durations (Whiteside Reference Whiteside1996; Simpson Reference Simpson1998, Reference Simpson2001). As mentioned in Section 2.3 above, the data elicitation method may have been a contributing factor to this result. Participants listened to the audio recordings of a male speaker and may have accommodated their speech productions to some degree to his productions. Nevertheless, when Simpson & Ericsdotter (Reference Simpson2003) analysed sex-specific durational differences in American English and Swedish their results revealed more complex interdependencies. While the mean durations of a series of sentences did not vary as a function of speaker sex for either English or Swedish, a plot of the percentage differences in segment durations revealed quite systematic sex differences. In those syllables which carried ‘a degree of stress’ (Simpson & Ericsdotter Reference Simpson and Ericsdotter2003: 1114), female vowel durations trended for longer values. On the other hand, many of the back vowels trended for longer durations when produced by male speakers. Male speakers also trended for longer consonant productions than female speakers. The stimuli in the current study contained predominantly intrinsically short front vowels and one long back vowel (/uː/) as opposed to Simpson (Reference Simpson2001), who analysed diphthongs, and Whiteside (Reference Whiteside1996) and Jacewicz et al. (Reference Jacewicz, Fox and Wei2010), who analysed a range of vowels. For one long back vowel (/uː/) male speakers may have exhibited longer vowel durations, which may have diminished the overall sex difference. Further investigation was conducted as a function of the different stimulus items to investigate this, and an analysis of /buːst/ found this to be the case; males exhibited the trend of a longer mean vowel duration value than the females (see Table 4). In contrast, the remaining set of short front vowels displayed the reverse pattern; females displayed a trend for longer vowel duration values for all stimuli and a longer mean vowel duration value (219.72 ms) than the males (207.91 ms). These results corroborate those of Simpson & Ericsdotter (Reference Simpson2003) suggesting that sex differences in temporal parameters such as vowel duration are determined by an intricate interaction between factors such as linguistic stress, vowel quality and phonetic context, and might therefore explain the results reported here.
There were no significant sex differences in the spectral and spectro-temporal parameters associated with F1 and F3 (see Tables 5 and 6 above). However, significant sex differences were found for the spectro-temporal parameters associated with F2: ΔF2 and corresponding normalised values (see Table 5), the rate in the absolute change in F2 (see Table 6), and the slope of the F2 locus equations representing the speech samples of the women and men (Figure 2 above). Here women displayed higher values for ΔF2, normalised ΔF2 and rF2, and shallower slopes for the F2 locus equations. The higher values for ΔF2 and normalised ΔF2, and the shallower slopes of the F2 locus equations are both indicative of lower degrees of coarticulation in the women's speech samples.
Concerning the sex differences found in the distribution of F2 related parameters, the stimuli used in this study may provide some further insights, as they contained mainly high front and mid front vowels /ɪ ɛ/, and one back vowel /uː/. Traunmüller (Reference Traunmüller1988) and Hillenbrand et al. (Reference Hillenbrand, Getty, Clark and Wheeler1995) found that sex differences in high front vowels are particularly prominent in F2 (see also Lee et al. Reference Lee, Potamianos and Narayanan1999, Whiteside Reference Whiteside2001). In comparison, the differences in F2 are much smaller for high back vowels, for which female and male values are relatively close to each other (e.g. Simpson Reference Simpson2009). Whiteside (Reference Whiteside2001), who further investigated the data collected by Lee et al. (Reference Lee, Potamianos and Narayanan1999), reported that data for the back vowel (/uː/) was indicative of a more fronted (palatalized) quality for the female speakers when compared to their male peers. These sex differences in the second formant, as well as the predominantly high front vowels in the data set investigated here, may explain the consistent speaker sex effects found for the F2 related data (absolute and normalised formant frequency changes, mean rate of formant change, and F2 locus equations). Female speakers showed patterns of higher mean values of the absolute formant change in F1, F2, and F3 than male speakers, which was significant for ΔF2. The higher absolute formant changes for female speakers provide some support to the hypothesis of lower degrees of coarticulation. However, Simpson (Reference Simpson2001) compared acoustic and articulatory data and found that although the articulatory distances covered by the female speakers during the production of the diphthong /aɪ/ in ‘light’ are smaller for female than for male speakers, the absolute formant changes were larger. A similar discrepancy was observed for the articulatory speeds seen in the mean rates of the formant changes. This suggests that the lower degrees of coarticulation, as indicated by the higher absolute formant change values, may be in part attributed to the different vocal tract dimensions of male and female speakers.
Female speakers displayed faster mean rates of formant change in F1 (rF1), F2 (rF2), and F3 (rF3). This difference was significant for rF2, marginally significant for normalised rF2, and mirrors the results of the absolute formant changes in F2 (ΔF2). However, these faster mean rates of formant change do not necessarily imply faster articulatory movements for female speakers, but may be an acoustic dynamic consequence of different vocal tract dimensions (see Simpson Reference Simpson2001). On the basis of differences in vocal tract dimensions and the different articulatory postures involved in the production of different vowels, the links between absolute formant changes and mean rates of formant change need to be interpreted in the context of vowel duration and vowel quality. There were no significant sex differences in vowel duration. However, when the data were probed further, there was some indication that the women and men exhibited different patterns of vowel duration as a function of vowel quality; women trended for longer durations for the front vowels, whereas men displayed a pattern of longer vowel durations for the back vowel /uː/. When the ΔF2 data were analysed further in a post-hoc analysis as a function of vowel quality, a significant sex difference emerged which might explain why the ΔF2 values were higher for the women (see Table 7 above). When ΔF2 and vowel duration data were examined for all stimuli except /buːst/ using Pearson's product moment correlation test for each sex group, the women's data displayed a significant correlation (n = 13, r = .646, p < .05). This was in contrast to the men's data which displayed no significant correlation (n = 11, r = –.010, ns). When the correlations between ΔF2 and vowel duration data were examined only for /buːst/ neither the women (n = 13, r = .239, ns) nor the men (n = 11, r = –.560, ns) displayed significant correlations. These results were replicated when normalised ΔF2 and vowel duration data were examined (see Table 7). These data provide further support for the complex interaction between vowel quality and the spectro-temporal dynamics observed for men and women speakers; the data set with the high front vowels displayed higher ΔF2 and higher normalised ΔF2 values for the women which appeared to be a function of vowel duration and vowel quality. The fact that the stimuli in the current study were dominated by high/front vowels might go some way to explain the sex differences reported here.
For the F2 locus equations, women displayed a significantly higher y-intercept value which can be explained by vocal tract differences (e.g. Fitch & Giedd Reference Fitch and Giedd1999, Lee et al. Reference Lee, Potamianos and Narayanan1999, Whiteside Reference Whiteside2001), and will not be discussed further. The correlation coefficients underlying the R2 values for the men were significantly higher than those for the women, but will not be discussed further as they are not the focus of this study. The F2 locus equations data in the current study centred on the slope values as a measure of coarticulation, and were used to assess the pattern and extent of sex differences, which was the focus of this study. Results indicated significantly steeper slope values for men (.661) compared to the women (.598) (see Figure 2). The mean slope values reported here are lower than those reported in other studies (see Section 1.2 above). There are several possible explanations for this difference. One reason could be the method which was used in the current study to measure the F2 vowel midpoint; this varied from those of earlier reports (see Section 2.3 above). The temporal midpoint of the vowel was used to measure the F2 vowel midpoint in the current study. It is therefore possible that temporal midpoint measurements did not always coincide with the vowel nucleus (steady state, or maxima/minima points) for all data samples. In cases where the vowel nucleus was temporally surpassed, it is therefore possible that the word-final velar and alveolar consonants, and consonant clusters (e.g. /k/, /s/, /z/, /st/, /t/, /d/) might have had some influence on the temporal midpoint values which might have resulted in shallower slopes. Another possible source of variation is individual speaker differences; this suggestion is supported by the range and variation in slope values reported across different speakers in different studies (see Table 1 above). However, another possible source for the difference could be vowel context. The majority of vowels in the current study were high/front vowels. Some studies have systematically investigated the F2 locus equations of velar plosives as a function of vowel context (e.g. [
 ] palatal (front) versus [
 ] velar (back) vowel contexts) where shallower slopes for /ɡ/ have been reported for front/palatal vowel contexts compared to back/velar contexts (Fowler Reference Fowler1994; Sussman et al. Reference Sussman, Bessell, Dalston and Majors1997, Reference Sussman, Dalston and Gumbert1998). However, there is also evidence to suggest that vowel context also affects the F2 locus equation slopes of /bV/ sequences, and that /bV/ sequences in front vowel contexts have shallower slopes (e.g. approximately .65 – estimated from Figure 3 in Fowler Reference Fowler1994: 602) compared to those produced in back vowel contexts (approximately .8 – estimated from Figure 3 in Fowler Reference Fowler1994: 602). What is worth noting here is that the aforementioned slope value for the front vowel context (.65) is closer to the values reported in this study (.661 and .598 for males and females respectively).
The steeper slope for the male speakers found in this study is in line with McLeod et al. (Reference McLeod, Baillargeon, Metz, Schiavetti and Whitehead2001), who reported significantly steeper F2 locus equation slopes for male than female speakers (see also the trends reported by Löfqvist Reference Löfqvist1999). This suggests greater degrees of anticipatory coarticulation for male than for female speakers in the current study, as the F2 values at consonantal release were closer to and varied more systematically with the F2 values at vowel midpoint. The greater degree of anticipatory coarticulation for male speakers may be indicative of a different pattern of movement synchronisation; the data suggest that male speakers may have initiated the vowel gesture earlier than female speakers (Simpson Reference Simpson2003), which would also contribute to smaller absolute formant change values in speech stimuli of the current data set which predominantly consisted of high front vowels.
The current study examined /bV/ sequences which, in theory, allow for maximum degrees of coarticulation between the voiced bilabial plosive and the ensuing vowel due to the independence of the labial and lingual articulators. Therefore, in light of the predominantly high front vowels in the current data set, it might be argued that the results are not truly sex-specific differences in coarticulation, but merely consequences of differences in vowel space sizes between women and men. While there may be some degree of influence on the absolute formant change in F2 given the overall higher F2 values and their wider distribution for the female data, the latter of which may be caused by greater interharmonic spacing (e.g. Diehl et al. Reference Diehl, Lindblom, Hoemeke and Fahey1996, Simpson Reference Simpson2011), these effects are attenuated when analysing F2 locus equations. The higher F2 values at both vowel onset and midpoint are largely contextually preserved in F2 locus equations, but are removed when calculating the absolute formant change in F2. Higher F2 onset and F2 midpoint pairs for front vowels are represented as data points further along the linear regression line of the F2 locus equations, but do not affect the steepness of the slope (see Figure 2 above: the data points for the female speakers in the left panel are distributed further along the regression line towards the higher F2 values). As the F2 locus equations of this data set exhibited lower degrees of coarticulation for the women (shallower slope values), which complements the effect found in the absolute formant change in F2, this suggests that the effects reported for ΔF2 may be similarly attributed to sex-specific differences in coarticulation and are not exclusively a consequence of differences in vowel space sizes.
5 Conclusions
The sex differences previously reported in the literature were corroborated in the current study: although there was only weak support for the first hypothesis, men trended for shorter acoustic vowel durations (e.g. Whiteside Reference Whiteside1996, Simpson Reference Simpson2003), and this appeared to be interacting with vowel quality differences (e.g. Simpson & Ericsdotter Reference Simpson and Ericsdotter2003). In addition, women displayed significantly faster mean rates of formant change for F2 (e.g. Simpson Reference Simpson2001), and significantly lower degrees of coarticulation than men as indexed by ΔF2, normalised ΔF2, and shallower F2 locus equation slopes (e.g. McLeod et al. Reference McLeod, Baillargeon, Metz, Schiavetti and Whitehead2001, and see trends in Löfqvist Reference Löfqvist1999), thereby supporting both the second and third hypotheses. The sex differences in the formant frequency changes, and the higher levels of systematic variation between vowel onsets and vowel midpoints in the data were interpreted as being in part indicative of differences in the synchronisation of articulatory gestures: it was suggested that male speakers may initiate the vowel gesture earlier relative to the release of the consonant (see Simpson Reference Simpson2002, Reference Simpson2003). The predominantly high front vowels used in the current data set may also explain the significant sex differences found in this investigation. In order to further elucidate the role of factors such as sex-determined biological differences in the spectro-temporal dynamics of speech and in coarticulation, further systematic acoustic and articulatory investigations with a range of stimuli and phonetic contexts are warranted.