

INTRODUCTION
Down Syndrome (DS) and Fragile X syndrome (FXS) are the leading genetic causes of intellectual disability (Dykens, Hodapp & Finucane, Reference Dykens, Hodapp and Finucane2000). Approximately 1 in 733 infants are born with DS (Improved national prevalence estimates for 18 selected major birth defects – United States 1999–2001, 2006). Estimates of prevalence rates of FXS are as low as 1 in 4,000 males and 1 in 8,000 females (Crawford, Acuna & Sherman, Reference Crawford, Acuna and Sherman2001), but may be as high as 1 in 2,500 having the genetic mutation causing FXS (Fernandez-Carvajal, Walichiewicz, Xiaosen, Pan, Hagerman & Tassone, Reference Fernandez-Carvajal, Walichiewicz, Xiaosen, Pan, Hagerman and Tassone2009; P. Hagerman, Reference Hagerman2008). DS is caused by an extra copy of all or part of chromosome 21. FXS, an inherited disorder, is caused by an expansion of the sequence of trinucleotide (CGG) repeats included in the fragile X mental retardation 1 (FMR1) gene located on the X chromosome (R. J. Hagerman, Reference Hagerman2008). Because of their relatively high prevalence rates, unique genetic profiles and resulting intellectual disability, comparisons of the behavioral profiles of individuals with DS and FXS have frequently been made (e.g. Abbeduto et al., Reference Abbeduto, Murphy, Richmond, Amman, Beth, Weissman, Kim, Cawthorn and Karadottir2006; Brady, Bredin-Oja, Warren, Roberts, Chapman & Warren, Reference Brady, Bredin-Oja, Warren, Roberts, Chapman, Warren, Roberts, Chapman and Warren2008; Esbensen, Seltzer, Abbeduto, Roberts, Chapman & Warren, Reference Esbensen, Seltzer, Abbeduto, Roberts, Chapman, Warren, Roberts, Chapman and Warren2008; Flanagan, Enns, Murphy, Russo, Abbeduto, Randolph & Burack, Reference Flanagan, Enns, Murphy, Russo, Abbeduto, Randolph and Burack2007; Roberts, Martin, Moskowitz, Harris, Foreman & Nelson, Reference Price, Roberts, Vandergrift and Martin2007; Roberts, Stoel-Gammon, Barnes, Chapman & Warren, Reference Roberts, Stoel-Gammon, Barnes, Chapman, Warren, Roberts, Chapman and Warren2008). Such investigations increase understanding of behavioral strengths and weaknesses specific to a given syndrome for clinical purposes as well as help to specify similarities and differences of the behavioral consequences of particular genetic variations for theoretical purposes (Abbeduto, Murphy, Rice & Warren, Reference Abbeduto, Murphy, Rice, Warren, Rice and Warren2004).
Several comparisons of the language profiles of individuals with DS and those with FXS have been conducted. When controlling for non-verbal mental age, such study results frequently demonstrate significant language differences between children and adolescents with DS and those with FXS, with individuals with FXS outperforming those with DS; however, this finding is not consistent across studies. Therefore, it is unclear if these language differences are robust enough to establish distinct language phenotypes for these diagnostic groups. A better understanding of the similarities and differences of the phenotypes of FXS and DS will help decide whether researchers and clinicians should design and implement language intervention programs that are syndrome specific (Fidler & Nadel, Reference Fidler and Nadel2007). Phenotype comparisons also build our understanding of the genetic and neurobiological underpinnings of language development more generally (Rice, Warren & Betz, Reference Rice, Warren and Betz2005). The purpose of the present study was to examine group differences across five measures of expressive and receptive language and to determine the extent to which performance on these language measures reliably differentiates DS and FXS group membership.
In a study of individuals with language impairments, it is useful to dissect language into discrete components because relative strengths and weaknesses across components can distinguish between individuals or syndromes. Studies examining the language profiles of individuals with DS or FXS have included both receptive and expressive language measures and have focused on both language form (e.g. syntax, morphology) and content (e.g. vocabulary). Such studies have included comparisons of individuals with DS compared to individuals with typical development (TD), individuals with FXS compared to individuals with TD, and individuals with DS compared to those with FXS. As the following review indicates, distinct and reliable DS, FXS and TD language profiles have yet to emerge. Moreover, the greatest attention, and inconsistent findings, has characterized grammar and vocabulary. Thus, we focus in the present study on grammar and vocabulary rather than pragmatics.
DS and TD language comparisons
Compared to children with TD of similar mental age, studies have shown that individuals with DS demonstrate significant deficits in expressive language ability on measures of syntax and morphology. Specifically, children with TD outperform children and adolescents with DS on broad grammatical measures, such as mean length of utterance (MLU; Boudreau & Chapman, Reference Boudreau and Chapman2000; Chapman, Seung, Schwartz & Bird, Reference Chapman, Seung, Schwartz and Bird1998; Laws & Bishop, Reference Laws and Bishop2003; Price, Roberts, Hennon, Berni, Anderson & Sideris, Reference Price, Roberts, Hennon, Berni, Anderson and Sideris2008; Rosin, Swift, Bless & Kluppel Vetter, Reference Rosin, Swift, Bless and Kluppel Vetter1988), as well as more detailed and nuanced measures, such as the Index of Productive Syntax (IPSyn; Scarborough, Reference Scarborough1990; Price et al., Reference Price, Roberts, Hennon, Berni, Anderson and Sideris2008), Developmental Sentence Scoring (DSS; Lee, Reference Lee1974; Finestack & Abbeduto, Reference Finestack and Abbeduto2010), and probes of inflectional forms (Chapman et al., Reference Chapman, Seung, Schwartz and Bird1998; Eadie, Fey, Douglas & Parsons, Reference Eadie, Fey, Douglas and Parsons2002). This pattern of individuals with DS demonstrating poorer language skills compared to younger children with TD of similar non-verbal mental age, however, is not uniform across all studies. For example, Keller-Bell and Abbeduto (Reference Keller-Bell and Abbeduto2007) found no group differences in MLU and clausal density between adolescents with DS and younger children with TD matched on measures of non-verbal mental age. Similarly, Thordardottir, Chapman and Wagner (Reference Thordardottir, Chapman and Wagner2002) did not find differences between adolescents with DS and children with TD with similar MLUs on the proportion of complex sentences in their expressive narratives.
In terms of expressive vocabulary, DS and TD group differences frequently emerge, when controlling for non-verbal mental age, on broad measures, such as number of different words (Boudreau & Chapman, Reference Boudreau and Chapman2000) and total number of words (Boudreau & Chapman, Reference Boudreau and Chapman2000; Chapman et al., Reference Chapman, Seung, Schwartz and Bird1998) derived from language samples. Investigators have also identified significant group differences based on standardized expressive vocabulary tests, such as the Expressive Vocabulary Test (Williams, Reference Williams1997; Roberts, Price et al., Reference Price, Roberts, Vandergrift and Martin2007). However, other studies have not revealed significant differences in the expressive vocabularies of individuals with DS and those with TD. For example, using a standardized test, Laws and Bishop (Reference Laws and Bishop2003) found no significant differences between adolescents with DS and a younger non-verbal mental-age-matched TD group on the Expressive Vocabulary subtest of the Clinical Evaluation of Language Fundamentals Revised (Semel, Wiig & Secord, Reference Semel, Wiig and Secord1987).
The receptive syntactic and morphological abilities of individuals with DS generally have been found to be significantly weaker than those of individuals with TD of similar mental ages. Such differences have emerged on several different standardized measures, including the Miller–Yoder Language Comprehension Test (Miller & Yoder, Reference Miller and Yoder1984; Rosin et al., Reference Rosin, Swift, Bless and Kluppel Vetter1988), the Test for Auditory Comprehension of Language (Carrow-Woolfolk, Reference Carrow-Woolfolk1985; Abbeduto et al., Reference Abbeduto, Murphy, Cawthon, Richmond, Weissman, Karadottir and O'Brien2003; Price, Roberts, Vandergrift & Martin, Reference Price, Roberts, Vandergrift and Martin2007), and the Test for Reception of Grammar (Bishop, Reference Bishop1983; Joffe & Varlokosta, Reference Joffe and Varlokosta2007; Laws & Bishop, Reference Laws and Bishop2003). However, other studies have revealed no significant group differences. For example, in a study of five- to twenty-one-year-old children and adolescents with DS and two- to six-year-old children with TD matched on non-verbal mental age, Chapman, Shwartz and Kay-Raining-Bird (Reference Chapman, Schwartz and Kay-Raining Bird1991) found no significant group differences based on the Test for Auditory Comprehension of Language (Carrow-Woolfolk, Reference Carrow-Woolfolk1985).
Studies examining the receptive vocabulary of individuals with DS have also found mixed patterns. A large number of studies have found that individuals with DS have weaker receptive vocabularies than individuals with TD with similar non-verbal cognitive abilities (Hick, Botting & Conti-Ramsden, Reference Hick, Botting and Conti-Ramsden2005; Price et al., Reference Price, Roberts, Vandergrift and Martin2007; Roberts, Price et al., Reference Price, Roberts, Vandergrift and Martin2007). However, many other studies have found no significant differences between groups on similar measures, such as the Peabody Picture Vocabulary Test – Revised (Dunn & Dunn, Reference Dunn and Dunn1981; Chapman et al., Reference Chapman, Schwartz and Kay-Raining Bird1991; Rosin et al., Reference Rosin, Swift, Bless and Kluppel Vetter1988) and the British Picture Vocabulary Test II (Laws & Bishop, Reference Laws and Bishop2003). In summary, all components of language are delayed relative to age expectations in DS; however, the extent of delays across components and relative to cognitive level is not clear.
FXS and TD language comparisons
Few studies have examined the expressive syntactic and morphological language abilities of individuals with FXS in comparison to appropriately matched children with TD. Of the studies that have been conducted, some indicated that individuals with FXS have significantly poorer expressive skills than younger children with TD with similar non-verbal mental ages. This pattern has emerged on both broad and detailed grammatical measures derived from conversational language samples, such as MLU and IPSyn scores (Price et al., Reference Price, Roberts, Hennon, Berni, Anderson and Sideris2008; Roberts, Hennon, Price, Dear, Anderson & Vandergrift, Reference Roberts, Hennon, Price, Dear, Anderson and Vandergrift2007). However, in a pair of studies (Finestack & Abbeduto, Reference Finestack and Abbeduto2010; Keller-Bell & Abbeduto, Reference Keller-Bell and Abbeduto2007) which focused largely on the same sample of older individuals with FXS, aged twelve to twenty-four years, and younger non-verbal mental-age-matched children with TD, no significant group differences were found on grammatical measures derived from narrative language samples, including MLU, rate of grammatical utterances, clause density, and mean number of causal and conditional connectors.
In terms of expressive vocabulary, when controlling for non-verbal mental age and maternal education levels, investigators have found significant FXS and TD group differences based on broad measures of vocabulary, such as number of different words (Price et al., Reference Price, Roberts, Hennon, Berni, Anderson and Sideris2008), characterized by the TD group outperforming the FXS group. However, other studies (e.g. Roberts, Price et al., Reference Price, Roberts, Vandergrift and Martin2007) have failed to find significant group differences in expressive vocabulary ability on standardized tests such as the Expressive Vocabulary Test (Williams, Reference Williams1997).
Three studies have focused on the receptive language abilities of individuals with FXS in comparison to children with TD of similar non-verbal cognitive ability. Two of these studies examined performance on the Test for Auditory Comprehension of Language (TACL; Carrow-Woolfolk, Reference Carrow-Woolfolk1985; Reference Carrow-Woolfolk1999b), which includes two subtests focused on grammatical comprehension and one on vocabulary comprehension; however, the results were inconsistent across studies. In one study (Price et al., Reference Price, Roberts, Vandergrift and Martin2007), which included three- to sixteen-year-old boys with FXS and three- to nine-year-old boys with TD, significant group differences emerged on each of the TACL subtests, when controlling for non-verbal mental age. In a study by Abbeduto et al. (Reference Abbeduto, Murphy, Cawthon, Richmond, Weissman, Karadottir and O'Brien2003), however, no differences on the three TACL subtests emerged between adolescents and adults with FXS and three- to six-year-old children with TD matched on non-verbal mental age. The third study, which was conducted by Roberts and her colleagues (Roberts, Price et al., Reference Price, Roberts, Vandergrift and Martin2007) included one standardized measure of receptive vocabulary, the Peabody Picture Vocabulary Test – Third Edition (Dunn & Dunn, Reference Dunn and Dunn1997). In the Roberts, Price et al. study, which included three- to fifteen-year-old boys with FXS and two- to seven-year-old children with TD of similar non-verbal mental age, no significant group differences were found.
DS and FXS language comparisons
Studies that have directly compared the expressive grammatical language abilities of individuals with DS and those with FXS, while controlling for non-verbal mental age, generally have not revealed significant group differences on either broad (e.g. MLU, number of different words) or more targeted (e.g. IPSyn) measures of morphological and syntactic form (Finestack & Abbeduto, Reference Finestack and Abbeduto2010; Keller-Bell & Abbeduto, Reference Keller-Bell and Abbeduto2007; Price et al., Reference Price, Roberts, Hennon, Berni, Anderson and Sideris2008). However, Price and colleagues (Reference Price, Roberts, Hennon, Berni, Anderson and Sideris2008) did find that boys aged two to fifteen years with FXS outperformed boys aged four to sixteen years with DS on MLU and IPSyn measures derived from conversational language samples. Additionally, Keller-Bell and Abbeduto (Reference Keller-Bell and Abbeduto2007) and Finestack and Abbeduto (Reference Finestack and Abbeduto2010) each found that adolescents and young adults with FXS produced proportionally more grammatically correct utterances than did participants with DS who were matched on age and non-verbal cognitive ability.
The only study to compare the expressive vocabulary skills of individuals with DS and those with FXS was conducted by Roberts, Price et al. (Reference Price, Roberts, Vandergrift and Martin2007). In this study, performance of four- to sixteen-year-old boys with DS and two- to fifteen-year-old boys with FXS of similar non-verbal mental ages were compared using the Expressive Vocabulary Test (Williams, Reference Williams1997). No statistically significant group differences emerged between the groups.
Studies comparing the receptive language abilities of individuals with DS and those with FXS have included both grammatical and vocabulary measures (Abbeduto et al., Reference Abbeduto, Murphy, Cawthon, Richmond, Weissman, Karadottir and O'Brien2003; Price et al., Reference Price, Roberts, Vandergrift and Martin2007). These studies based their comparisons on the Test for Auditory Comprehension of Language (TACL: Carrow-Woolfolk, Reference Carrow-Woolfolk1985; Reference Carrow-Woolfolk1999b). In the Abbeduto et al. study, the adolescents and young adults with FXS significantly outperformed the adolescents with DS on the grammatical subtests, with no group differences on the vocabulary subtest. Price et al. (Reference Price, Roberts, Vandergrift and Martin2007) found that boys aged four to sixteen years with FXS outperformed boys within the same age range with DS on all of the TACL subtests, including vocabulary. Thus, it appears that individuals with FXS also have stronger receptive grammatical language abilities than do individuals with DS, but their relative abilities in receptive vocabulary are less clear.
The reviews of the DS, FXS and TD group comparisons suggest that no single domain consistently reveals group differences, and thus the data remain equivocal as to whether there are syndrome-specific language profiles. Inconsistencies across studies, however, may be due to a number of factors, including differences in the ages of the participants, the specific measures examined, and the context in which language is assessed (e.g. conversation or narration). It is also important to note, however, that no single study examining the language profiles of these groups has included measures representing all of the language domains discussed. Thus, the current study was designed to provide a more comprehensive assessment and determine whether there are particular language factors, when considered together, that distinguish the language profiles of older, verbally expressive, children and adolescents with DS and older, verbally expressive, children and adolescents with FXS from each other and from younger TD children, after controlling for non-verbal mental age. Specifically, this study was designed to answer the following two questions:
1. Do the DS, FXS and TD diagnostic groups differ on the dimensions of expressive and receptive grammar and vocabulary?
2. Do these language dimensions coalesce into profiles of impairment that reliably distinguish the diagnostic groups?
METHOD
Participants
The seventy-three participants included in this study were selected from a larger pool of 140 individuals participating in a longitudinal language study involving verbal children and adolescents with DS, verbal children and adolescents with FXS, and younger children with TD. The participants with DS primarily were recruited locally using a university-based registry of families with a son or daughter with a developmental disability and mailings to special educators and genetic clinics. Due to the lower prevalence of FXS in comparison to DS, the participants with FXS were primarily recruited nationally through newspaper advertisements in selected large urban areas, advertisements on nationally syndicated radio shows, and postings in newsletters and on Internet websites of regional and national disability advocacy organizations. For the most part, participants with TD were recruited locally through public postings, a university-based registry, and area preschools. Several analyses of the data from the larger study have been published (e.g. McDuffie et al., Reference McDuffie, Abbeduto, Lewis, Kover, Kim, Weber and Brown2010; McDuffie, Kover, Abbeduto, Lewis & Brown, Reference McDuffie, Kover, Abbeduto, Lewis and Brown2012; Pierpont, Richmond, Abbeduto, Kover & Brown, Reference Pierpont, Richmond, Abbeduto, Kover and Brown2011).
Participants were included in the present study if they completed each of the study measures of interest, did not meet study criteria for autism spectrum disorder, came from a home in which English was the only language spoken, and passed a hearing screening. More specifically, each participant was required to have completed the following assessments: the Brief IQ subtests of the Leiter International Performance Scale-Revised (Leiter-R: Roid & Miller, Reference Roid and Miller1997), the Peabody Picture Vocabulary Test – Third Edition (PPVT-3: Dunn & Dunn, Reference Dunn and Dunn1997), the Expressive Vocabulary Test – Second Edition (EVT-2: Williams, Reference Williams2007), the Test for Reception of Grammar – 2 (TROG-2: Bishop, Reference Bishop1983), the Syntax Construction subtest of the Comprehensive Assessment of Spoken Language (CASL-SC: Carrow-Woolfolk, Reference Carrow-Woolfolk1999a), a conversational language sample, and a hearing screening. A primary caregiver also had to have completed a demographic questionnaire. Participants were evaluated for autism using the Autism Diagnostic Observation Schedule (ADOS: Lord, Rutter, DiLavore & Risi, Reference Lord, Rutter, DiLavore and Risi2002) and the Autism Diagnostic Interview – Revised (ADI-R: Lord, Rutter & Le Couteur, Reference Lord, Rutter and Le Couteur1994). Participants who met diagnostic criteria for autism on both instruments were excluded from the current analyses. To pass the hearing screening, which was conducted by graduate students in audiology under the supervision of a licensed audiologist, participants had to have a mean pure-tone threshold across 500, 1000, 2000 and 4000 Hz of 30 dB or below in at least one ear. Additionally, because we wanted to limit variability in cognitive ability within and across study groups, all participants were required to have a non-verbal mental age (on the Leiter Brief IQ subtests) greater than three years and less than or equal to 6·5 years. This mental age range ensured we included the greatest number of participants from the three groups that were well matched. A total of sixty-seven participants were excluded for not meeting these criteria as follows: incomplete data (due to reasons such as fatigue, refusal to cooperate, and scheduling difficulties) – sixteen participants; met criteria for autism – eleven participants; language other than English spoken – one participant; non-verbal mental age greater than 6·5 years – thirty-nine participants.
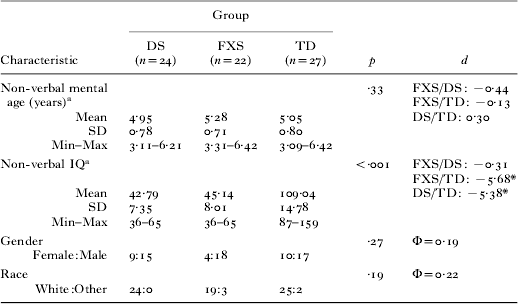
Of the seventy-three participants included in the present analysis, twenty-four were children and adolescents with DS (9 female; 15 male), twenty-two were children and adolescents with FXS (4 female; 18 male), and twenty-seven were children with TD (10 female; 17 male). The mean ages of the participants within each group were: DS: 12·83 years (range = 10·28–15·54 years); FXS: 12·83 years (range = 10·18–16·01 years); and TD: 4·65 years (range = 3·11–6·77 years). Table 1 presents the participant characteristics according to diagnostic group. Analyses of variance (ANOVA) and follow-up t-tests comparing the groups' mean non-verbal mental ages revealed no significant group differences. However, the p-values for non-verbal mental age did not exceed the 0·50 level (Mervis & Robinson, Reference Mervis, Robinson, Levy and Schaeffer2003). Because non-verbal mental age was considered a key matching variable (see Price et al., Reference Price, Roberts, Hennon, Berni, Anderson and Sideris2008), we controlled for this variable in our statistical analyses. Anticipated group differences were found for non-verbal IQ standard scores, with the children with TD having higher scores than either the DS or the FXS group. Chi-square analyses of group differences based on gender and race yielded no significant group differences.
Participant characteristics according to diagnostic group
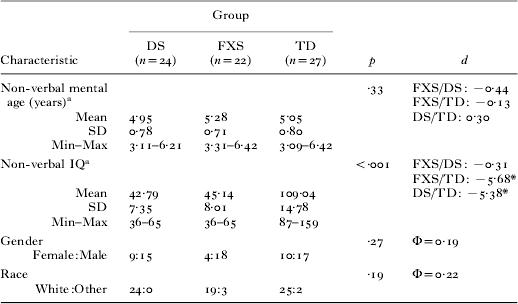
a Based on the Leiter-R (Roid & Miller, Reference Roid and Miller1997); *significant difference.
Although cognitive and language differences between males and females have been noted in FXS, with males with FXS being more consistently and severely affected (see Abbeduto, Brady & Kover, Reference Abbeduto, Brady and Kover2007), both males and females were included in the present study to maximize statistical power. The chronological age range (10·18–12·51 years) and non-verbal mental age range (4·88–5·92 years) of the four females with FXS were well within the ranges of the boys with FXS.
Based on genetic test results provided by parents, DS was due to trisomy 21 for eighteen of the participants with DS and to translocation for four others. Genetic testing results were not available to the project for three participants with DS, although each parent indicated that genetic testing had been completed confirming the DS diagnosis. For seventeen of the participants with FXS, molecular genetic testing revealed that they had the full mutation; four others were identified as mosaic. For five participants with FXS, genetic results were not available, but a positive FXS genetic test was confirmed by the parents.
Procedures
Prior to being enrolled in the study, parents of all participants signed informed consent forms approved by a university institutional review board. Trained examiners completed all testing in quiet testing rooms at a university research center. For most participants, testing was completed in three sessions that occurred across two or three days. As needed, participants were provided breaks within sessions and between sessions.
Study measures
The following measures were administered to all participants as part of a more comprehensive protocol administered in the larger project.
Non-verbal intelligence
To help determine if a participant met the study inclusionary criteria, non-verbal intelligence was assessed using the Leiter-R Brief IQ Screener (Roid & Miller, Reference Roid and Miller1997). Four subtests comprise the Brief IQ Screener: (a) Figure Ground, (b) Form Completion, (c) Sequential Order, and (d) Repeated Patterns. To determine non-verbal mental age, the age equivalents associated with each of the four subtests were averaged for each participant.
The five measures that were used for the primary study analyses were two receptive language measures and three expressive language measures. The receptive measures were one measure of vocabulary (PPVT-3: Dunn & Dunn, Reference Dunn and Dunn1997) and one measure of grammar (TROG-2: Bishop, Reference Bishop1983). The expressive measures were one measure of vocabulary (EVT-2: Williams, Reference Williams2007), the CASL-SC (Carrow-Woolfolk, Reference Carrow-Woolfolk1999a) and two measures of grammar (Mean Length of Utterance, CASL-SC: Carrow-Woolfolk, Reference Carrow-Woolfolk1999a). Each of these measures is described below.
Receptive language
The PPVT-3 (Dunn & Dunn, Reference Dunn and Dunn1997) and TROG-2 (Bishop, Reference Bishop1983) were used to assess receptive language ability. In the PPVT-3, which assesses receptive vocabulary, participants were required to select for each item one of four drawings that best matched the target word orally provided by the examiner. For the PPVT-3, raw scores based on correct responses were used in the study analyses. The TROG-2 was used to assess participants' receptive grammar abilities. For the TROG-2, participants were required to select for each item one of four drawings that matched a sentence spoken by the examiner. TROG-2 items were designed to assess the understanding of grammatical contrasts marked by inflections, function words and word order. The eighty items are grouped in blocks of four. The number of blocks passed (i.e. all items within a block answered correctly) was used for study analyses.
Expressive language
Expressive language ability was measured using the EVT-2 (Williams, Reference Williams2007), the CASL-SC (Carrow-Woolfolk, Reference Carrow-Woolfolk1999a), and mean length of utterance (MLU) based on a conversational language sample. The EVT-2 is a standardized test designed to examine expressive vocabulary. In the EVT-2, participants were asked to orally label drawings or provide one-word responses to oral prompts associated with a drawing. The CASL-SC (Carrow-Woolfolk, Reference Carrow-Woolfolk1999a) assesses expressive grammatical language by requiring participants to repeat, complete or formulate sentences using a variety of morphosyntactic rules in response to a drawing and oral prompt (e.g. ‘Listen carefully and say exactly what I say. This dog is little.’; ‘Finish what I say. These boys are swimming. These …’). Examinees receive 1 point for correct items and 0 points for incorrect responses. For both the EVT-2 and the CASL-SC, raw scores based on correct responses were used in the study analyses.
A 12-minute conversational language sample was obtained from each participant. During the conversation, the examiner used a standard set of prompts to encourage the participant to discuss several topics including school, teachers, after school routines/activities, pets, sports, games, friends, vacations and hobbies. Examiners were instructed to avoid asking questions yielding simple one-word responses with the aim to elicit rich, uninterrupted conversations from the participants. Each participant's conversation was audiotaped and later transcribed by trained research assistants using standard Systematic Analysis of Language Transcripts conventions (SALT: Miller & Chapman, Reference Miller and Chapman2000). Utterances were segmented into communication units (C-units), which include an independent clause and its modifiers (Loban, Reference Loban1976). Each conversation was transcribed by a primary coder and checked by a secondary coder who listened to the audiotape while viewing the original transcript and marked transcription disagreements. The primary coder reviewed the disagreements and made final corrections by checking discrepancies against the audiotape. SALT was used to calculate the MLU for each transcript.
Seven (10%) of the conversational transcripts were randomly selected and transcribed by an independent coder for reliability purposes. These transcripts included three from the DS participants, three from the FXS participants, and one from the TD participants. The independent coder's transcripts were compared to the primary coders' original transcripts. The mean percent agreement was 90% (range = 78–99%) for utterance segmentation, 86% (range = 72–97%) for number of bound morphemes per utterance, and 87% (range = 74–97%) for number of words per utterance.
Additionally, the scoring of all test protocols was checked by two examiners and all data entry was double-checked by two research assistants.
Statistical design
To examine the language profiles of children and adolescents with DS and children and adolescents with FXS, two sets of statistical analyses were completed. In the first set, a separate analysis of covariance (ANCOVA) was completed for each of the five language measures of interest. In these analyses, diagnostic group (i.e. DS, FXS and TD) served as the independent variable. Non-verbal mental age served as the covariate. The dependent measures were the PPVT-3, EVT-2 and CASL-SC raw scores, the number of blocks passed on the TROG-2, and conversational MLU. To help meet the statistical assumptions of normality and homogeneity of variance, natural logarithmic transformations were applied to the TROG-2, EVT-2 and CASL-SC measures. Significant ANCOVAs (p < ·05) were followed by Bonferroni-corrected contrasts. Effect sizes (d) were calculated and interpreted using Cohen's standards of 0·20 to represent a small effect size, 0·50 a medium effect size, and 0·80 a large effect size (Cohen, Reference Cohen1988).The analyses addressed our first research question.
In the second set of analyses, a discriminant function analysis (DFA) was conducted. The goal of the DFA was to test the extent to which the predictor variables (i.e. scores from the PPVT-3, TROG-2, EVT-2, CASL-SC and Conversational MLU), predicted group membership (i.e. DS, FXS and TD). Mathematically, DFA is the same as a multivariate analysis of variance (MANOVA); however, the emphasis of interpretation is different. Results from the DFA allowed us to evaluate the adequacy of group classification as well as analyze the pattern of differences among the predictor variables to better understand the language dimensions that are most sensitive to diagnostic group differences (Tabachnick & Fidell, Reference Tabachnick and Fidell2001). These analyses addressed our second research question.
RESULTS
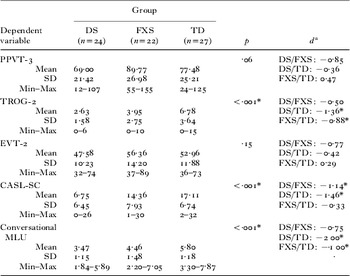
Tables 2 and 3 present the bivariate correlations and the means, standard deviations and ranges for the dependent measures, respectively. The covariate, non-verbal mental age, was significantly related to the participants' performance on the PPVT-3 (F(1,69) = 48·78, p < ·001), as well as the EVT-2 (F(1,69) = 31·45, p < ·001). Moreover, there was not a significant effect for diagnostic group after controlling for non-verbal mental age for the PPVT-3 (F(2,69) = 3·01, p = ·06), or the EVT-2 (F(2,69) = 1·96, p = ·15). For the remaining measures, the covariate was significantly related to the participants' performance (TROG-2: F(1,69) = 32·91, p < ·001; CASL-SC: F(1,69) = 27·76, p < ·001; MLU: F(1,69) = 19·44, p < ·001); however, there was a significant effect for diagnostic group on all three measures after controlling for non-verbal mental age (TROG-2: F(2,69) = 16·21, p < ·001; CASL-SC: F(2,69) = 18·46, p < ·001; MLU: F(2,69) = 26·60, p < ·001). For both the TROG-2 and MLU, the group effect was characterized by the TD group significantly outperforming both the DS and FXS groups. For the CASL-SC, the group effect was characterized by both the TD and FXS groups significantly outperforming the DS group.
Pearson bivariate correlations of the dependent study measures*

* All correlations significant, ps < ·001.
Unadjusted Ms, SDs, and minimum–maximum values; ANCOVA p-values; and effect sizes for diagnostic group comparisons

a TROG-2, EVT-2 and CASL-SC calculations based on transformed values; *statistically significant with Bonferroni correction.
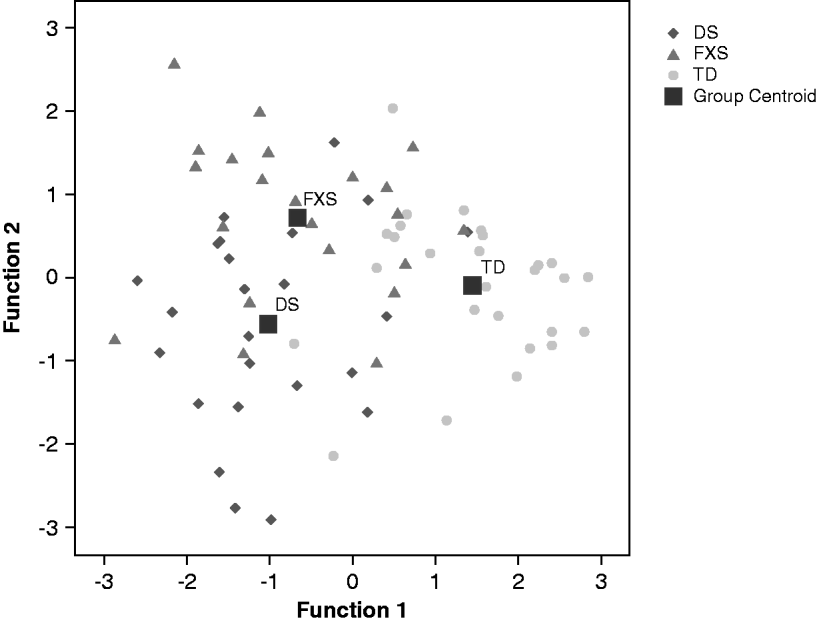
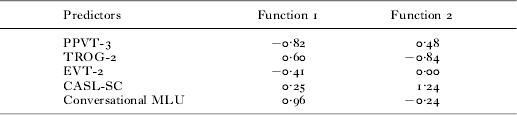
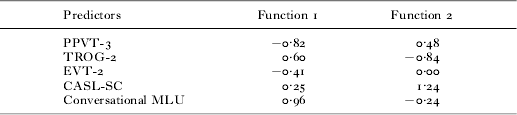
The DFA resulted in two discriminant functions. The first function explained 82·4% of the variance, canonical R 2 = ·57. The second function explained 17·6% of the variance, canonical R 2 = ·22. Combined, the two functions significantly differentiated the diagnostic groups (Λ = 0·34, Χ2(10) = 73·25, p < ·001). Additionally, when the first function was removed, the second function also significantly discriminated the groups (Λ = 0·78, Χ2(4) = 16·66, p = ·002). Thus, it is necessary to interpret both functions. The correlation coefficients for the two functions are displayed in Table 4 and reveal that the strongest relationships with Function 1 involved Conversational MLU (positive relationship) and the PPVT-3 (negative relationship) and that the strongest relationships with Function 2 involved the CASL-SC (positive relationship) and the TROG-2 (negative relationship). Figure 1 displays the discriminant function plot. Based on the plot, Function 1 discriminated the TD group from both the DS and FXS groups, and Function 2 discriminated the FXS group from the TD and DS groups. When using the functions to predict group membership, 71·2% of the participants were classified correctly (66·7% of DS, 63·6% of FXS, and 81·5% of TD), with a moderate kappa coefficient value of 0·57. The nature of the misclassifications were as follows: of the twenty-four participants with DS, six were misclassified as FXS and two were misclassified as TD; of the twenty-two participants with FXS, four were misclassified as DS and four were misclassified as TD; and of the twenty-seven participants with TD, two were misclassified as DS and two were misclassified as FXS.
Discriminant function plot.

Correlations of the predictor variables with the discriminant functions
In general, research indicates that males with FXS are more consistently and severely affected than females with FXS on measures of neurocognitive functioning, including language ability (see Abbeduto et al., Reference Abbeduto, Brady and Kover2007). This heterogeneity is due in part to X chromosome inactivation in females. Thus, to eliminate the influence of gender on study results, we reran each study analysis omitting the four girls with FXS. Results of the ANCOVA analyses and the DFA were identical when the girls with FXS were omitted from the analyses. Due to decreased heterogeneity in the FXS sample and a reduction in the sample size, the classification accuracy rates decreased slightly such that 69·6% of the participants were classified correctly (58·3% of DS, 61·1% of FXS, and 85·2% of TD) when the girls with FXS were eliminated. Relative to the analysis that included the girls with FXS, the classification status of two participants with DS incorrectly changed from DS to FXS, the status of one participant with FXS incorrectly changed from FXS to TD, and the status of one participant with TD correctly changed from FXS to TD.
DISCUSSION
The overarching goal of this study was to investigate the language profiles of verbally expressive children and adolescents with DS and verbally expressive children and adolescents with FXS. The ANCOVAs revealed that the FXS group significantly outperformed the DS group on the CASL-SC measure. Additionally, significant differences were found between the TD and DS groups on the TROG-2, CASL-SC and Conversational MLU measures, with the TD group outperforming the DS group. Significant group differences were found between the TD and FXS groups on the TROG-2 and Conversational MLU, with the TD group demonstrating a higher mean than the FXS group. There were no significant group differences on either measure of vocabulary, EVT-2 and PPVT-3, after controlling for non-verbal IQ. Thus, it is clear that to the extent that there are different language profiles across the diagnostic groups, and the differences are defined solely by variations in grammatical language abilities.
In contrast to the present findings, when controlling for mental age, Roberts et al. (Reference Roberts, Hennon, Price, Dear, Anderson and Vandergrift2007) reported significant delays in both expressive and receptive vocabulary in children with DS on the same standardized measures used in the current study. The participants in the current study, however, were on average four years older than the children in the Roberts et al. (Reference Roberts, Hennon, Price, Dear, Anderson and Vandergrift2007) study: twelve years compared to eight years. It is possible that individuals with DS continue to acquire vocabulary and ‘catch up’ during the adolescent and young adult years. Findings of other studies support this explanation (Abbeduto et al., Reference Abbeduto, Murphy, Cawthon, Richmond, Weissman, Karadottir and O'Brien2003; Chapman et al., Reference Chapman, Schwartz and Kay-Raining Bird1991), although longitudinal data are required for confirmation. For the FXS group, the vocabulary results from the current study align closely with previous studies (Price et al., Reference Price, Roberts, Hennon, Berni, Anderson and Sideris2008; Roberts, Price et al., Reference Price, Roberts, Vandergrift and Martin2007) in which no significant group differences have been found.
The participants with DS demonstrated significant weaknesses on each measure of grammar compared to the children with TD, even after controlling for non-verbal mental age. These findings are consistent with those from previous studies (e.g. Chapman et al., Reference Chapman, Seung, Schwartz and Bird1998; Finestack & Abbeduto, Reference Finestack and Abbeduto2010; Price et al., Reference Price, Roberts, Hennon, Berni, Anderson and Sideris2008). In contrast, the participants with FXS demonstrated significant weaknesses relative to the participants with TD on the receptive grammar measure and one of the expressive grammar measures, conversational MLU. Interestingly, on the other measure of expressive grammar, the CASL-SC, the FXS group did not perform significantly differently from the children with TD and outperformed their peers with DS. Many individuals with FXS have difficulties with anxiety, especially social anxiety (Bregman, Leckman & Ort, Reference Bregman, Leckman and Ort1988; Mazzocco, Baumgardner, Freund & Reiss, Reference Mazzocco, Baumgardner, Freund and Reiss1998). Thus, social anxiety may have limited the linguistic performance of the participants with FXS in the socially demanding and dynamic context of a conversation, whereas the rather asocial and highly structured nature of the CASL-SC allowed their syntactic capabilities to emerge more clearly. Previous studies are consistent with this explanation (Abbeduto et al., Reference Abbeduto, Murphy, Cawthon, Richmond, Weissman, Karadottir and O'Brien2003; Roberts, Hennon et al., Reference Roberts, Hennon, Price, Dear, Anderson and Vandergrift2007). In contrast to FXS, individuals with DS appear to be less sensitive to task differences as regards syntactic performance.
To gain a fuller understanding of the differences in language profiles across diagnostic groups and to examine which dimensions of language were most discriminating, we conducted a DFA. The DFA resulted in two significant functions. The measures that correlated most highly with the first function included Conversational MLU and the TROG-2; thus, this function seems to reflect both expressive and receptive grammatical ability. The remaining measures (CASL-SC, EVT-2 and PPVT-3) correlated strongly with Function 2. Although the CASL-SC is a measure of expressive grammar, it is highly dependent on vocabulary knowledge. In fact, both the PPVT-3 and the EVT-2 had moderate associations with the CASL-SC (both rs = 0·65). Therefore, Function 2 appears to strongly reflect vocabulary as well as some aspects of expressive grammar.
In terms of predicting group membership, the DFA correctly classified approximately 70% of the sample. Function 1 differentiated the children with TD from the two groups of individuals with disabilities, whereas Function 2 differentiated the FXS group from the other two groups. Thus, these results are consistent with those of the ANCOVAs. Syntactic deficits characterize both syndrome groups and distinguish them from non-verbal mental-age-matched TD group. However, the participants with FXS are better able than their DS peers to manage the syntactic demands of expressive tasks that are highly structured, minimally social, and highly dependent on vocabulary knowledge. Note that the differences between the FXS and DS groups was slightly diminished when girls with FXS were excluded, reflecting the fact that girls with FXS are somewhat more syntactically skilled than males with FXS or individuals with DS.
This study has several important implications for clinical practice and future research directions. The potential impact of social anxiety on the language abilities of children and adolescents with FXS is highlighted by these findings. Although conversation-based language samples are an important target for treatment, their highly social and dynamic nature may render them a less effective means for assessment of the upper bounds of syntactic competence in this population. This is not necessarily the case for children and adolescents with DS, who demonstrate significant delays across measures of receptive and expressive grammar. Both receptive and expressive measures of grammar are a significant weakness in DS, and need continued and targeted treatment. It is important to note that our study included only verbal individuals, and does not inform clinical practice for non-verbal individual with FXS or DS. It is important for future studies to consider the language profiles of non-verbal individuals with DS and those with FXS.
Although this study examined a range of measures, including both receptive and expressive measures of form and content, no measures of pragmatic language were included. In comparison to mental-aged-matched peers, weaknesses in pragmatic skills (i.e. use of language) of children with FXS across conversational, narrative and informative contexts have been noted (Finestack, Richmond & Abbeduto, Reference Finestack, Richmond and Abbeduto2009). Moreover, examinations of pragmatic skills across diagnostic groups have yielded significant group differences. For example, Keller-Bell and Abbeduto (Reference Keller-Bell and Abbeduto2007) found that in comparison to adolescents with DS of similar mental age, adolescents with FXS produced fewer different types of narrative evaluation devices. In another study, Roberts and her colleagues (Roberts, Martin et al., Reference Roberts, Martin, Moskowitz, Harris, Foreman and Nelson2007) found that boys with both FXS and autism produced significantly more utterances that failed to facilitate conversation than boys with FXS. Thus, there are measures of pragmatic language that are sensitive to detecting diagnostic differences between individuals with FXS and other diagnoses as well as within individuals with FXS. Future studies should examine if the inclusion of pragmatic language measures increases the accuracy of classification and better defines the language dimensions that characterize FXS and DS relative to grammatical ability and vocabulary.
We excluded individuals with both FXS and autism in the current analyses. Given that 25% or more of individuals with FXS meet the criteria for a co-diagnosis of autism (Harris et al., 2008), investigations specifically examining individuals co-diagnosed with FXS and autism will need to be conducted. Research has indicated that children with both FXS and autism generally have lower language skills compared to children with FXS and no autism (Bailey, Mesibov, Hatton, Clark, Roberts & Mayhew, Reference Bailey, Mesibov, Hatton, Clark, Roberts and Mayhew1998; Rogers, Wehner & Hagerman, Reference Rogers, Wehner and Hagerman2001), although the impact of autism on the language phenotype is unclear. Future work including children with both FXS and autism will help to define the language phenotype in FXS, and guide practitioners and researchers in best methods for assessment and treatment.
Although our sample size was in line with research on children and adolescents with DS and FXS, larger sample sizes would allow for more sophisticated analyses, and greater generalizability of findings. Nevertheless, a linguistic profile of strengths and weaknesses for grammar and vocabulary emerged for the two groups of children in this study. In this study, receptive and expressive vocabulary maintained pace with non-verbal mental age. However, receptive grammar emerged as a significant weakness for both groups, and expressive grammar as a weakness for individuals with DS. The results for the group with FXS as regards expressive syntax depend on the type of assessment and could be influenced by the children's social anxiety.
From a neurobiological and theoretical perspective, results from this study support the view that there is some independence between the development of language and cognition (Rice et al., Reference Rice, Warren and Betz2005). Despite the inclusion of non-verbal mental age as a covariate in this study, unique language profiles emerged based on the FXS, DS and TD diagnostic groups included in this study. Thus, it appears that the genetic differences across groups lead to differences in language development that go beyond general level of cognitive development. However, DS and FXS also differ in their profiles of cognitive impairment and these may relate to and help explain the differences in language we observed. Thus, to fully understand the cognitive and language consequences of genetic differences, future studies will need to include more nuanced measures of non-verbal cognition and language. Nevertheless, the present study provides evidence of the value of documenting syndrome difference in language so that the pathways from genes to language can be illuminated.