I. INTRODUCTION
The development of human society has been sustained by the intensive use of artificial materials, which resulted in a huge consumption of energy and natural resources. In this context, the continuous search for faster and efficient methods of synthesis, combining concepts of green chemistry to obtain better products, led to the development of new synthetic routes and new precursors for the synthesis of advanced materials. Reference Yoshimura1–Reference Chandler, Roger and Hampdem-Smith5
Traditionally, researchers are looking for new materials or new properties. However, there are still reasons for the development of new precursors with additional advantages for the synthesis of old and well-studied materials. The search for a completely new compound, property or application, is time consuming and sometimes, it is necessary to take in account some indispensable serendipity. Reference Esch and Feringa6 However, all synthetic materials exhibit something that can be called as “processing memory,” defined as a set of unique characteristics that results from the processing choices. For this reason, the precursor selected is strategic to obtain the desired final characteristics, e.g., a metastable phase, a well-tuned property, or a specific morphological shape. All these properties can be obtained, or even improved, by a correct set-up in the synthesis conditions, which often include a unique starting compound, an appropriate intermediate phase, or the entire design of a complex alternative route of synthesis.
In the special case of oxides, for thousands of years, the most widely method used for the synthesis of solid materials was the direct reaction of oxides or carbonates. However, because the final properties of compounds obtained by this route depend crucially upon composition, homogeneity, and microstrutucture of the starting precursors, new synthetic techniques were designed to act at the molecular or atomic level. Reference Kakihana3–Reference Chandler, Roger and Hampdem-Smith5
These new synthetic techniques that usually start from a solution, or use a solution in one of the stages of the procedure, were conveniently called “wet chemical methods” (WetChem). As pointed out by Kakihana, Reference Kakihana3 solution chemistry plays two important roles in the field of WetChem processing of fine materials: (i) the possibility of low-temperature synthesis of highly pure substances and (ii) the development of techniques for the fabrication of different and useful shapes. Of course, the main consequence of a synthesis at low temperature is the reduction of the consumption of energy, but it also results in a major control of the synthesis processing and control of the material properties.
Each WetChem technique shows advantages and disadvantages. For instance, the synthesis may require expensive or too sensitive starting chemicals that need special care, the use of complex experimental apparatus, the use of relatively toxic solvents, or excessive amounts of subproducts, etc; such considerations are often sufficient reason to make the synthesis not viable. Moreover, even when a WetChem route is successfully used in the synthesis of a specific material, it cannot be directly applied to obtain another compound. To solve this problem of nontransferability, it was necessary to develop new routes tailored for specific cases. One of these special routes was the OPM used for the synthesis of lead- and bismuth-based oxides, Reference Camargo and Kakihana7 derived from the traditional peroxide-based route (PBR).
There are only a few studies concerning PBR, which was first developed by Kubo Reference Kubo8 and later modified by others Reference Yamanaka, Oakamoto, Kidou and Kudo9,Reference Hinokuma, Kisjhimoto and Kudo10 to obtain WO3 and MoO3 thin films. This technique consists of the direct reaction of metal with hydrogen peroxide, resulting in a clear solution of peroxo complexes. Safari et al. Reference Safari, Lee, Halliyal and Newham11 reported the synthesis of lead titanate powders by the PBR method through an amorphous precipitate, whereas Pfaff Reference Pfaff12,Reference Pfaff13 used a different approach to prepare a large number of alkaline earth titanates, stannates, and zirconates through the thermal decomposition of a stoichiometric precursor precipitated at elevated pH. Wang and Hu, however, reported the fabrication of TiO2 Reference Wang and Hu14 and WO3-TiO2 Reference Wang, Hu and Helmerson15 thin films using a peroxo-polytitanic acid solution synthesized from the addition of titanium tetrabutoxide into a diluted solution of H2O2.
In spite of small differences in these cited studies, usually all the experiments started from an aqueous solution of peroxo complexes synthesized from the reaction between hydrogen peroxide solution and a metal, halides salts, or metal alkoxides, which were precipitated by changing the pH.
II. THE OXIDANT PEROXO METHOD
A new approach of the PBR method, called the “oxidant peroxo method,” or simply OPM, has been proposed by Camargo and Kakihana Reference Camargo and Kakihana7 originally to synthesize lead-based perovskites and recently applied to obtain a series of bismuth-based compounds. Reference Hou, Qu, Krsmanovic and Kumar16 Basically, this method uses the fundamental exothermic reaction between Pb(II) and hydrogen peroxide that forms the oxidized lead oxide at high pH [Eq. (1)].
 $${\rm{Pb(OH)}}_4^{2 - } + 2{{\rm{H}}_{\rm{2}}}{{\rm{O}}_{\rm{2}}} \to {\rm{Pb}}{{\rm{O}}_2} + 2{{\rm{H}}_{\rm{2}}}{\rm{O}} + 2{\rm{O}}{{\rm{H}}^ - }\quad .$$
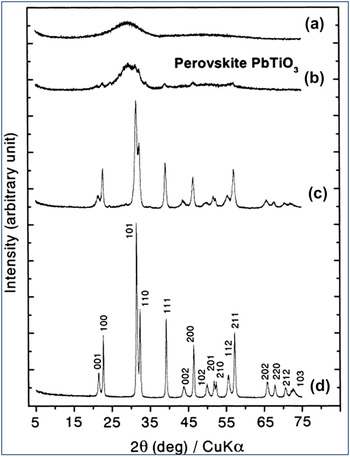
The key idea of the OPM is the substitution of hydrogen peroxide by soluble peroxo complexes that react with Pb(II) similar to H2O2 to form an amorphous and reactive precipitate, which is easily crystallized into the desired material [Eq. (2)]. For instance, pure lead titanate was obtained using titanium peroxo complexes as low as 500 °C (Fig. 1). Reference Camargo and Kakihana7
 $${\rm{Pb(OH)}}_4^{2 - } + {[{\rm{Ti(OH}}{{\rm{)}}_3}{{\rm{O}}_2}]^ - } \to \,\,{\rm{PbTi}}{{\rm{O}}_3} + 2{{\rm{H}}_{\rm{2}}}{\rm{O}} + 3{\rm{O}}{{\rm{H}}^ - }\quad .$$
X-ray diffraction pattern of the (a) precipitate powder, (b) PbTiO3 calcined at 450 °C for 1 h, (c) PbTiO3 calcined at 500 °C for 1 h, and (d) PbTiO3 calcined at 700 °C for 1 h. The heating rate used was 10 °C/min. Reference Camargo and Kakihana7

Pure peroxo complexes of titanium and zirconium are widely known and studied in the field of biochemistry because of their action in inflammatory process. Reference Tengvall, Elwing, Sjöqvist, Lundström and Bjursten17 In the case of titanium, it is known that a highly concentrated aqueous solution of Ti(IV) and H2O2 exhibits an intense orange color, characteristic of peroxo complexes often called to as peroxytitanic acid. The mechanism of their formation from titanium metal is very complex and not completely understood. Reference Tengvall, Vikinge, Lundström and Liedverg18 However, at high pH, the reaction can be described in terms of Eq. (3).
 $${\rm{T}}{{\rm{i}}^{\rm{0}}} + 3{{\rm{H}}_{\rm{2}}}{{\rm{O}}_{\rm{2}}} \to {[{\rm{TI(OH}}{{\rm{)}}_{\rm{3}}}{{\rm{O}}_{\rm{2}}}]^ - } + {{\rm{H}}_{\rm{2}}}{\rm{O}} + {{\rm{H}}^{\rm{ + }}}\quad .$$
Although hydrogen peroxide in excess is necessary to stabilize the solution of peroxytitanic acid, this excess decomposes catalytically with evolution of oxygen gas. When most of the H2O2 is consumed, a yellow gel forms spontaneously, even at neutral pH. However, by the addition of diluted H2O2, a normal fluid solution rather than a gel is again obtained. Zirconium metal, however, cannot be dissolved in a solution of hydrogen peroxide probably because of the presence of a thin layer of zirconium oxide on the surface of the metallic particle. Sometimes, ZrCl4 has been used as starting chemical, but it is interesting to note that there are only few studies concerning the synthesis of zirconium complexes from hydrated zirconium nitrate. Interestingly, nitrates of zirconium and hafnium were successfully used to obtain lead-based perovskites from their respective peroxo complexes by the OPM route. Reference Camargo, Poppa, Frantti and Kakihana19,Reference Camargo and Kakihana20
It has been realized that peroxo metal complexes can be obtained for a series of elements, including rare earth elements, which makes possible the synthesis of several oxides modified with lanthanum, praseodymium, and neodymium by the OPM route, although some modifications were introduced in the experimental procedure. Reference Camargo, Barrado, Ribeiro, Leite and Longo21–Reference Pinto, Souza, Longo, Leite and Camargo23 In a typical experiment, titanium peroxo complexes are prepared through the addition of small amount of titanium metal powder into a mixture of hydrogen peroxide and ammonia. This solution is kept in an ice water bath, resulting in a yellow transparent aqueous solution of soluble peroxytitanate [Ti(OH)3O2]−. Lead nitrate and other elements are usually dripped on the peroxytitanate solution under stirring and cooled with ice water bath, forming an orange and amorphous precipitate with a vigorous evolution of gas.
Titanium peroxo complexes are not stable for long time in water, and they must be held in an ice bath at low temperature with an excess of hydrogen peroxide at high pH to avoid this secondary hydrolysis reaction. However, the reaction between zirconyl ion and hydrogen peroxide occurs only at low pH, and if the pH is not controlled, an insoluble white hydrated oxide precipitates when the solution becomes alkaline. Since each solution is stable in a quite different pH range, titanium and zirconium peroxo complexes cannot be formed at the same time in the same solution. For this reason, this strategy of two separate starting solutions in a quite flexible procedure can be applied for virtually all elements that form peroxo complexes.
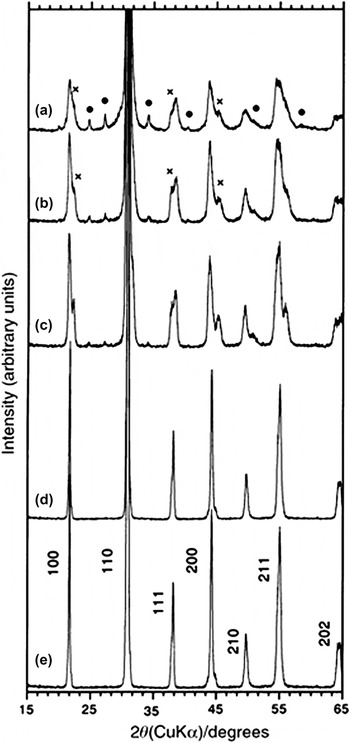
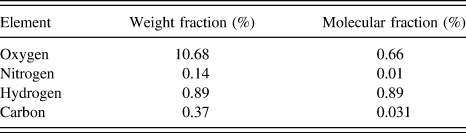
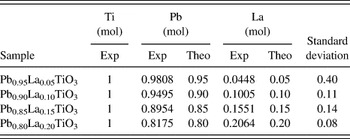
One of the most impressive aspects of the OPM route was the facile synthesis of lead zirconate titanate (PZT) powders with different compositions and high purity. The first study focused the synthesis of PbZr0.6Ti0.4O3 powders (Fig. 2), a composition slightly rich in zirconium but sufficiently near to the morphotropic phase boundary (MPB) to check the efficiency of the method. Table I shows the elemental analysis of the dry precursor before the crystallization, where it is possible to observe the presence of small amounts of nitrogen and carbon due the adsorption of N2 and CO2 gases from the atmosphere. Moreover, the calculated stoichiometric ratio of the precipitate (10:6:4, Pb:Zr:Ti) and of the starting solutions were the same, revealing that all cations were successfully precipitate. A similar quantitative precipitation was observed later during the synthesis of lanthanum-modified lead titanate (Table II).
XRD patterns of the PZT powders calcined for 2 h at: (a) 600 °C, (b) 700 °C, (c) 800 °C, (d) 900 °C, and (e) 1000 °C. The symbol (●) refers to the PbO2 phase, and the symbol (X) refers to the tetragonal PZT phase. The peaks of the rhombohedral Pb(Zr0.60Ti0.40)O3 phase are assigned in XRD pattern (e). Reference Camargo, Frantti and Kakihana24 Reproduced with permission from The Royal Society of Chemistry.

Results from the elemental analysis (hydrogen, carbon, oxygen, and nitrogen). The values are weight fractions from the volatile material. Reference Camargo, Frantti and Kakihana24 Reproduced with permission from The Royal Society of Chemistry.

Mole composition of different amorphous precipitate obtained from ICP analysis. Reference Camargo, Barrado, Ribeiro, Leite and Longo21

Exp is the experimental results, whereas Theo is that calculated from the formula Pb1−x La x TiO3.
III. CRYSTALLIZATION STEP
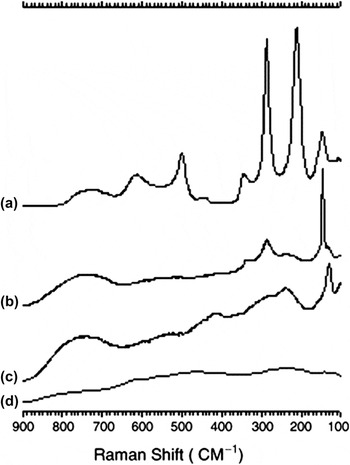
There is paradigm in WetChem routes of synthesis that high-quality materials sometimes can be obtained from high-quality amorphous precursors, whereas low-quality precursors will certainly form powders with the same low quality. That is still true for the OPM technique. It is quite common that apparently amorphous precursors sometimes result in compounds with secondary or intermediate phases after heat-treated if special care is not taken during the experimental procedure. Although the inherent advantage of the OPM route, the crystallization mechanism of the amorphous precursor is still not completely understood. In this context, the short-range order around Ti atoms in the amorphous precipitate (mole ratio of 1:1, Pb:Ti) and their heat-treated powder were studied combining x-ray absorption fine structure (XAS) spectroscopy at the titanium K-edge with Fourier transform Raman spectroscopy, differential scanning calorimetry, and x-ray powder diffractometry (XRD). Reference Camargo, Longo, Leite and Mastelaro25 The Raman spectrum of the sample calcined at 700 °C for 1 h [Fig. 3(a)] shows the typical spectrum of pure tetragonal lead titanate, whereas spectra of the powders calcined at 450 °C for 40 min (b) and for 15 min (c) are completely different. These spectra could not be assigned as tetragonal or as cubic PbTiO3 phases but were identified as a pyrochlore metastable phase crystallized at lower temperature before the formation of the thermodynamically expected perovskite [Eq. (4)]:
 $${\rm{P}}{{\rm{b}}_{\rm{2}}}{\rm{T}}{{\rm{i}}_{\rm{2}}}{{\rm{O}}_{\rm{6}}} \to 2{\rm{PbTi}}{{\rm{O}}_{\rm{3}}}\quad .$$
FT-Raman spectra of (a) PT700, (b) PT450–40, (c) PT 450–15, and (d) of the amorphous precursor. Reference Camargo, Souza, Leite and Kakihana26

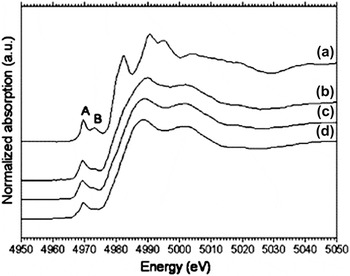
The most important result observed in this study and had an important impact on the knowledge of the mechanism of several oxides obtained by WetChem routes was the evidence that the oxygen octahedra around titanium were already formed during the precipitation of the amorphous precursor, and the crystallization occurs through metastable intermediate phases. The x-ray absorption near edge structure (XANES) spectrum obtained at Ti K-edge for PbTiO3 heat treated at 700 °C [Fig. 4(a)] is characteristic of the PbTiO3 tetragonal phase, in agreement with the Raman results of Fig. 3. The XANES spectra of the samples heat treated at (b) 450 °C for 40 min, (c) for 15 min, and (d) of the amorphous precipitate exhibit identical edge structure, indicating the same local symmetry for titanium atoms in all samples. However, these three spectra present a different pre- and post-edge structure when compared to the XANES spectrum of tetragonal PbTiO3. The transitions situated at the preedge region are less intense, principally in the amorphous precipitate sample. The decreasing in the intensity of the transition labeled as A in curves (a–d) could be attributed to a decreasing in the distortion of the TiO6 octahedra, whereas the electronic transition assigned as B does not depend strongly on small displacements of the atoms in the octahedra, but it is mainly affected by structural changes in the vicinity of the absorbing titanium atom, Reference Calderon-Moreno and Camargo27 indicating that the spatial arrangement of the oxygen and titanium elements in the C4v symmetry point group is formed immediately during the oxy-reduction reaction between Ti-peroxo complexes and the Pb2+ ions. A general equation for the lead titanate system synthesized by WetChem routes is proposed [Eq. (5)], where the first term at left side represents the amorphous oxidized precursor. The unidirectional arrows means that the phase transition occurs only in the indicated direction, and consequently, the bi-directional arrow means that the phase transition occurs in both directions.
 $$\mathop {{\rm{2[PbTi]}}}\limits_{{\rm{amrphous}}} \to \mathop {{\rm{P}}{{\rm{b}}_{\rm{2}}}{\rm{T}}{{\rm{i}}_{\rm{2}}}{{\rm{O}}_{\rm{6}}}}\limits_{{\rm{pyrocholore}}} \to {\rm{2}}\mathop {{\rm{PbTi}}{{\rm{O}}_{\rm{3}}}}\limits_{{\rm{tetragonal}}} \leftrightarrow {\rm{2}}\mathop {{\rm{PbTi}}{{\rm{O}}_{\rm{3}}}}\limits_{{\rm{cubic}}} \quad .$$
Titanium K-edge XANES spectra of (a) PbTiO3 heat treated at 700 °C for 1 h, (b) at 450 °C for 40 min, (c) at 450 °C for 15 min, and (d) amorphous precipitate. Reference Camargo, Longo, Leite and Mastelaro25

A particularly important aspect of the OPM is the generation of oxygen gas from the amorphous precursor during its crystallization due to the reduction of lead oxide [Eq. (6)]. Usually, WetChem routes based on the use of organic molecules to stabilize the cations and avoid premature hydrolyses, such as the Pechini method, polymerized precursors Reference Kakihana3 or any citrate-like route Reference Calderon-Moreno and Camargo27,Reference Camargo, Longo, Leite and Kakihana28 result in a local reducing atmosphere during the crystallization step due the combustion of organic fraction. However, the generation of oxygen in the OPM result in a highly oxidizing atmosphere during the crystallization process, modifying strongly the properties that are dependent on the oxygen vacancies and defects balance. Reference Camargo, Longo, Leite and Kakihana28
 $${\rm{2Pb}}{{\rm{O}}_{\rm{2}}}\mathop \to \limits^\Delta {\rm{2PbO}} + {{\rm{O}}_2}\quad .$$
IV. MORPHOLOGY AND SINTEREABILITY
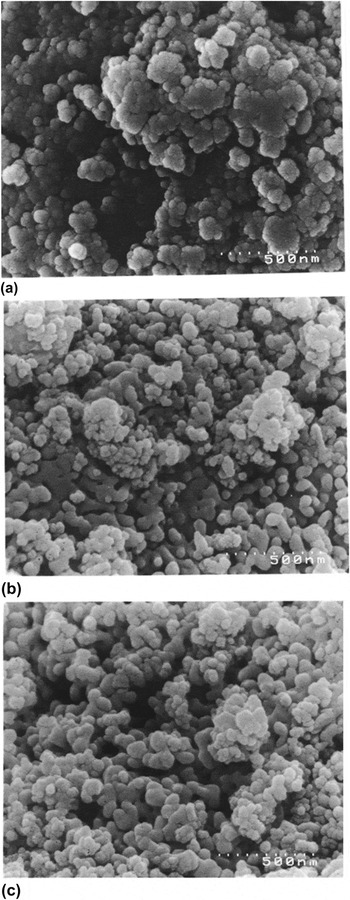
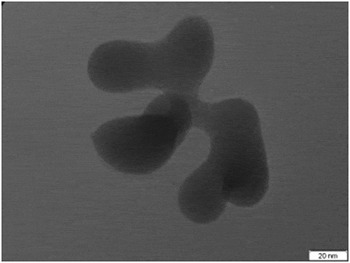
The OPM route results in highly reactive powders that are easily sintered. The amorphous precursors show uniform particles, independent of the composition. For instance, Fig. 5 shows three SEM images of PbZrO3 Reference Camargo, Poppa, Frantti and Kakihana19 that are representative of any sample synthesized by the OPM. It is interesting to note that all powders show similar microstructure, despite the fact that the image on the top shows the amorphous precursor and the bottom image the powder calcined at 700 °C for 2 h. Figure 6, however, shows a TEM image of an isolated particle of Pb0.75La0.25TiO3 calcined at 900 °C for 2 h, where the presence of large secondary particles of complex shape formed from the partial sintering of smaller primary particles is evident.
SEM micrographs of the dry precipitate (a, top) and the powders of PbZrO3 calcined for 2 h at 500 °C (b, middle) and at 700 °C (c, bottom). Reference Camargo, Poppa, Frantti and Kakihana19

Transmission electron microscopy image of the Pb0.75La0.25TiO3 calcined at 900 °C for 1 h. Reference Pinto, Souza, Chiquito, Longo, Leite and Camargo22

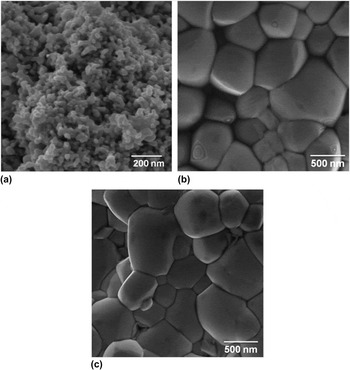
Highly dense samples have been obtained from crystalline powders synthesized by the OPM route, usually exhibiting densities higher than 98% through traditional sintering Reference Camargo, Barrado, Ribeiro, Leite and Longo21–Reference Pinto, Souza, Longo, Leite and Camargo23,Reference Camargo, Souza, Leite and Kakihana26 (Fig. 7); however, the use of microwaves or spark plasma were successfully used to obtain PZT ceramics and lanthanum-modified PZT with densities near to 99% with uniform microstructure.
SEM images of praseodymium-modified lead titanate Pb0.80Pr0.20TiO3 samples (a) powder calcined at 700 °C, (b) pellet sintered at 1100 °C, and (c) pellet sintered at 1150 °C. Reference Pinto, Souza, Longo, Leite and Camargo23

V. DIELETRIC PROPERTIES AND FUTURE OPPORTUNITIES
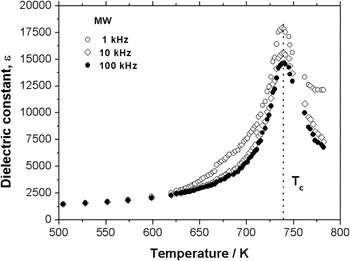
Perhaps, the most outstanding result observed in the oxides synthesized by the OPM technique was on the electric and dielectric properties of dense ceramics. The first study focusing on the dielectric properties of PZT was completed using samples sintered in nonoptimal conditions, resulting in consistent dielectric properties with those reported for the same system synthesized by others methods. Reference Camargo, Souza, Leite and Kakihana26 In this study, the dielectric constant (85) and the dissipation factor (0,01) as function of the frequency are in good agreement with the values reported for this material synthesized by means of conventional routes. Reference Zhang, Wang, Kim and Cross29 However, when some improvements were introduced in the sintering procedure, for instance, using microwaves for heating or optimizing the conventional heat conditions, the system answered positively. As an example, PZT ceramics with MPB composition of PbZr0.52Ti0.48O3 and sintered at 1000 °C for 2 h showed the higher dielectric constant ever reported form a such system (εmax = 17,911). Figure 8, for instance, shows the dielectric constant curves at different frequencies of these PZT ceramics as a function of the temperature. It is interesting that the T c temperature was unmodified. Regarding rare earth-modified lead titanate, the dielectric characterization indicated a normal behavior for the phase transition from ferroelectric to paraelectric for samples with lower amounts of lanthanum, whereas the samples with higher amounts showed relaxor behavior. Reference Pinto, Souza, Chiquito, Longo, Leite and Camargo22,Reference Pinto, Souza, Longo, Leite and Camargo23
Dielectric constant in function of frequency (1, 10, and 100 Hz) and temperature of PZT samples synthesized by the OPM route and sintered in microwave (MW).

Although all these advantages are shown by the OPM technique, only few studies have ever been conducted on the use of this method. Recently, bismuth-based titanates with several compositions were successfully obtained using bismuth nitrate as a starting compound, but few are known about the performance of these materials as a photocatalyst for the advanced oxidation process as an alternative for the treatment of effluents or for generation of hydrogen gas from the water splitting under UV irradiation, neither has been known the limits of solubility of different elements to obtain complex compositions.
VI. CONCLUSION
Wet chemical routes of synthesis open several opportunities for preparation of superior materials, sometimes with improved performance and other times resulting in environmental gains, such as nontoxicity, lower energy consumption, or better control of the final properties. Although there are a huge number of wet chemical techniques for the synthesis of oxides, particularly oxides of the perovskite family, the OPM is a relatively new and less studied route, and it exhibits several advantage and unique characteristics not found in the traditional methods. First of all, it is a clean method based on hydrogen peroxide that matches perfectly with the green chemistry approach. Second, the oxidizing local atmosphere provided by the precursor during its crystallization is unique among all the wet chemical techniques of synthesis, which usually result in reducing environment. Despite these advantages, only a few studies have focused on the use of the OPM to obtain better materials, which makes this field of study an excellent opportunity for the development of materials with higher purity and controlled morphologies.
ACKNOWLEDGMENTS
This work was supported by FAPESP (Grant No. 2012/07067-0), CNPq, and CAPES.