
I. INTRODUCTION
A hybrid supercapacitor combines a secondary battery electrode with a double-layer electrode. It aims to fill the energy density gap between a rechargeable battery and double-layer supercapacitor while retaining a reasonable power capability. Various rechargeable battery electrodes have been studied, including Ni(OH)2, MnO2, MoO3, V2O5, TiO2, LiMn2O4, Li4Ti5O12, and graphite. Reference Amatucci, Badway and Du Pasquier1–Reference Qu, Wen, Liu, Xie, Zhang, Zheng, Lei, Zhong, Tang, Xiao and Qu10 The hybrid device comprising a lithium ion battery electrode is also referred to as a lithium ion supercapacitor (LIC). ZnO has been widely used in solar cells, semiconductor lasers, photocatalysts, gas sensors and the Zn/Ni secondary battery. Reference Skompska and Zarębska11–Reference Wen, Yang, Fan, Tan and Yang15 It is now considered as a promising conversion Li-ion cathode material due to its relatively high theoretical capacity, environmental benignity, low cost, easy preparation and morphologic variety. Reference Shilpa, Basavaraja, Majumder and Sharma16–Reference Zhang, Hou, Zhang, Zeng, Yan, Li and Duan25 In this study, a ZnO electrode was investigated in a LIC. In this unique configuration, the ZnO was used as the negative electrode, in which the conversion reaction (ZnO + 2Li+ + 2e = Zn + Li2O) and the alloying/dealloying process (Zn + Li+ + e = LiZn) were the energy storage and conversion mechanisms. A porous carbon was used as the positive electrode where non-faradic double-layer processes were involved.
There remained several obstacles for the ZnO to be useful as the electrode in a LIC, including the intrinsically poor conductivity and the huge volume change that occurs during the lithiation/delithiation. Both would significantly hinder the electrochemical performance by causing severe capacity/cycling fading and poor rate performance. It has been reported that the performance of ZnO can be improved by dispersing the nano-sized ZnO material into carbonaceous materials. Reference Shilpa, Basavaraja, Majumder and Sharma16–Reference Yang, Song, Cui, Liu and Wang23 Furthermore, previous studies also pointed out that N-doped carbon materials often showed high interaction with lithium and favored for the lithium diffusion and transfer, thus resulting in substantially increased specific capacites. Reference Mao, Duan, Xu, Zhang, Hu, Zhao, Wang, Chen and Yang26–Reference Zhao, Hu, Li, Wang and Chen28 In our previous study, the high degree of crystallinity of ZnO was reported to enhance the specific capacity of ZnO. Reference Xiao, Mei, Cao, Qu and Deng24 Therefore, N-doped carbon encapsulated ZnO nano-crystals (ZnONC@C) were fabricated and used in a LIC. To preserve the high degree of crystallinity of the ZnO nano-materials and introduce the nitrogen functional groups onto the carbon, a mussel-inspired method was adopted. Using this tactic, dopamine was selected as the precursor for the synthesis of the N-doped carbon materials. After self-polymerization in basic media, the polydopamine, which has the structure similar to that of adhesive proteins in mussels, was deposited onto the surface of the ZnO nano-crystals and then converted to the N-doped carbon material through pyrolysis. Reference Liu, Ai and Lu29–Reference Wu, Shen, Yu, Xi and Qiu35 The electrochemical measurements revealed high specific capacity, remarkable rate capability and cycle life for the LIC made with the ZnONC@C. It should mention that, compare to other LICs reported previously, which most of their operating potential windows were lower than 3 V and therefore limited their energy and power densities, the presented lithium ion hybrid supercapacitor, on the other hand, can operate upto the potential of 4 V with good cyclic stability.
II. EXPERIMENTAL SECTION
A. Preparation of ZnONC@C
Dopamine hydrochloride (98% pure) was purchased from Aladdin Industrial Corporation (Shanghai, China). Activated carbon was obtained from XF Nano Inc. (Nanjing, China). All other chemicals were purchased from Sinopharm Chemical Reagent Co., Ltd. (Shanghai, China). All chemicals were used as received.
The ZnO nano-crystals (ZnONC) were prepared according to the procedure reported in Refs. Reference Xiao, Mei, Cao, Qu and Deng24 and Reference Tong, Liu, Dong, Zhao, Zhang, Lu, Shen and Fan36. Briefly, 30 mL of 0.01 M zinc nitrate aqueous solution was thoroughly mixed with 30 mL of 0.01 M hexamethylenetetramine (HMT, C6H12N4). Then 2 mL of 0.1 M tri-sodium citrate solution was added to the mixture. The solution was transferred to a Teflon-lined autoclave with a capacity of 100 mL for hydrothermal synthesis at 95 °C in an oven for 12 h. The resulting white precipitate was collected and washed with deionized water several times before being dried in a vacuum oven at 85 °C for 12 h. The product was then calcinated at 800 °C in the air for 30 min. Dopamine was first stirred in a Tris-buffer for 1 h under an inert atmosphere to prevent self-polymerization. The ZnONCs were added in the dopamine solution and stirred under vacuum for 4 h before backfilling O2 for the self-polymerization. The resulting sample was then carbonized at 550 °C for 1 h under argon atmosphere.
B. Characterization and measurements
SEM images were taken using a Hitachi S-4800 field emission scanning electron microscope (Hitachi Corp., Tokyo, Japan). TEM images were taken with a JEM 2100F electron microscope (JEOL Ltd., Tokyo, Japan) operating at 200 kV. Raman spectroscopy was performed on a Laser Raman Spectrometer (INVIA, Renishaw, London, United Kingdom) with 633 nm laser at room temperature. XP spectra were obtained using a VG Multilab 2000 X-ray photoelectron spectrometer with Mg Kα radiation. Narrow-scan spectra of the C 1s, Zn 2p, and O 1s regions were obtained with a 15 eV pass energy, 100 W electron-beam power, and the solution of 0.1 eV.
The electrochemical performances of the synthesized ZnO samples (ZnONC and ZnONC@C) as well as the LIC were measured in a CR-2032-type coin-cell at room temperature. The ZnO electrodes were prepared by mixing 60 wt% of active materials with 25 wt% of carbon black and Teflon suspension (15 wt% of dry material). The slurry was coated on a stainless steel foil with overall loading of 2 mg. The porous carbon electrode was prepared by mixing activated carbon (75 wt%) with carbon black (20 wt%) and Teflon suspension (5 wt% of dry material). After thoroughly mixing, the paste was coated onto stainless steel foil with an overall loading of 12 mg. Both electrodes were vacuum-dried at 85 °C for 12 h. The geometric areas of both electrodes were about 1 cm2. The ZnO electrodes were then incorporated into coin cells in an argon-filled glove box with either lithium foil as the counter electrode or a porous carbon electrode as the positive electrode, a Celgard separator and 1 M LiPF6 in a 1:1 ethyl carbonate (EC):dimethyl carbonate (DMC) solvent as the electrolyte.
Galvanostatic charge/discharge tests and cycling stability tests were performed using a CHI 660C electrochemical workstation (CH Instruments, Shanghai, China). Electrochemical impendence spectroscopy (EIS) was carried out on an Autolab PGSTAT12 electrochemical workstation (Metrohm Autolab, Beijing, China) over a frequency range of 0.001 Hz to 100 kHz with an amplitude of 5 mV.
III. RESULTS AND DISCUSSION
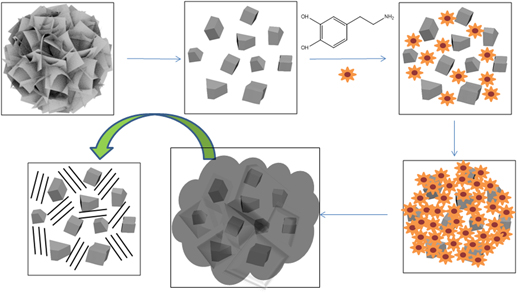
Figure 1 shows the morphologies of the intermediate and final products during the synthesis of ZnONC@C. Figure 1(a) shows the microspheres of ZnO with diameters of 1.2 μm which were prepared through the hydrothermal reaction, the flake-like surface can be clearly observed. Figure 1(b) shows the SEM pictures taken after the ZnO microspheres were calcinated at 800 °C for 30 min. The flake-like microsphere structure disappeared and the clean surface ZnO nano-crystals with sizes in the range of 50–200 nm started to form. Then the dopamine was introduced. After self-polymerization and carbonization, the structure and morphology of the ZnONC@C is presented in Fig. 1(c). Evidentially, ZnONC was well distributed in the carbon matrix. The TEM image further confirmed the formation of ZnONC@C. As shown in Fig. 2(a), the ZnO nano-particles with sizes around 50–150 nm were encapsulated within the carbon framework. Figure 2(b) shows the HR-TEM image of ZnONC@C. The ZnO nano-crystals clearly exhibited the appearance of lattice fringes with intervals of 0.28 nm, which agreed well with the spacing of the (100) plane of the ZnO crystal. The surrounding phase shows the typical amorphous porous carbon materials. Reference Simon and Gogotsi2,Reference Ren, Wang, Chen, Wang, Fu, Fan and Qian18,Reference Yue, Shi, Wang, Cao, Dong, Qiao, Yin and Yang19
SEM images of (a) ZnO microsphere, (b) ZnO nano-crystal and (c) ZnONC@C.

TEM (a) and HRTEM (b) images of ZnONC@C.

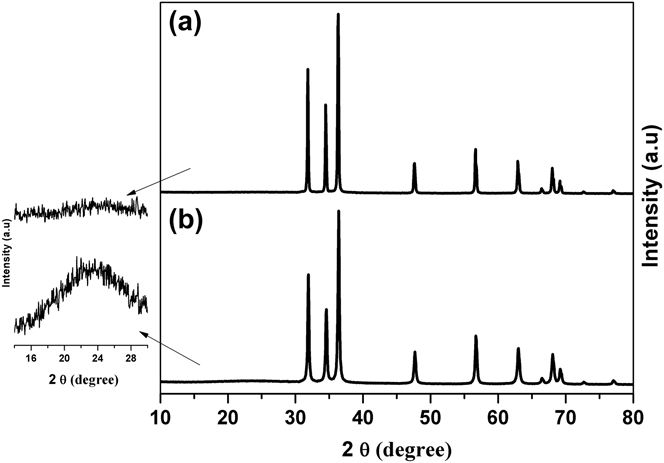
The formation of ZnO crystals and the preservation of the high degree of crystallinity after carbon coating were also investigated by XRD. Figures 3(a) and 3(b) show the XRD patterns of the ZnONC and ZnONC@C, respectively. All diffraction peaks in both samples are well-defined and almost identical, which can be indexed as the wurtzite phase of hexagonal ZnO (JCPDS No. 36–1451). As shown in the enlarged scale on the left side of Fig. 2, a broad diffraction peak centered around 23.5° appeared in the sample of ZnONC@C. This broad XRD peak was a typical XRD pattern for amorphous carbon, which revealed the formation of amorphous carbon on the surface of ZnO through the carbonation of the self-polymerized dopamine. Evidentially, a high degree of crystallinity of the ZnO nano-particles was preserved after the carbon coating processes.
XRD patterns of (a) ZnONC and (b) ZnONC@C.
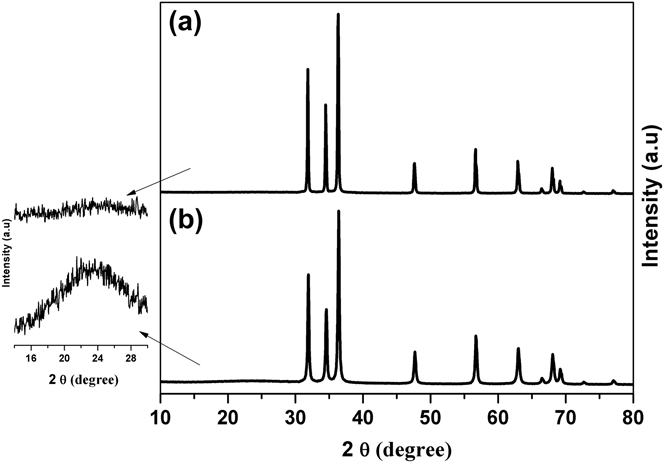
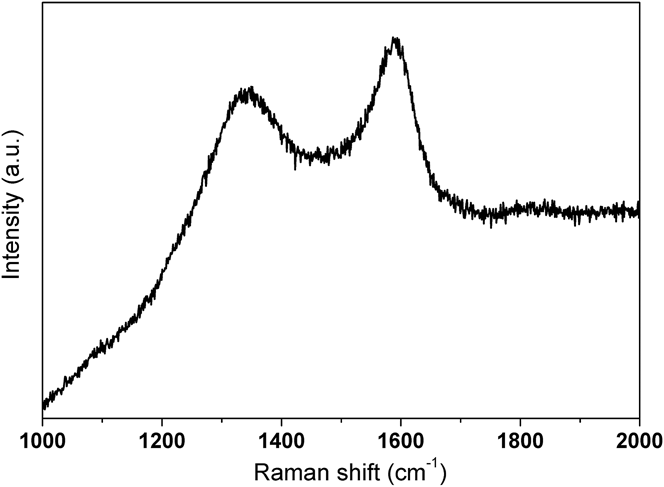
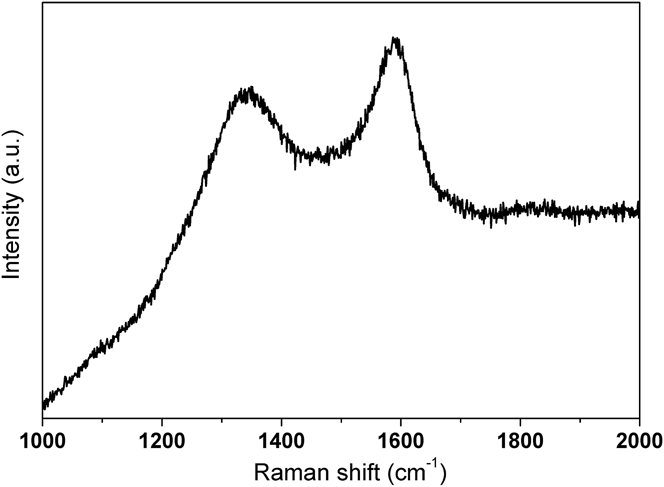
Figure 4 shows the Raman spectrum for ZnONC@C. The two observed peaks located around 1320 and 1594 cm−1 can be assigned to the D and G bands, respectively. It is well known that the D band of carbon corresponds to the defects or structurally disordered carbon and the G band is attributed to the ordered sp 2 bonded carbon. Furthermore, the I D/I G intensity ratio can provide information regarding the graphitic microstructure of carbon materials. The lower the value, the higher the degree of graphitization of the carbon. Reference Ren, Wang, Chen, Wang, Fu, Fan and Qian18,Reference Guo, Yue, An, Ren and Yan21,Reference Bai, Zhang, Fan, Guo and Tang22,Reference Liu, Ai and Lu29,Reference Tang, Xiong, Qu, Liu, Zhang, Xie, Wei, Tu and Qu30 The I D/I G ratio was found to be 0.95 in this study, indicating the formation of an amorphous conductive carbon with weakly ordered sp 2 bonded graphitic carbon domains. The results was consistent with the XRD results. This also agreed well with the previous reports that carbonaceous materials derived from polydopamine were nearly 100% sp 2 carbon. Reference Liu, Ai and Lu29,Reference Tang, Xiong, Qu, Liu, Zhang, Xie, Wei, Tu and Qu30 The results confirmed the formation of a ZnO nano-crystal with high degree of crystallinity embedded within the conductive carbon material.
Raman spectrum of prepared ZnONC@C.
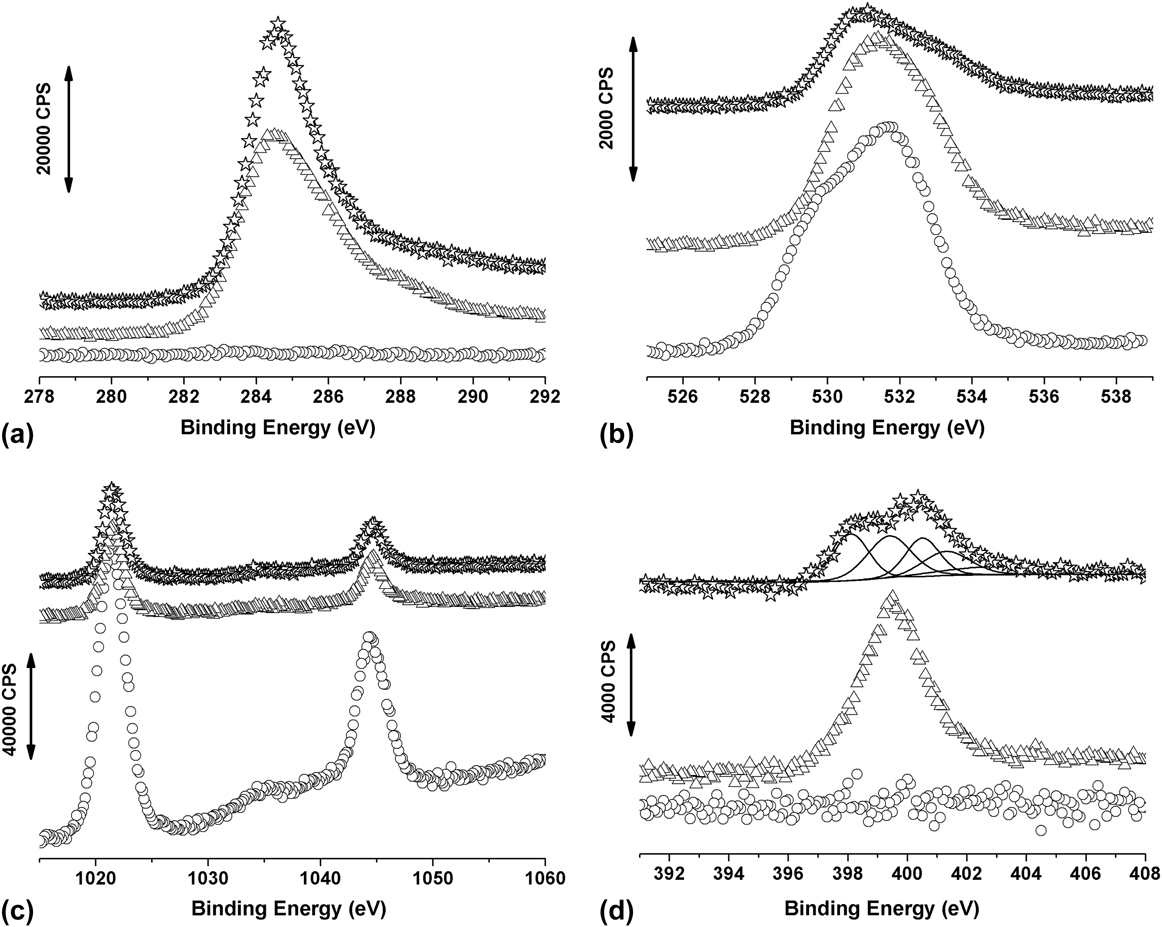
Figures 5(a)–5(d) show the XP spectra of the prepared ZnO samples in the region of C 1s, O 1s, Zn 2p and N 1s, respectively. In Fig. 5(a), a C 1s peak at 284.6 eV was clearly evident upon the introduction and carbonazition of the polydopamine, while there was no C 1s peak in the pure ZnO nano-crystal sample. This exhibited the formation of the carbon layer in the ZnONC@C sample. The binding energy of O 1s peak around 530.6 eV is also observed in the three samples as shown in Fig. 5(b). Figure 5(c) shows the XP spectra in the Zn 2p region. There were two peaks with binding energy of 1021.7 and 1044.7 eV observed in all three samples. These doublets were in good agreement with the reported 2p 3/2 and 2p 1/2 chemical shift of Zn2+, respectively. Reference Tang, Tang and Gong7,Reference Yue, Shi, Wang, Cao, Dong, Qiao, Yin and Yang19,Reference Wagner, Riggs, Davis, Moulder and Muileuberg37
XP spectra of ZnO samples at different synthesis stages, ZnONC (circle), ZnONC@polydopamine (triangle) and ZnONC@C (star), in the region (a) C 1s, (b) O 1s, (c) Zn 2p and (d) N 1s.
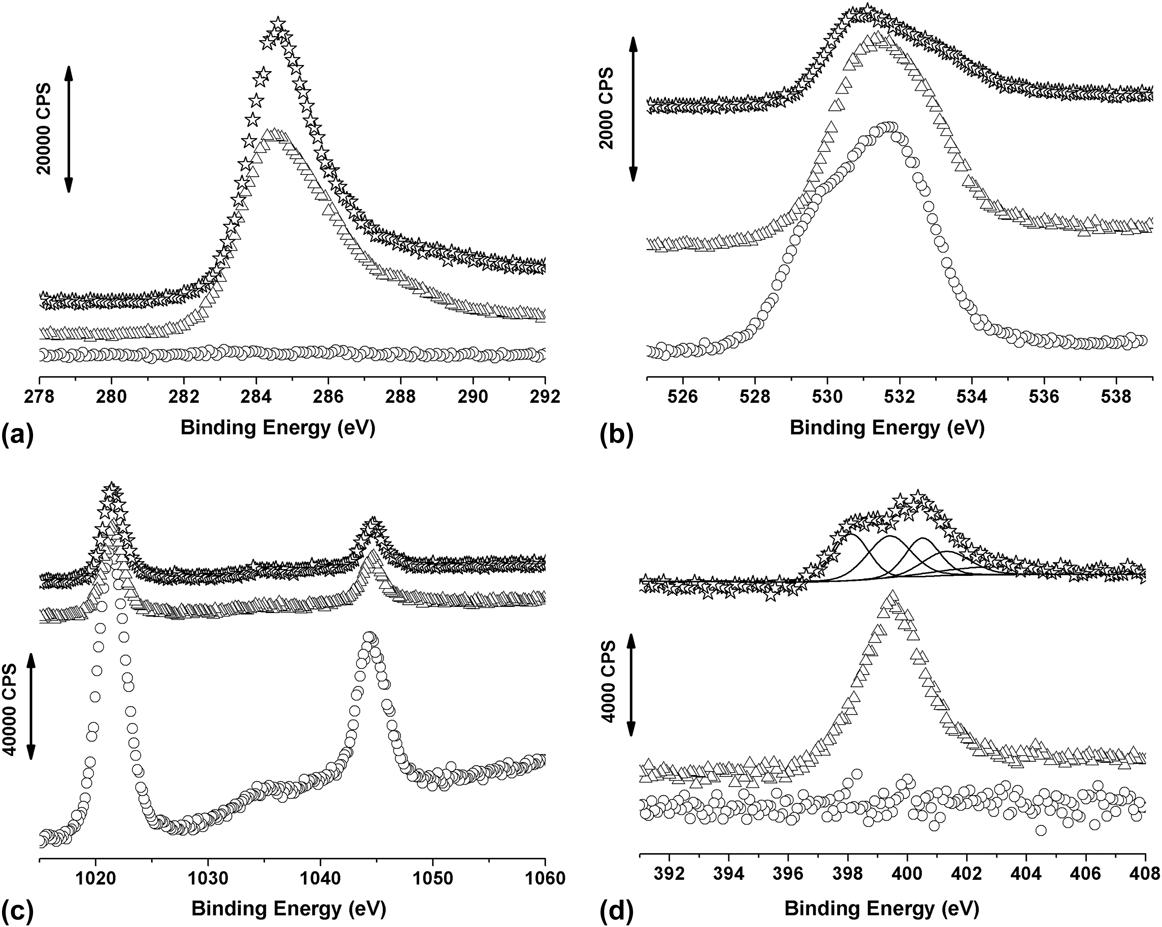
As shown in Fig. 5(d), there was no N 1s peak detected in the ZnONC sample. As for the ZnONC@polydopamine sample, the N 1s peak centered at 399.4 eV was observed. The peak position matched well with the binding energy of amino group which existed within the dopamine molecule. Once the polydopamine was carbonized, a relatively broad N 1s peak was detected in the XP spectrum. Deconvolution of this N 1s peak showed five sub-sets of peaks. Other than the amino nitrogen centered at 399.4 eV, pyridine-like structure nitrogen, pyrrolic and/or pyridone nitrogen moieties, quaternary nitrogen and N-oxides, which located at 398.1, 400.5, 401.3 and 402.9 eV, respectively, were also observed. Reference Pels, Kapteijn, Moulijn, Zhu and Thomas38–Reference Chen, Chen, Zhang, Xie, Deng and Liu40 The relative amount of N and C in the synthesized ZnONC@C can be estimated by Reference Wagner, Riggs, Davis, Moulder and Muileuberg37
 $${{{C_{\rm{N}}}} \mathord{\left/ {\vphantom {{{C_{\rm{N}}}} {{C_{\rm{C}}}}}} \right. \kern-\nulldelimiterspace} {{C_{\rm{C}}}}} = {{\left( {{{{A_{\rm{N}}}} \mathord{\left/ {\vphantom {{{A_{\rm{N}}}} {{R_{\rm{N}}}}}} \right. \kern-\nulldelimiterspace} {{R_{\rm{N}}}}}} \right)} \mathord{\left/ {\vphantom {{\left( {{{{A_{\rm{N}}}} \mathord{\left/ {\vphantom {{{A_{\rm{N}}}} {{R_{\rm{N}}}}}} \right. \kern-\nulldelimiterspace} {{R_{\rm{N}}}}}} \right)} {\left( {{{{A_{\rm{C}}}} \mathord{\left/ {\vphantom {{{A_{\rm{C}}}} {{R_{\rm{C}}}}}} \right. \kern-\nulldelimiterspace} {{R_{\rm{C}}}}}} \right)}}} \right. \kern-\nulldelimiterspace} {\left( {{{{A_{\rm{C}}}} \mathord{\left/ {\vphantom {{{A_{\rm{C}}}} {{R_{\rm{C}}}}}} \right. \kern-\nulldelimiterspace} {{R_{\rm{C}}}}}} \right)}}$$
where A is the peak area and R is the atom sensitivity factor. Using an R N and R C of 0.205 and 0.38, respectively, the ratio of N to C (C N/C C) within ZnONC@C was found to be 6.1%. This confirmed that relative high percentage of nitrogen was successfully doped within conductive carbon materials and this could further enhance the electrochemical performance of ZnONC@C materials.
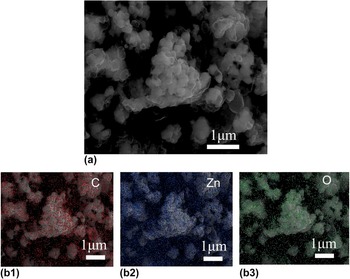
Figure 6(a) showed the SEM image of ZnONC@C sample which is similar with that in Fig. 1(c). Figures 6(b1)–6(b3) showed the elemental mapping of carbon, zinc and oxygen, respectively. It should note that the signal counts for EDS mapping here is quite low and can only tell that the ZnO nano-particles as well as carbon materials are mixed with each one. But combine with the images in Figs. 1 and 2, one do tell that the ZnONCs were highly dispersed within the carbon materials.
SEM (a) and full scan EDS (b1: carbon; b2: zinc and b3: oxygen) images of ZnONC@C.

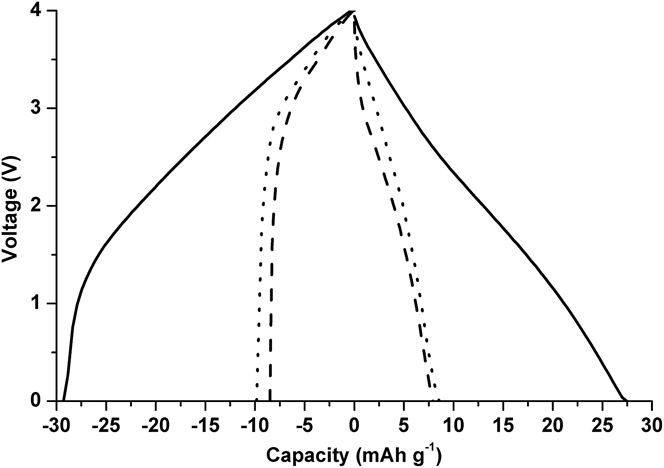
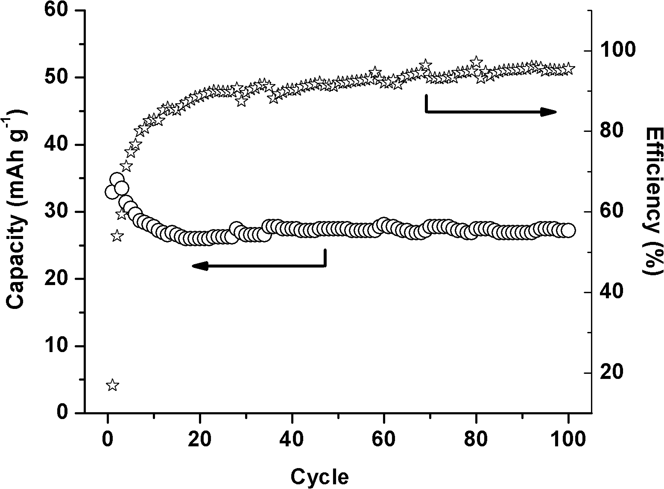
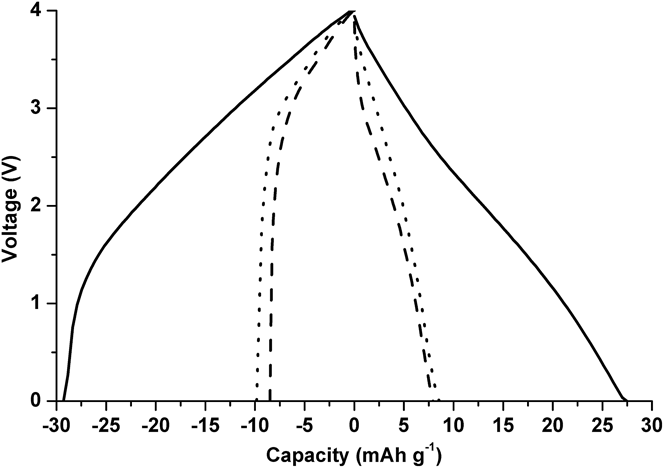
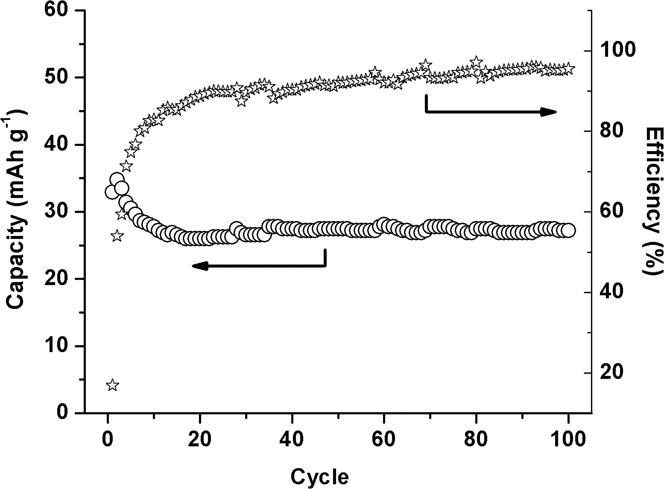
Figure 7 shows the comparison of the charge–discharge profiles of two hybrid supercapacitors. ZnONC electrode (dashed line) and ZnONC@C electrode (solid line) were used as the negative electrode and the same porous carbon was used as the positive electrode. The supercapacitors were cycled at 100 mA/g (per total mass of both positive and negative electrodes). It should be noted that the charge–discharge curves shown in Fig. 7 were collected after 100 cycles. The capacitances of the hybrid supercapacitors made with ZnONC and ZnONC@C were found to be 7.6 and 27.3 mAh/g, respectively. These results clearly illustrated that the energy density of the device assembled with ZnONC@C and a porous carbon was almost four times higher than that of the hybrid configuration involving ZnONC. It is worth noting that the performance of the double-layer supercapacitor made with polydopamine derived carbon and the porous carbon was also included in Fig. 7. It clearly demonstrated that the performance superiority resulted from the coherent interaction within ZnONC@C, not due to either ZnO or polydopamine derived carbon. The long-term cycling performance and the corresponding coulombic efficiencies for the ZnONC@C involved lithium ion supercapacitor were also investigated at a current rate of 100 mA/g (per total mass of both positive and negative electrodes), the results are shown in Fig. 8. A stable capacitance was demonstrated up to 100 cycles after the formation cycles, while the coulombic efficiency remained above 90–95%.
Charge–discharge curves of hybrid supercapacitors composed of a ZnONC@C//porous carbon (solid line), ZnONC//porous carbon (dash line) and a polydopamine derived carbon/porous carbon (dot line) under an applied current of 100 mA/g (total mass of both electrodes).
Cycling performance and the corresponding coulombic efficiency of the lithium ion supercapacitor fabricated by ZnONC@C//porous carbon.
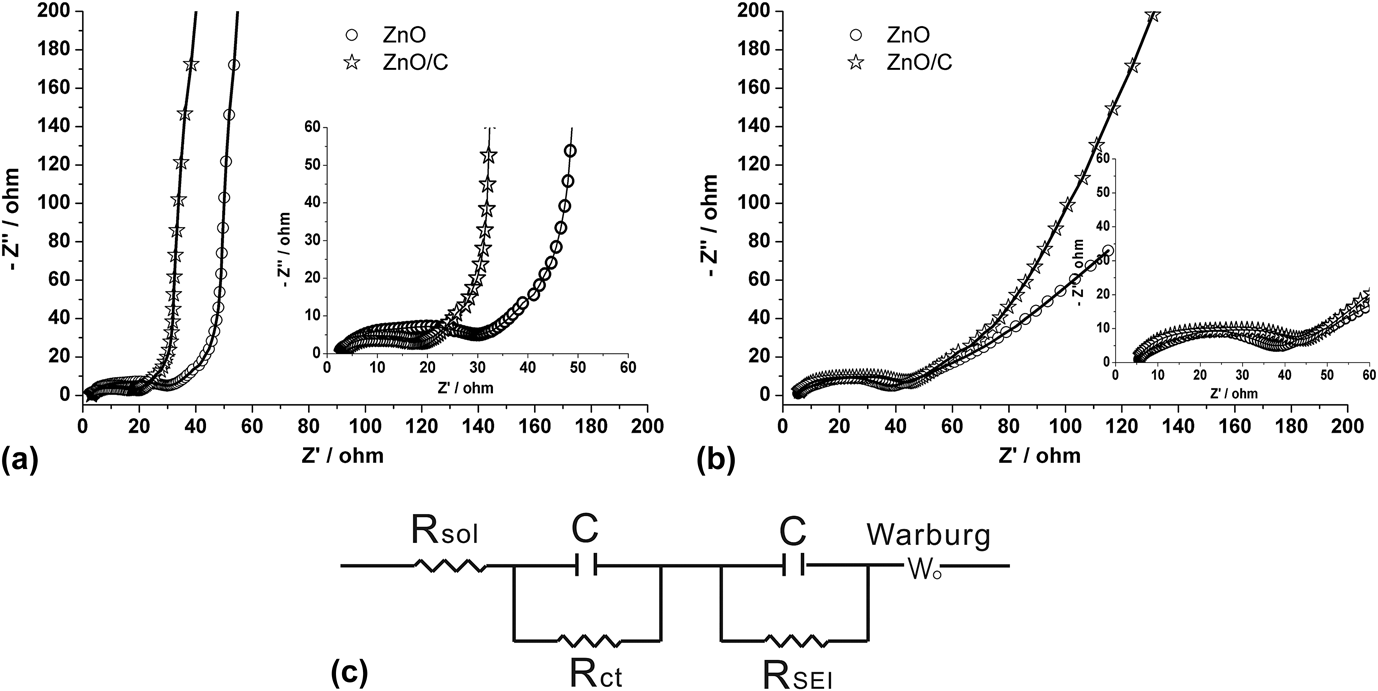
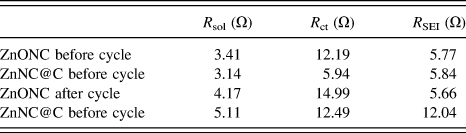
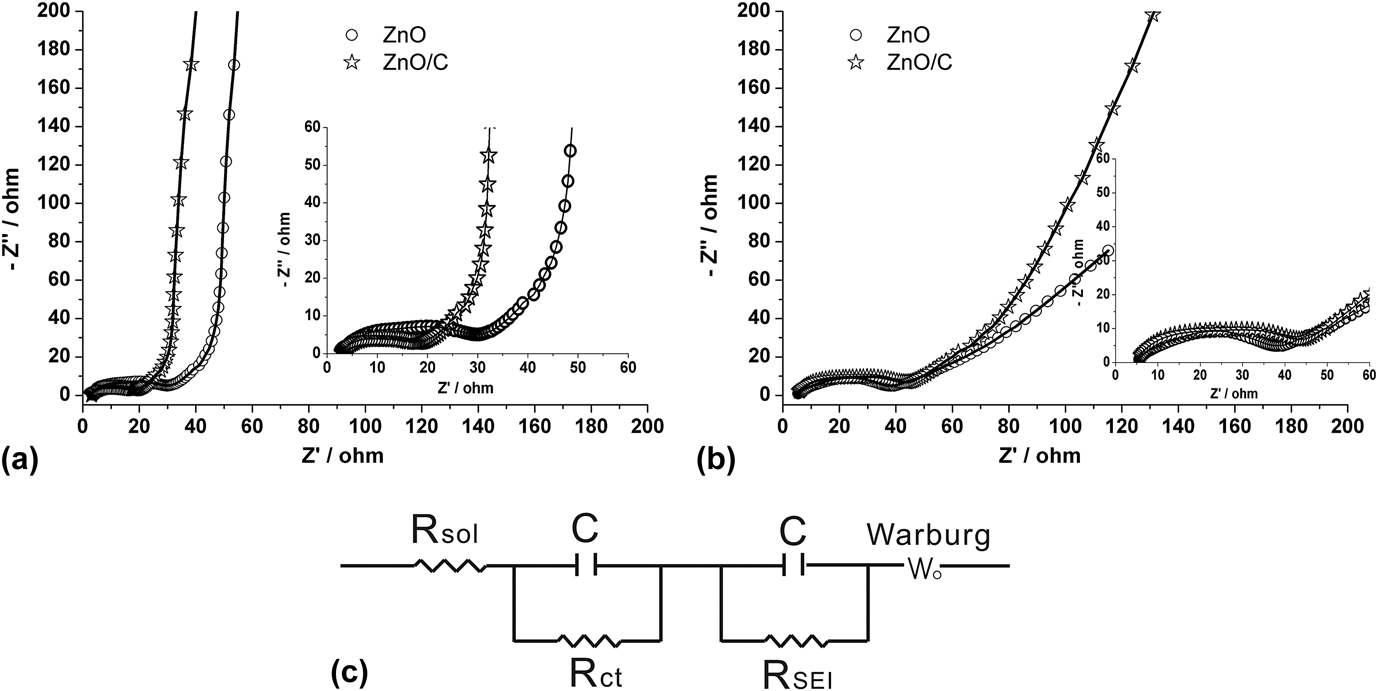
To further understand the enhancement of the electrochemical performance for ZnONC@C electrode, electrochemical impedance measurements were carried out on both ZnO electrodes before and after charge/discharge cycle using Li foil as the counter and reference electrode. The resulting impedance spectra were illustrated in Figs. 9(a) and 9(b), respectively. In all cases, one can clearly see there were two distinct sections existing in the Nyquist plot. Two depressed semicircles in the high frequency region represented a parallel combination of capacitance with either charge-transfer resistance (R ct) or resistance originated from SEI film (R SEI) were observed. While in the low frequency region, a relative straight line resulting from lithium ion diffusion into the porous structure of electrode materials was observed. The equivalent circuit model used for the numerical fittings is shown in Fig. 9(c). The fitting results are tabulated in Table I.
AC impedance spectra and fitting results (solid line) of ZnONC (circle) and ZnONC@C (star) electrodes before (a) and after (b) cycling. (c) is the equivalent circuit used for the fitting of the AC impedance spectra.
Comparison of R sol, R ct and R SEI.
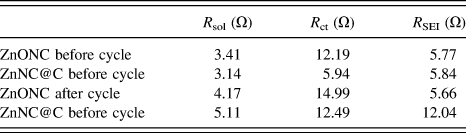
Clearly, the equivalent circuit fitted the spectra well. It was found that, before and after the cycling, the values of R ct for the ZnONC electrode were always higher than that for the ZnONC@C electrode indicating an increasing of electronic conductivity after the ZnO nano crystal was nested in the polydopamine derived carbon. The values of R SEI were more or less the same for both ZnONC and ZnONC@C electrodes before the charge/discharge cycles. However, after the cycles, R SEI was kept constant for the ZnONC electrode while it is significantly increased for the ZnONC@C electrode. This suggested that the SEI film was ruptured due to the ZnO particle fracture for the ZnONC electrode. While the SEI layer on the ZnONC@C material remained intact.
The lithium ions diffusion through both electrodes was also investigated by fitting the impedance in the low frequency region. A finite-length Warburg element was used to represent this process. It was demonstrated that a finite Warburg impedance can be expressed as Reference Qu, Wen, Liu, Xie, Zhang, Zheng, Lei, Zhong, Tang, Xiao and Qu10,Reference Tang, Xiong, Qu, Liu, Zhang, Xie, Wei, Tu and Qu30,Reference Liu, Zheng, Wang, Qu, Xie, Lei, Guo, Deng, Xiao and Qu41 :
 $$Z\omega = \left( {1 - i} \right)\sigma {\omega ^{{{ - 1} \mathord{\left/ {\vphantom {{ - 1} 2}} \right. \kern-\nulldelimiterspace} 2}}}\tanh \left[ {\delta {{\left( {{{i\omega } \mathord{\left/ {\vphantom {{i\omega } D}} \right. \kern-\nulldelimiterspace} D}} \right)}^{{1 \mathord{\left/ {\vphantom {1 2}} \right. \kern-\nulldelimiterspace} 2}}}} \right]$$
when
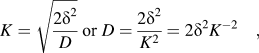 $$K = \sqrt {{{2{\delta ^2}} \over D}} \;{\rm{or}}\;D = {{2{\delta ^2}} \over {{K^2}}} = 2{\delta ^2}{K^{ - 2}}\quad ,$$
where δ is the effective diffusion thickness and D is the effective diffusion coefficient of the particle. K −2 is proportional to the diffusion coefficient. The values of K −2 can be obtained by means of the least square fitting of the ac impedance results. It was found that, before the cycling, the values of K −2 were 2.56 and 2.44 s−1 for the ZnONC and ZnONC@C electrodes, respectively, suggesting a similar ion transfer rate for both electrodes. After 50 cycles, this value became 2.86 s−1 for the ZnONC@C electrode, which slightly increased from before the cycling. This may be due to the activation of the electrode during the cycling. By contrast, the K −2 of the ZnONC electrode decreased dramatically to 0.17 s−1, which may due to electrode degradation.
IV. CONCLUSION
A new configuration of lithium ion supercapacitor was proposed in this study by coupling a nitrogen doped carbon encapsulated ZnO nano-crystal negative electrode with a porous carbon positive electrode. After synthesizing the ZnO nano-crystals and dispersing them into a nitrogen doped carbon while preserving crystallinity through a bio-inspired method, the fabricated device can be operated at a voltage up to 4 V and deliver a high energy density, high cycling stability, and good efficiency.
ACKNOWLEDGMENTS
This work was partially supported by the National Nature Science Foundation of China (11474226, 21401145, and 21476177), Fundamental Research Funds for the Central Universities (WUT: 2015-IB-001), Student Innovation training program (20161049720003) and Dongguan Production-study-research cooperation special funds (project number: 2013209119209). The authors thank Dr. Xiao-Qing Liu for his assistance conducting TEM.