Introduction
Water treatment via membrane technology is increasing throughout the world because of its simplicity and effectiveness alongside a growing need to handle industrial wastes which have grown in proportion to the growth of heavy industry. Ceramic membranes are used widely in cross-flow filtration because of their ability to achieve a high filtration rate compared with direct filtration, which is common in conventional filtration processes. Microfiltration (MF) as well as ultrafiltration (UF) are used widely for the effective removal of particles, colloidal substances, and microorganisms from aqueous suspensions (Gaucher et al., Reference Gaucher, Jaouen, Comiti and Legentilhomme2002; Foorginezhad et al., Reference Foorginezhad, Zerafat, Mohammadi and Asadnia2022; Paul et al., Reference Paul, Roy and Mitra2024). A membrane support supplies mechanical strength to the upper membrane layer allowing it to withstand the stress caused by the differential pressure that affects the entire membrane which provides low resistance to filtrate flow (Bouzerara et al., Reference Bouzerara, Harabi, Achour and Larbot2006; Ghouil et al., Reference Ghouil, Harabi, Bouzerara and Brihi2016). There are many countries across the globe that have rich sources of raw materials such as calcite (CaCO3), bone (natural hydroxyapatite (NHA) Ca10(PO4)6(OH)2), feldspar, dolomite (CaCO3·MgCO3), kaolin, and quartz. Numerous studies have been done on the utilization of these native raw materials (Boudaira et al., Reference Boudaira, Harabia, Bouzerara and Condom2009; Harabi et al., Reference Harabi, Bouzerara and Condom2009; Harabi et al., Reference Harabi, Karboua and Achour2012; Harabi et al., Reference Harabi, Harabi, Chehlatt, Zouai, Karboua and Foughali2016). In the industrial production of membranes, there is limited choice of materials. As a result, ceramic membranes come at a high price. In recent years, considerable efforts have been made in the membrane engineering sector to find suitable new porous ceramic materials at a more affordable price (Rakib et al., Reference Rakib, Sghyar, Rafiq, Cot, Larbot and Cot2000; Masmoudi et al., Reference Masmoudi, Amar, Larbot, El Feki, Salah and Cot2005; Boulkrinat et al., Reference Boulkrinat, Bouzerara, Harabi, Harrouche, Stelitano, Russo, Galiano and Figoli2020). These include clay ores such as kaolin, Al2Si2O5(OH)4 (Hubadillah et al., Reference Hubadillah, Othman, Matsuura, Ismail, Rahman, Harun, Jaafar and Nomura2018), bentonite/montmorillonite (Na,Ca)0.33(Al,Mg)2(Si4O10)(OH)2·nH2O (Saja et al., Reference Saja, Bouazizi, Achiou, Ouaddari, Karim, Ouammou, Aaddane, Bennazha and Alami Younssi2020; Mouafon et al., Reference Mouafon, Lecomte-Nana, Tessier-Doyen, Njoya, Njoya and Njopwouo2021), and feldspar (Malik et al., Reference Malik, Bulasara and Basu2020). These materials have attracted great attention because of their abundance in nature. Moreover, natural pozzolans magnesite, phosphate, and perlite are also used in the synthesis of microfiltration and ultrafiltration ceramic membranes (Nandi et al., Reference Nandi, Uppaluri and Purkait2009; Majouli et al., Reference Majouli, Younssi, Tahiri, Albizane, Loukili and Belhaj2011; Monash and Pugazhenthi, Reference Monash and Pugazhenthi2011; Vinoth Kumar et al., Reference Vinoth Kumar, Kumar Ghoshal and Pugazhenthi2015). The present study aimed to synthesize new, economically viable membrane supports from local Algerian clay and calcite to be used in water-treatment and filtration applications, and to replace expensive materials such as zeolite.
Materials and methods
Membrane supports
The dry clay material collected from Batna state mountains in Algeria was calcined at 600°C in an electric oven, ground, and then sieved at 160 μm. Powdered calcium carbonate (25 wt.%) was then added. Two organic substances, ‘Sigma Aldrich Methocel® A15 LV (thickening agent)’ and ‘Pinnacle Herbal© Essential Therapeutics Amigel Powder (vegetable gelling agent)’, were introduced at a rate of 3 wt.% to improve pasting properties and to facilitate the forming process. The mixture was blended with an electric mixer, to which a small quantity of water was added until a formable paste was obtained, which was later placed in a plastic bag, sealed, and left for 12 h or more for water to disperse properly in the ceramic paste. After preparation of the ceramic paste, the extrusion process was carried out to prepare the tube-shaped samples, using a special device for this purpose. Immediately afterward, the prepared samples were placed on a rolling drier made of rotating aluminum cylinders designed to dry the sample tubes evenly.
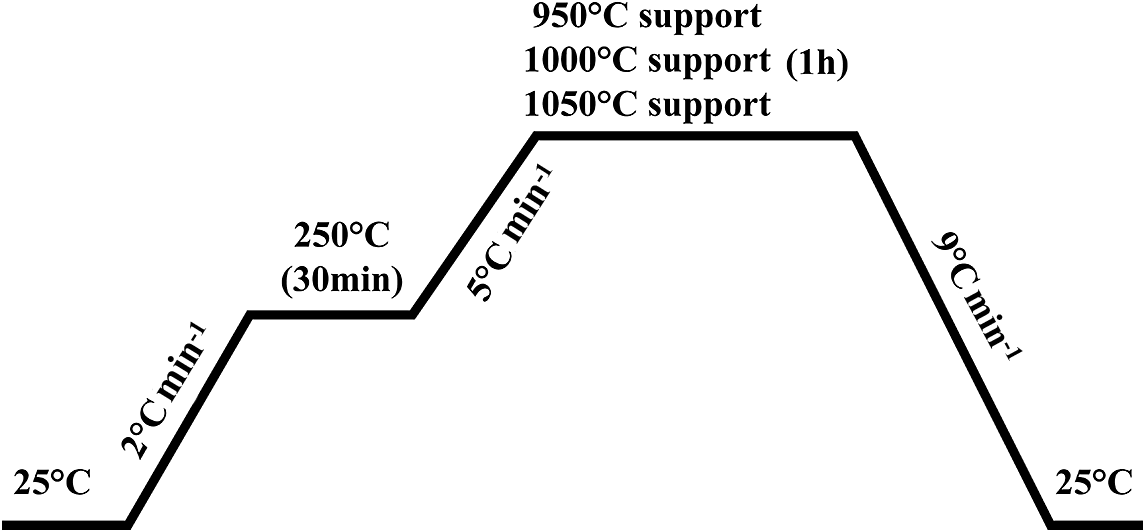
After this preparation, thermal treatment was carried out at temperatures of 950, 1000, and 1050°C for 1 h (Fig. 1). The heating rate (5°C min–1) was determined so that the organic matter added would burn slowly and leave the sample structure with no defects that would affect the structure of the supports.
Illustration of thermal processing: the first ascending temperature gradient of 2°C min–1 reaching 250°C was designed to expel volatile organic residues slowly and to avoid structural cracks or defects. It was held at this temperature for 30 min. A further gradient of 5°C min–1 followed until the desired sintering temperature was reached, with the slow release of CO2 and the burning off of organic additives from the mixture. This led to the formation of clean organized pores, followed by a 9°C min–1 cool down rate to avoid any thermal shock that may affect the ceramic support structure.

Characterization methods
The raw materials (local clay and calcite) used to produce the ceramic supports were characterized using the following methods: chemical analysis by X-ray florescence (XRF) using a Malvern Panalytical Zentium XRF spectrometer calibrated with international geological standards (Cali, Reference Cali1975; Xie et al., Reference Xie, Yan, Wang, Li and Shen1989); X-ray diffraction (XRD) using a Rigaku MiniFlex600 X-ray diffractometer operating with CuKα radiation (at wavelength of 1.54187 Å; particle-size distribution using a Mastersizer 2000 granulometer capable of determining particle sizes from 0.02 μm to 2000 μm); scanning electron microscopy (SEM) using a JCM-5000 Neo Scope in low-vacuum mode; and, finally, a mechanical profile assessment of the membrane supports was performed using a ZWIC R/Roell ZO10 three-point bending instrument.
Flux measurement and permeability test
The aim of the permeability test (Zerhouni et al., Reference Zerhouni, Qabaqous, Rhazi Filali, Naciri Bennani and Tijani2019) was to determine the efficacy of membrane supports and to calculate their permeability modulus. Samples were placed in distilled water for 12 h to achieve flow stability, then permeability tests were carried out using customized crossflow instruments at the Laboratory of Photonic Physics and Multifunctional Nanomaterials (LPPNM) at the Mohamed Khider University, Biskra, Algeria, and the Laboratory of Condensed Matter Physics and Nanomaterials, Jijel University, Jijel city, Algeria. The model used is further described in Fig. 2.
Schematic representation of the customized crossflow instrument used; both directions of compressed air and water flow are denoted with two circular arrows, and the applied pressure on the membrane support was controlled and monitored using the positioned V1, V2, V3, and V4 valves and the manometer.

Results and Discussion
Characteristics of raw materials
X-ray fluorescence
Based on analysis by XRF (Table 1), the raw clay material was composed mainly of silica (SiO2) (45.42 wt.%), alumina (Al2O3) (13.93 wt.%), calcium oxide (CaO) (13.76 wt.%), and iron oxide (Fe2O3) (6.38 wt.%). In addition to the mass loss during heating, estimated at 16.4 wt.%, impurities comprised <3 wt.%. Analysis by XRF of the calcite used verified its purity to be 99.692% (Table 1) before use in the membrane supports.
XRF elemental analysis of the raw clay powder and calcite

X-ray diffraction
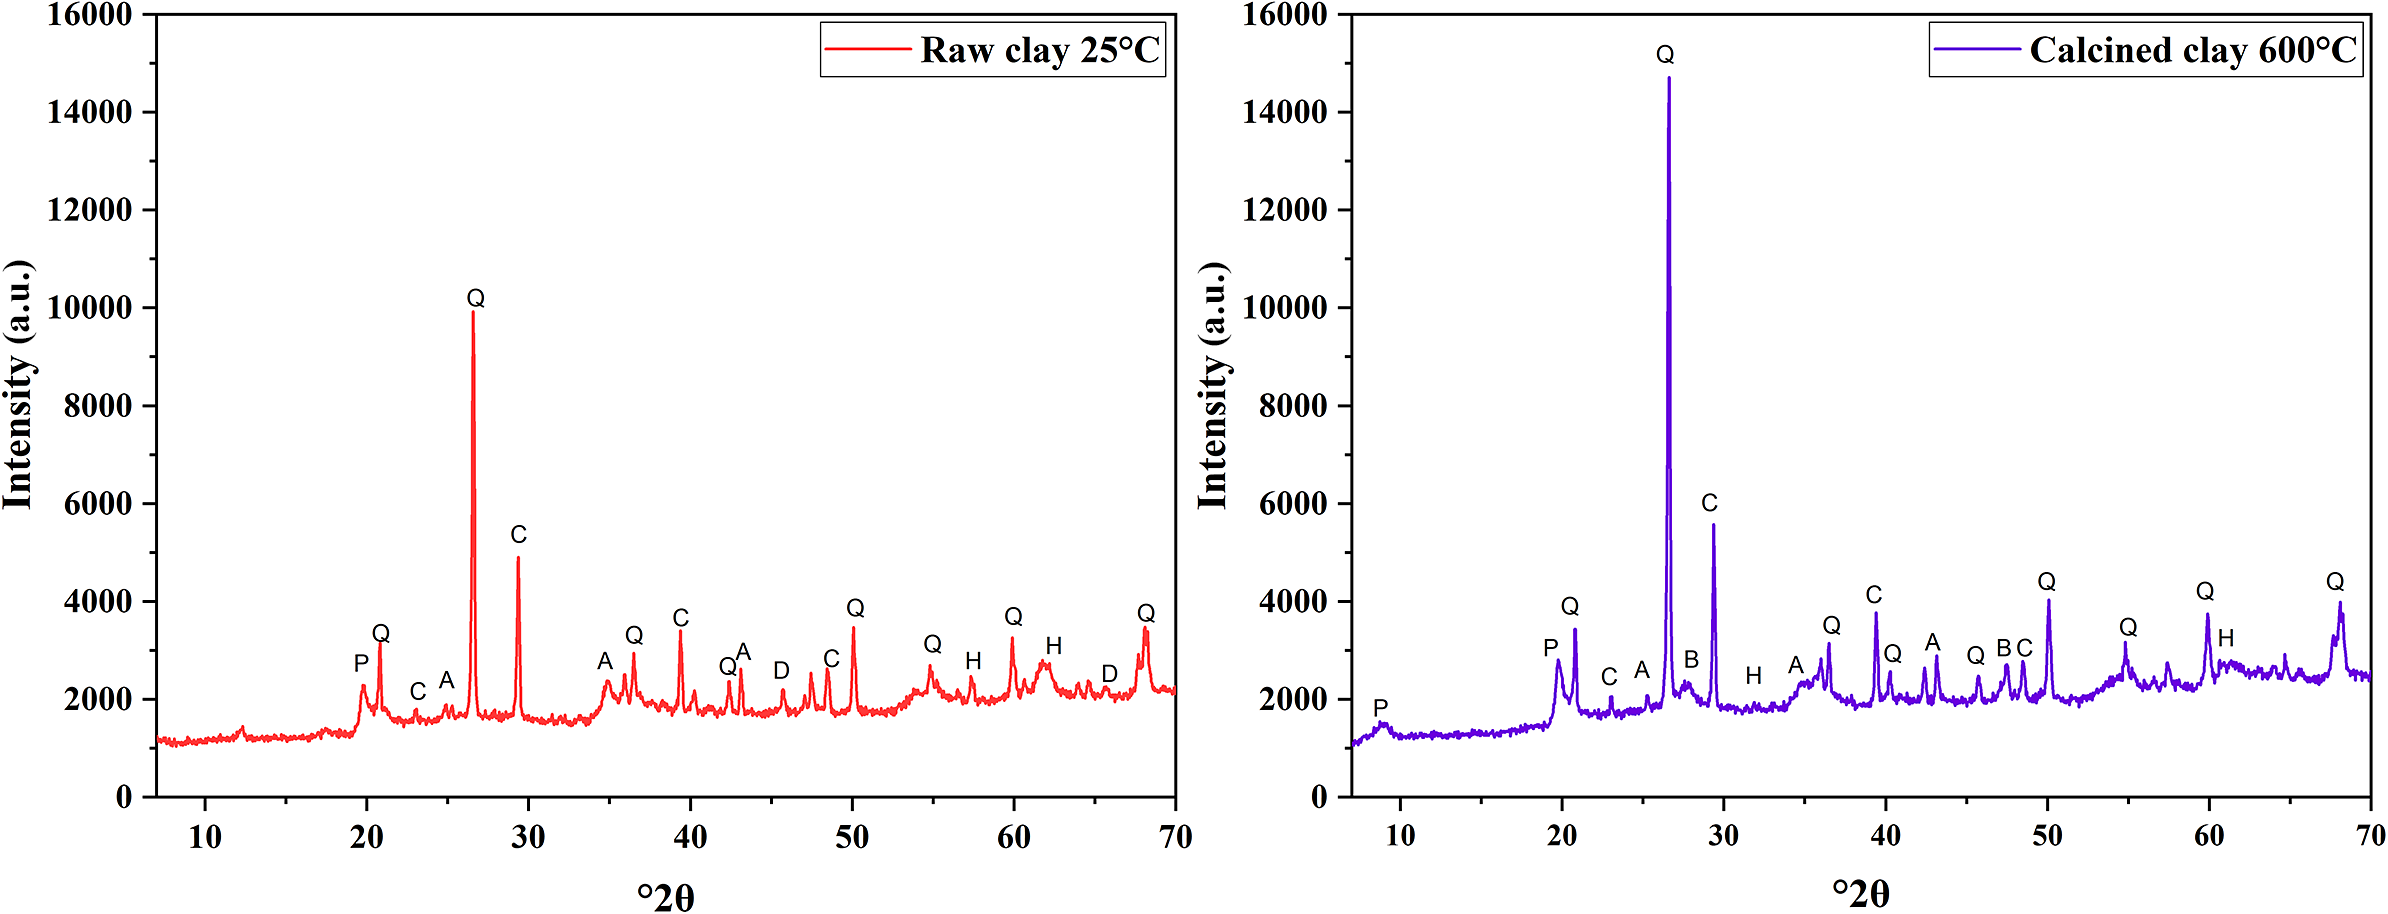
The mineralogical composition of the raw clay material was determined by XRD of heated (calcined 600°C) and unheated (raw clay 25°C) samples (Fig. 3) and the various phases were identified by matching with ASTM data. The results showed that quartz (Q) was the principal phase found in the raw clay material used. The XRF results validate the phases found at this point, where other, less intense phases including alumina (A), calcium oxide (C), and secondary traces of palygorskite (P), hematite (H), dolomite (D), and bredigite (B) match with oxides percentages between SiO2, Al2O3, CaO, and the rest of oxides traces found. The abundance of each oxide is directly correlated with the crystallinity of a certain phase when speaking of simple oxides like SiO2 and CaO for example, where a dominant phase with be remarkable with ease. The calcination process had a clear impact on clay purity by reduction of the humidity and organic materials. The calcination also affected the aforementioned secondary phases with obvious induction in characteristic peaks of quartz and calcium oxide and reducing the peaks relevant to other oxides small traces, suggesting that the minor phases, especially hematite, had low thermal resistance. The XRD and XRF data were in good agreement in terms of phases corresponding to oxides in (Table 1 ).
XRD patterns of clay powder before and after calcination (‘Raw clay’ 25°C; ‘Calcined clay’ 600°C). Q = quartz (ref: 00-046-1045); C = calcium oxide (ref: 00-005-0586); A = alumina (ref: 00-010-0173); H = hematite (ref: 00-024-0072); D = dolomite (ref: 00-036-0426); B = bredigite (ref: 00-036-0399); and P = palygorskite (ref: 00-031-0783).

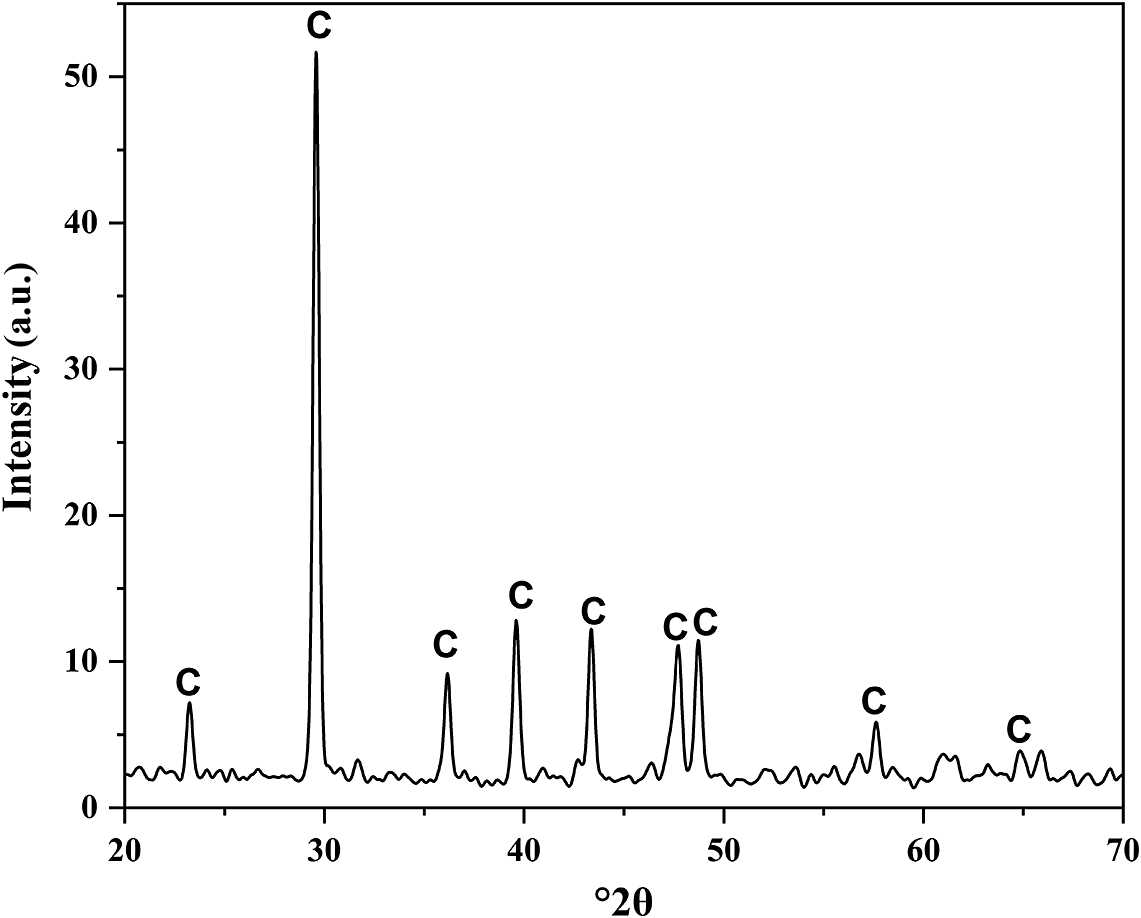
To ensure the purity of the raw CaCO3 material, an XRD analysis was carried out, resulting in the pattern shown in Fig. 4. By matching the pattern with the ASTM patterns, the CaCO3 diffraction peaks were matched to peaks from a reference ASTM CaCO3 diffractogram.
XRD pattern of calcite. The intense calcite peaks indicated its high purity and quality.

Particle-size distribution
To establish the particle-size distribution of the clay used to prepare the support, a sample analysis of this substrate was performed and the results obtained are shown in Fig. 5A. Two patterns of size distribution were noted: diameters ranging from 0.3 to 1.25 μm, representing a minority of particles (0.95 μm grains with a size frequency of 0.91 and a total volume percentage of 9.87%), and with diameters ranging from 1 to 80 μm which represent the majority with the 26.3 μm grains as the strongest particle size frequency 5.88 holding a total volume percentage of 70.5%. These results made sense in relation to the sieving process carried out at the 160 μm level. The global particle diameter was below the level at which sieving was conducted. According to Fig. 5B, the calcite used also displayed particle-size ranges with diameters ranging from 0.7 to 2 μm and a diameter of 1.4 μm as the most common (volume percentage of 11.42% and frequency of 3.04). Diameters also ranged from 2 to 30 μm with the greatest frequency of 12.49 corresponding to particle size of 15 μm representing 69.92% of the total volume. Both sieved clay powder and calcite were under the limits of 160 μm. The frequency starts fading to zero when reaching 80 μm particle size; and for the calcite, the particle size frequency becomes null when reaching 115 μm.
Particle-size distribution for both of the materials used to produce ceramic supports. (A) Particle size distribution pattern of the bentonite after pre-processing via calcination and sieving. The effects of the treatments on the size of most bentonite grains were clear, and this is very important for controlling the pore sizes. (B) The same was true of the calcium carbonate used to ensure the uniform texture of the ceramic paste needed for extrusion, hence the exertion of CO2 gas while maintaining optimal pore sizes in the ceramic supports after calcination.

Analysis of the supports produced
X-ray diffraction
Analysis by XRD (Fig. 6) revealed that each of the supports sintered at different temperatures was composed mainly of three essential phases. The 950°C support was a mixture of 53.2% sillimanite, Al2O(SiO4), 41.6% gehlenite, Ca2Al2SiO7, and traces (5.1%) of low quartz or alpha quartz, SiO2. At 1000°C, gehlenite became the most prominent phase, at 86.5%, with 10.6% of alpha quartz in addition to minor amounts (3%) of H-bearing aluminous stishovite, Si0.981O2Al0.019OH0.019. At 1050°C, the major phase was wollastonite-1A, CaSiO3, at 59.8%, with 35.8% gehlenite, and 4.4% alpha quartz. The percentages of all phases were determined using the Panalytical Highscore Plus software (Degen et al., Reference Degen, Sadki, Bron, König and Nénert2014) with the ICSD database (Hellenbrandt, Reference Hellenbrandt2004).
XRD patterns of sintered supports. (A) Two structures showed clear predominance in the 950°C supports, orthorhombic and tetragonal structures for sillimanite and gehlenite, respectively. (B) A clear dominance of orthorhombic gehlenite is seen in the supports sintered at 1000°C. (C) Wollastonite 1A became predominant in the supports sintered at 1050°C.

These minor changes in sintering temperature had significant impacts on the compositions of the ceramic supports; the gehlenite and alpha quartz percentages fluctuated between primary, secondary, and minor phases. Research on wollastonite synthesis (Zenebe, Reference Zenebe2022; Abo-Almaged et al., Reference Abo-Almaged, Ngida, Ajiba, Sadek and Khattab2024) has suggested that a pure beta-wollastonite structure emerged at temperatures near 1100°C, showing a good correlation with the bentonite clay considering other oxides traces causing fusion-point reduction (Table 1). Nevertheless, the later loss of gehlenite remained an anomaly as the missing alumina portion was not manifested in any structure, suggesting that the siliceous carbonate nature of the primary paste mixture combined with the small proportion of Al2O3 caused a preference for wollastonite at the expense of gehlenite by using the latter as some sort of CaO precursor during sintering, when passing 1000°C.
Scanning electron microscopy
SEM images (Fig. 7) show (at various magnifications) the support surfaces after treatment at various temperatures. There is significant homogeneity on show and few defects or fractures. The pore sizes in the images with a scale bar of 5 μm showed that increased sintering temperatures helped in terms of the organization of pore pattern and size.
SEM images showing the surface morphology of sintered membrane supports. The decline in pore sizes with increased temperature (A: 950°C; B: 1000°C; C: 1050°C) was very evident. The supports sintered at 950°C (A) clearly had disordered welding networks at all scales, especially the images on the left-hand side (scale bars, 5 μm). The overall homogeneity of the surfaces of the supports at higher temperatures (1000°C, B; and 1050°C, C) sees the welding network disorder reduce disproportionately with sintering temperature, suggesting that the emergence of wollastonite as a major phase was responsible for surface harmonization, thus leading to the organized welding system.

The surfaces of the supports are characterized by the presence of significant numbers and different sizes of pores at various temperatures. The particle sizes of the material began to increase, forming necks, welding while fitting between them as the processing temperature increased. At 1050°C, there was greater degree of compaction of adjacent particles, as well as changing shapes and increasing pore dimensions, as large pores displaced pores that migrated across the particle boundaries to the surface or were displaced through other gaps to create larger pores during the sintering process.
Three-point bending test
The mechanical properties of the materials were assessed by performing three-point bending tests on specimens with parallel rectangular shapes. Both tensile strength (σt) and the flexibility coefficient (or Young’s coefficient) (E) of these specimens were measured, allowing us to calculate the bending strength (σf) using Eqn (1) (Harabi et al., Reference Harabi, Zenikheri, Boudaira, Bouzerara, Guechi and Foughali2014):
 $$ {\unicode{x03C3}}_{\mathrm{f}}(\mathrm{M}\mathrm{P}\mathrm{a})=2.7\times {\unicode{x03C3}}_{\mathrm{t}}(\mathrm{M}\mathrm{P}\mathrm{a}) $$
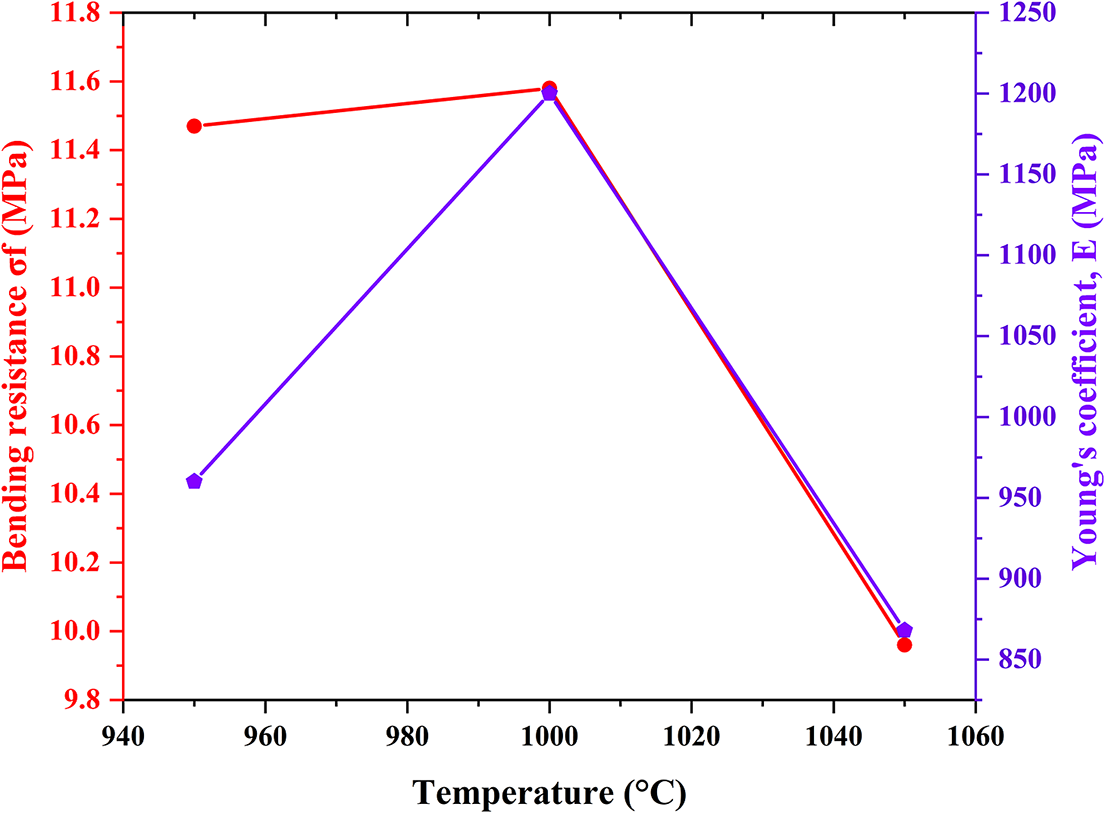
According to Fig. 8, an increase in bending stress values was noted, along with Young’s coefficient, in the 950–1000°C range of temperatures. This change is due to the effects of the sintering process on the treated samples, where the particles begin to agglomerate, forming necks and fitting between them at high temperatures, as well as the stabilization of the ratio of the spaces and their dimensions. On the other hand, there was a remarkable decrease in both bending-stress values and Young’s coefficient, in the range 1000–1050°C. This decrease can be attributed to the perceived increase in the dimensions of pores, as large spaces are created at the expense of pores that migrate across the grain boundary to the surface or connect through other gaps to make larger spaces during the sintering process. The SEM images demonstrate this. The mechanical properties are in correlate with ceramic phases in terms of both quantitative and qualitative aspects. The gehlenite structure appears to be responsible for the overall mechanical stress resistance, according to the Mohs hardness scale, due to its strong presence in all three samples. The percentage of gehlenite (6 on the Mohs scale) in the support sintered at 1000°C provided optimal mechanical properties; the support sintered at 950°C was the next most suitable. The drastic reduction in the proportion of gehlenite in the support sintered at 1050°C was the main cause of poor mechanical strength due to phase heterogeneity leading to non-uniform and relatively fragile ceramic geometry despite the high hardness values of quartz and wollastonite of 7 and 4.5 on the Mohs scale, respectively. The bending resistance and Young’s coefficient values of these clay-prepared filter supports are lower than those prepared mainly using kaolin (Ghouil et al., Reference Ghouil, Harabi, Bouzerara, Boudaira, Guechi, Demir and Figoli2015). The process of support selection depends on its characteristic ratio of ceramic phases, pore dimensions and mechanical properties (Wang et al., Reference Wang, Zhang and Shen2023). The support sintered at 1000°C was best because it has better mechanical properties than the other supports as shown in Fig. 8.
Mechanical properties as a function of sintering temperature. The support sintered at 1000°C shows better bending stress and Young’s coefficient, due to the previously discussed relation between the proportion of gehlenite and its Mohs hardness, both of which affect the fragility of the supports.

Flux and permeability factor
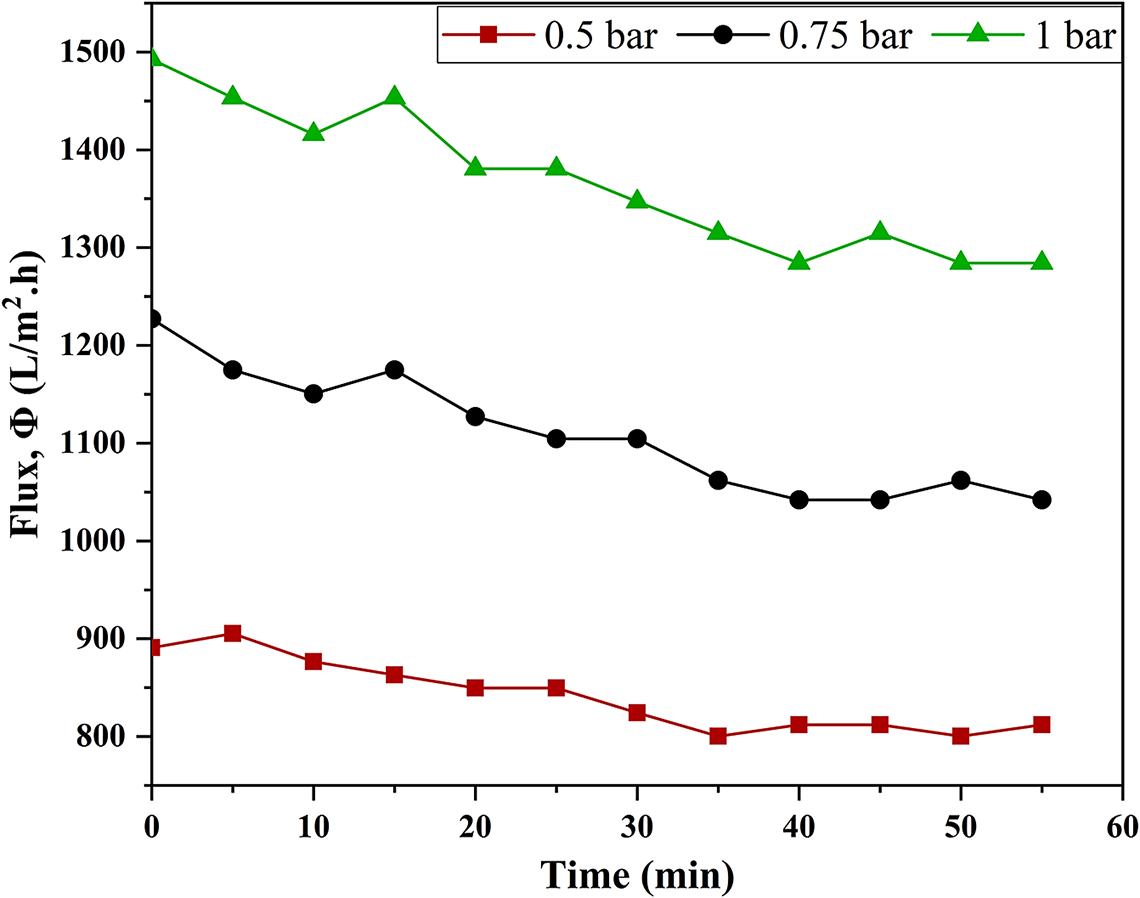
The flux evolution by time under three different pressure values was obtained, as illustrated in the scattering-linked plots (Fig. 9). The flow decreased during the first test periods and then settled within certain values. In addition, the increase in flow value by increasing the pressure was recorded, i.e. the flow value refers to the pressure value applied to it. For an estimated P=0.5 bar, the flow stabilized at 812 L/h m2. For P=0.75 bar, flow stabilization was recorded at 1041 L/h m2. For a pressure value of P=1 bar, flow stabilization was noted at 1284 L/h m2. The water flux values obtained are acceptable compared with micronutrient filters estimated at ~900 L/h m2 (Khemakhem et al., Reference Khemakhem, Amar, Hassen, Larbot, Medhioub, Salah and Cot2004) and other supports from a similar study (Messaoudi et al., Reference Messaoudi, Douma, Tijani and Messaoudi2021). The supports were thus considered to be valid as microfiltration membranes.
Time-resolved flux rate under various levels of pressure for the support sintered at 1000°C. The increase in applied flux pressure was proportional to the mean flux rate. Increasing the flux pressure helped to increase the fluctuation, hence the instability in the flux through the supports. This suggests that extended measurements over a longer time range would eventually lead to a stabilizing flux rate.

Flux measurements were calculated using Eqn (2):
 $$ \phi =\frac{V}{S\times T}\hskip2pt (\frac{\mathrm{L}}{{\mathrm{m}}^2\mathrm{h}}) $$
where
 $ \unicode{x03D5} $
= permeability (L/(m2h)); V = volume permeable through the filter (L); S = area that is permeable (m2); and T = time taken to fill the volume (h).
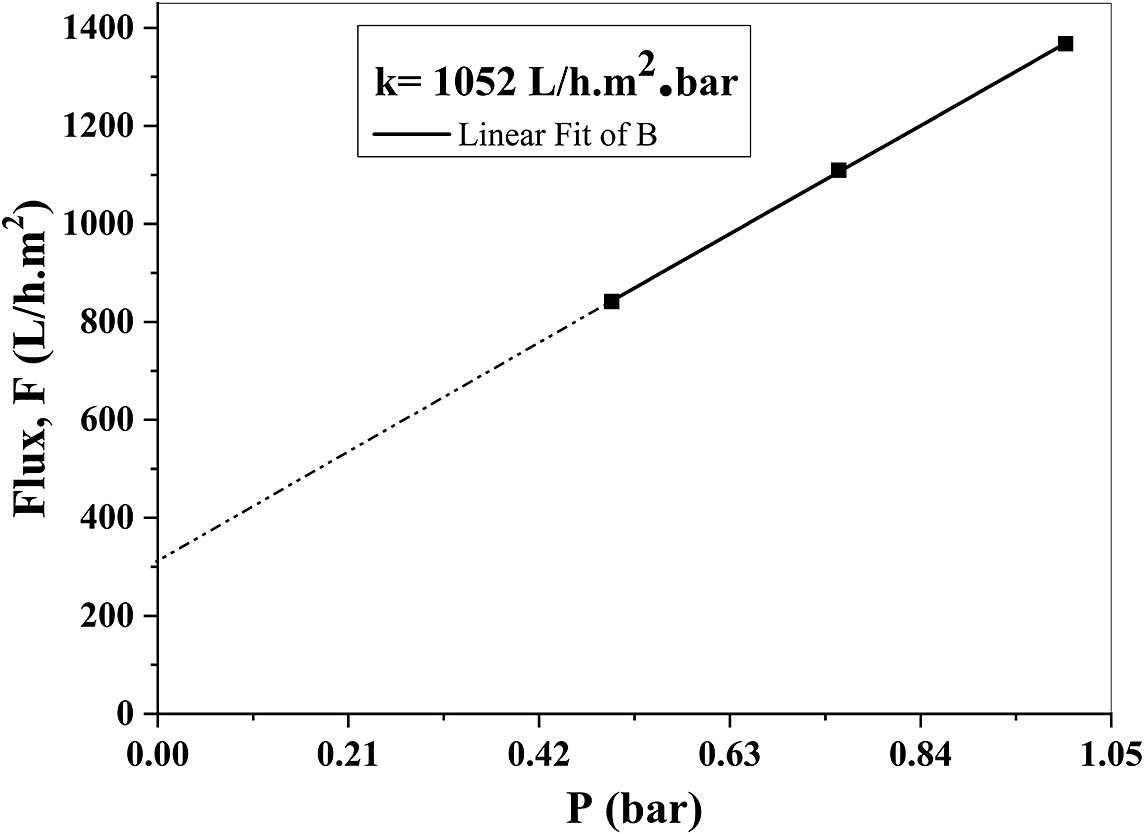
To calculate the k permeability factor, the pressure effect on the flux value was investigated. Several measurements were made and these are illustrated in Fig. 10.
Flux change as a function of the applied pressure. The permeability factor, k, was determined by linear fitting of three flux measurements at three different pressures: 0.5, 0.75, and 1 bar.

A straight line, with a slope and an intercept, was obtained via Eqn (3); the slope represents the coefficient of permeability:
 $$ \unicode{x03D5} =a.x+b, $$
where a = k = 1052 L/m2.bar and b = 317 L/h m2. The intercept representing an initial fluid flux of 317 L/h m2 at 0 bar could be explained by the high porosity ratio and poor fluid resistance of the support, similar to some commercial water filters (Lee et al., Reference Lee, Wu and Li2015). Nevertheless, this particular support had better fluid resistance, based on reported results, than values from other raw materials such as fly-ash-based ceramic membranes and other composites (Suresh et al., Reference Suresh, Pugazhenthi and Uppaluri2017; Goswami and Pugazhenthi, Reference Goswami and Pugazhenthi2020; Goswami and Pugazhenthi, Reference Goswami and Pugazhenthi2022). Note that fixing the flux pressure without taking into consideration the time of measurement of the flux assisted the opening of the support’s pores, due to the direct linearity of the flux measurements as a sign of minimal measurement error; thus it was a pressure-dependent constant flux.
One of the standard applications of the support acquired was to use it for conventional microfiltration by reducing turbidity and successfully removing pollutants as shown in Fig. 11, where the evident difference in the water before and after filtration was remarkable. This certainly qualifies the support for microfiltration and possibly nanofiltration membranes deposition.
Variation in phase clarity and turbidity before and after filtering, proving the reliability of the ceramic support for filtration applications.

Conclusions
Researchers seek technical solutions for filtering wastewater effectively, using membranes. The membranes require ceramic supports to give them the required mechanical properties. This research focused on study of the properties of ceramic supports prepared using local primary materials (clay and calcite), the phases formed during preparation, and the bonding produced by those phases. To that end, a single-channel tubular ceramic support was prepared and its characteristics examined. The effects of thermal treatment on the mechanical properties and the permeability coefficient of the support prepared were determined. During preparation of these ceramic supports, phases, mainly gehlenite, low quartz, sillimanite, aluminous H-bearing stishovite, and wollastonite-1A, were formed. The supports treated at 1000°C also had significant flexural strength properties (11.58 MPa) compared with the supports cured at other temperatures and had a permeability factor of 1052 L/h m2 bar. These could be used as supports for microfiltration and ultrafiltration membranes, as well as for nanometric membranes supports, and directly as membranes for water filtration applications.
Data availability statement
Data are contained within the article.
Acknowledgments
None.
Author contribution
Boukhemis Boudaira: data processing, methodology, investigation, writing - original draft, supervision, conceptualization; Tarek Melki: visualization - revision - original draft; Mohamed Mouadh Messaoui: visualization, software, revision - original draft; Abdelhek Amri: methodology, data processing, writing - original draft, conceptualization; Fatma Amraoui: revision - original draft; Lobna Messeddek: revision - original draft; Djamel Belamri: methodology, investigation, validation; Boudjemaa Ghouil: methodology; Abdelhamid Harab: methodology
Financial support
No financial support was provided for this work.
Competing interests
The authors declare that they have no known competing financial interests or personal relationships that could have appeared to influence the work reported in this paper.