What is certain is that econometrics now occupies a position in teaching programs that puts it on an equal footing with microeconomic and macroeconomic theory; and in research there seems to be no area of economics untouched by econometric method. To keep abreast of these changes, we intend to provide regular updates of the rankings of research activity presented in this issue of Econometric Theory.
—Peter C.B. Phillips (1987, Econometric Theory 3, 169)
1. INTRODUCTION
In 1985, Peter C.B. Phillips, the editor of Econometric Theory (ET), commissioned a worldwide ranking of research activity in econometrics that was the first of its kind; see Hall (1987). More than 21 years later, we have witnessed four updates (counting this study) of the original Hall ranking paper published in ET. These updates are given in Hall (1990) and Baltagi (1998, 2003). These econometrics rankings have attracted a lot of attention, praise, criticism, and controversy. They have been posted on the ET Web site, http://korora.econ.yale.edu/et/, and used by departments and deans to evaluate faculty and econometrics programs. Ranking studies in the field of economics have been a thriving industry and include classic articles such as Graves, Marchand, and Thompson (1982), Hirsch, Austin, Brooks, and Moore (1984), Conroy, Dusansky, Drukker, and Kildegaard (1995), Scott and Mitias (1996), and Dusansky and Vernon (1998), to mention a few. More recently, a special issue of the Journal of the European Economic Association published six papers based on a symposium of EEA-funded studies to evaluate economic research in Europe; see Neary, Mirlees, and Tirole (2003, p. 1240). “The Council of the EEA took the view that it was very desirable to encourage more studies of this kind, given the poor governance structures and inappropriate incentives that still characterize so many European universities. The results should help all those attempting to evaluate and develop research capacity, including officials in charge of overseeing and funding universities, and university officers trying to assess the quality of their economics department.” Economics rankings have also been done by region and country; see Lucas (1995) for Canada, Smyth and Smyth (2001) for the United Kingdom, Dolado, Romero, and Zamarro (2003) for Spain, Combes and Linnemer (2001) for France, Bairam (1996) and King (2001) for New Zealand, Harris (1990) and Sinha and Macri (2002) for Australia, and Jin and Yau (1999) for East Asia, to mention a few. As important as economics rankings are, they obscure the quality and productivity of econometricians in these departments. Our rankings help strip away the protection of the larger economic department to judge the productivity of econometricians within these departments.
We followed the initial study by Hall (1987) in the choice of journals to ensure continuity and comparison of econometrics rankings over time. These journals include American Economic Review (AER), Econometrica, Economic Journal (EJ), Econometric Theory (ET), International Economic Review (IER), Journal of the American Statistical Association (JASA), Journal of Business & Economic Statistics (JBES), Journal of Political Economy (JPE), Journal of Econometrics (JoE), Journals of the Royal Statistical Society (JRSS), Oxford Bulletin of Economics and Statistics (OBES), Review of Economics and Statistics (REStat), Review of Economic Studies (REStud), Journal of Applied Econometrics (JAE), Econometrics Journal (EctJ), and Econometric Reviews (ER). Except for the addition of JAE, OBES, and EctJ, and the deletion of Journal of Monetary Economics (JME), these are the same journals used by Hall (1987, 1990). Note that OBES was not included in Hall's rankings and JAE and EctJ were new entries on the econometrics scene. The updates by Baltagi (1998, 2003) included JAE but not OBES and EctJ. The choice of journals has always been controversial, with some econometricians and referees wanting to include more statistical journals, such as the Annals of Statistics, Biometrika, and the Journal of Time Series Analysis,1
and others wanting more econometric journals, such as OBES and EctJ. Econometricians surveyed in between rankings have also suggested deleting general journals such as EJ, JPE, and AER and field journals such as JME. In response to these concerns, JME was dropped, and OBES and EctJ were added.2In fact, an econometrics ranking by Cribari-Neto, Jensen, and Novo (1999) over the period 1986–1996 focused on the following 11 economics and statistics journals: Annals of Statistics, Biometrika, JASA, Econometrica, ET, IER, JAE, JBES, JoE, REStat, and REStud. Nine of these journals were common with the 16 journals used in this study. Only the Annals of Statistics and Biometrika were not included in our study, while the Cribari-Neto et al. (1999) study excluded AER, JPE, EJ, JRSS, ER, OBES, and EctJ.
Data for this study were downloaded from the EconLit database and cover the period 1989–2005. Historical remarks, software and book reviews, interviews, problems and solutions, comments, and errata were excluded from the database. The May issue of the AER is also dropped because it contains shorter articles from the proceedings of the AEA meetings. A substantial amount of work went into cleaning and checking these data. Some of the problems encountered were due to the lack of standardization of affiliation and authors' names; missing information, including omission of articles and omission of authors especially on multiauthored papers; typos; errors in publication date, page numbers, etc. Most of these problems were resolved using the Worldwide Web and by obtaining the original articles. Articles with no substantial econometrics content were dropped from the database. The remaining articles were classified as applied or theoretical econometrics. In the case of n joint authors, each author received (1/n) of the publication credit. In the case that an author has m affiliations, each affiliation received (1/m) of the publication credit given to that author. Hall (1990) standardized the page counts across the 16 journals using conversion factors reported in Table 1. These conversion factors are based upon the average number of characters published on one page of the respective journal with the numeraire set equal to 1 for an Econometrica page. Because of the heterogeneity of the articles published in early issues of Econometric Reviews, each article had to be scanned and assigned a conversion factor. This has changed recently when Econometric Reviews moved to a standardized page format in 2001. The Hall conversion factor after 2001 is 0.83.
Data summary, 1989–2005

Table 1 shows that over this 17-year period there were a total of 8,571 articles in econometrics attributed to 6,675 distinct authors with a total of 180,637 standardized pages. For theoretical econometrics, there were 3,131 articles attributed to 2,242 distinct authors with a total of 69,340 standardized pages. Using Table 1, one can answer the following questions.
1. Which journals publish the most standardized pages in the field of econometrics?
Over the period 1989–2005, a total of 69,340 standardized pages were published in the field of econometric theory in these 16 journals. Thirty-three percent of these standardized pages were published by JoE, followed by ET (18.9%), Econometrica (11.7%), JASA (6.6%), and ER (5.9%). Similarly, a total of 180,637 standardized pages were published in the field of econometrics over the period 1989–2005 in these 16 journals. Eighteen percent of these appeared in JoE, followed by REStat (10.4%), AER (7.9%), ET (7.4%), JBES (7.3%), Econometrica (6.8%), and JAE (6.7%).
2. Which journals published the greatest number of articles (or ideas) in the field of econometrics?
Over the period 1989–2005, a total of 3,131 econometric theory articles were published in these 16 journals. Thirty percent of these articles were published in JoE, followed by ET (18.4%), Econometrica (10.5%), ER (7.4%), JASA (7.3%), and JBES (5.4%). Similarly, a total of 8,571 econometrics articles were published over the period 1989–2005 in these 16 journals, with 15.7% of these articles appearing in JoE, followed by 15.5% in REStat, 8.3% in JBES, 6.9% in AER, and 6.8% in ET. These data are consistent with the earlier study of Baltagi (2003) and confirm that these journals are major outlets for econometric theory publications.
3. Using all econometric articles published in these 16 journals, which journals have the highest concentration in econometric theory?
Out of 585 econometric articles published by ET over this period, 577 were classified as econometric theory. In fact, ET, true to its name, had the highest concentration of econometric theory articles (99%), followed by ER (87%), EctJ (80%), Econometrica (71%), JoE (71%), and JASA (68%). This did not change when we used standardized pages. In fact, 98% of the standardized pages of econometrics published by ET were devoted to econometric theory. This is followed by ER (87%), EctJ (80%), JoE (72%), JASA (67%), and Econometrica (66%).
Although the Hall conversion factors standardize the article size according to character count, they do not take into account the quality of the journal. The latter has been mostly based on citation impact of the journal; see Liebowitz and Palmer (1984), Laband and Piette (1994), and Kalaitzidakis, Mamuneas, and Stengos (2003) (hereafter KMS). In the words of Laband and Piette (1994, p. 641): “citations are the scientific community's version of dollar voting by consumers for goods and services.” Impact factors are usually obtained from the Social Sciences Citation Index Journal of Citation Reports. Weighting journals by their citation impact factors is not without its critics. For example, KMS correct these factors by excluding self-citations to the journal and adjusting for the age and size of the journal. In this study, we check the sensitivity of the rankings to alternative journal weightings. Besides the Hall conversion factors that adjust for page size, we use a year by year impact citation factor (SSCI) to weight each journal article by the impact citation of that journal in the year that article was published. This is better than using one impact factor for that journal over the whole time period of study.3
Baltagi (2003) used the 1998 impact citation factors, which include citations for articles published in the previous two years in that journal (i.e., 1996 and 1997).
These alternative impact factors make a drastic difference in the relative weights of some journals. For example, ET has a weight of 0.60 using LBKP, 0.46 using KMS, and an average SSCI impact factor of 0.28 over the period 1989–2005.4
Although we used yearly SSCI impact factors for each journal over the period 1989–2005, we report the average in Table 1 over the entire period for comparison purposes. We normalized the SSCI impact factor, so that AER is 1 in 1989.
2. RANKINGS USING THEORETICAL ECONOMETRICS CONTRIBUTIONS
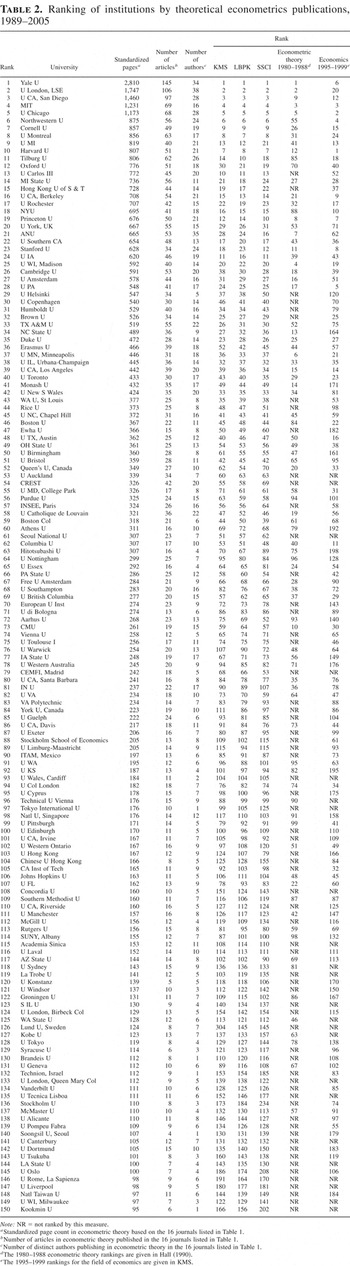
Table 2 ranks the top 150 academic institutions for theoretical contributions in econometrics. This is based on the total standardized page count published by individuals associated with these academic institutions for the 17-year period 1989–2005. Also included are the world rankings for the field of economics over the period 1995–1999 published by KMS. The latter worldwide rankings of academic institutions in economics are based on publications in 30 leading economic journals, 12 of which are common with the 16 journals listed in Table 1. Because KMS adjust the weights for each journal to take into account the impact citations (excluding self-citations) and the size and age of the journal, these are best compared with our econometric theory rankings using the same KMS weights.
Ranking of institutions by theoretical econometrics publications, 1989–2005

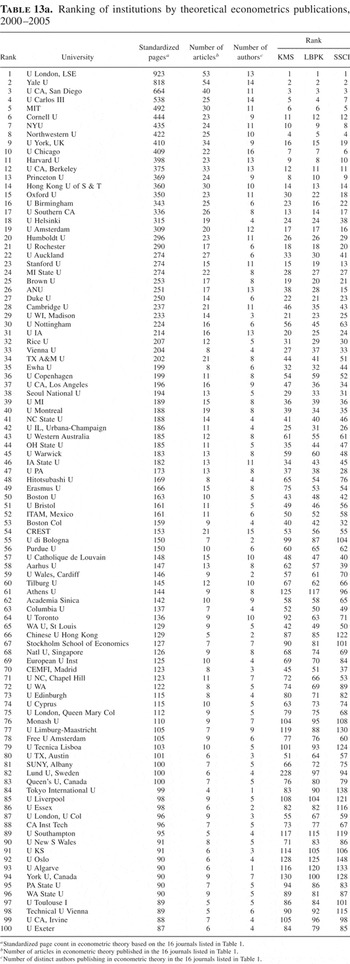
Yale University is the top ranked institution in theoretical econometrics over the period 1989–2005 with 145 articles and 2,810 standardized pages attributed to 34 authors in these 16 journals. It has dominated the number one spot since 1980, as is clear from the earlier rankings over the periods 1980–1988 and 1989–1999 by Hall (1990) and Baltagi (2003). The London School of Economics is ranked second with 106 articles and 1,747 standardized pages attributed to 38 authors. It has held this second rank position since 1980. The columns labeled KMS, LBPK, and SSCI in Table 2 give the alternative rankings, weighting the journals by the three impact measures described previously. Note the relative stability of these rankings for the top 10 academic institutions. The only exception is the University of Michigan, which is ranked 9 by standardized page count, 21 by the SSCI measure, 13 by KMS, and 12 by LBPK. The University of California–San Diego was ranked 9th in 1980–1988 by Hall (1990) and is now ranked 3rd for the 1989–2005 period. MIT is 4th, Chicago is 5th, Northwestern is 6th, no matter what impact measure is used. The University of Michigan has seen a big improvement in its rankings, moving from 41 in 1980–1988 to 9 in 1989–2005. Other big movers in theoretical econometrics publications rankings are Northwestern University, which was 55 in 1980–1988 and is now 6 in 1989–2005; Tilburg University, which climbed from 85 in 1980–1988 to 11 in 1989–2005; and the University of Montreal, which climbed from 31 in 1980–1988 to 8 in 1989–2005. Oxford University, which was 70 in 1980–1988, is ranked 12 in 1989–2005. The University of Carlos III, which was not ranked in 1980–1988, is ranked 13 in 1989–2005. Michigan State University, which was 27 in 1980–1988, is now ranked 14 in 1989–2005. Similarly, Cornell improved from 26 to 7, Rochester from 32 to 17, York from 53 to 20. Hong Kong University of Science & Technology went from “not ranked” in 1980–1988 to 15 over the period 1989–2005. This demonstrates the influence of highly productive theoretical econometricians as they move across universities. Universities that have dropped in the theoretical econometrics rankings include the University of Minnesota, from 6 in 1980–1988 to 37 over the period 1989–2005; Australian National University, from 7 to 21; and the University of Wisconsin at Madison, from 4 to 25. Over this 17-year period 1989–2005, it took about 95 Econometrica equivalent pages in econometric theory to rank among the top 150 academic institutions. It takes an additional 75 pages to rank in the top 100 and 190 extra pages to move from rank 100 to rank 50. The climb is steeper at the top, as it takes more than 1,637 pages to move from rank 5 to rank 1.
Note that Yale, which ranked first in econometric theory over 1989–2005, is only ranked 6 in economics over the period 1995–1999 by KMS, whereas Harvard, which ranked first in economics over 1995–1999 by KMS, is ranked 10 in econometric theory over the period 1989–2005. This difference in rankings is more dramatic for the University of California–San Diego, which ranked 12th in economics over the period 1995–1999 and 3rd in econometric theory over the period 1989–2005. Also, Michigan State ranked 28 in economics, while ranking 14 in econometric theory.
3. RANKINGS USING ALL CONTRIBUTIONS IN ECONOMETRICS
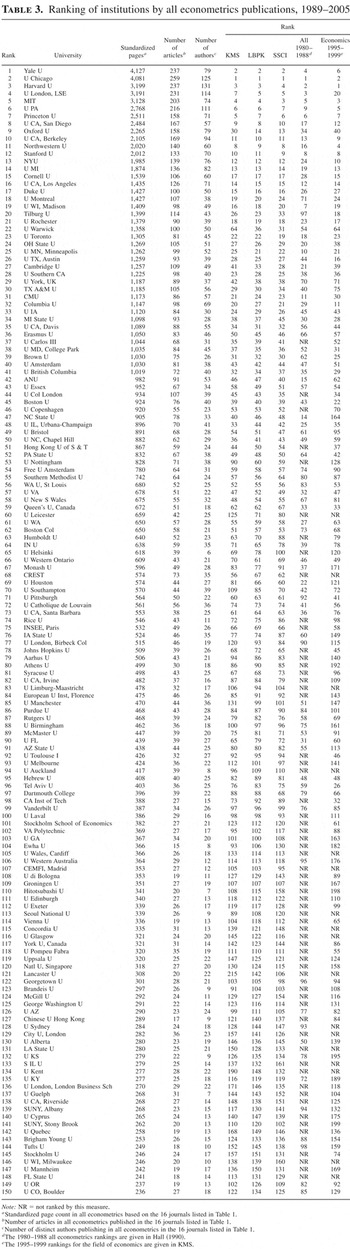
Table 3 ranks the top 150 academic institutions by all econometrics publications over the period 1989–2005. This table has the same format as Table 2. The ranking is based on the total standardized page count of all econometrics articles published by individuals associated with these academic institutions for the 17-year period 1989–2005. Yale is the top ranked academic institution based on all econometrics publications over the period 1989–2005 with 237 articles and 4,127 standardized pages attributed to 79 authors in these 16 journals. Chicago is ranked second with 259 articles and 4,081 standardized pages attributed to 125 authors. The columns labeled KMS, LBPK, and SSCI in Table 3 give the alternative rankings, weighting the journals by the three impact measures described earlier. Note that by these measures Chicago is now ranked first. Again, we note the relative stability of these rankings for the top 19 academic institutions. One exception is Oxford, which is ranked 9th by standardized pages but falls to 30 by the KMS measure, 14 by the LBPK measure, and 13 by the SSCI measure. Comparing 1980–1988 rankings with those for 1989–2005, we see that Oxford moved up from 34 to 9, Tilburg from 97 to 20, Warwick from 54 to 22, and York from 70 to 29. Universities who have dropped in the all econometrics rankings include the University of Wisconsin at Madison from 7 in 1980–1988 to 19 over the period 1989–2005; the University of Minnesota from 10 to 25; Carnegie Mellon University from 11 to 31; Australian National University from 15 to 42.
Ranking of institutions by all econometrics publications, 1989–2005

Over the period 1989–2005, it took a total of 234 Econometrica equivalent pages to rank an academic institution in the top 150. It takes an additional 153 pages to move into the top 100. The climb is steeper closer to the top 50, requiring more than 495 additional pages to move from 100 to 50. From rank 5 to rank 1, an additional 999 pages are required.
4. THE ECONOMETRICIANS' HALL OF FAME
Table 4 shows the list of the top 150 individual publishers in theoretical econometrics in the 16 journals considered from 1989 to 2005. These were ranked using the number of standardized pages published in econometric theory in the 16 journals over this 17-year period. The institutional affiliation is the one listed on the author's most current article and in some cases has been updated to reflect the most current known affiliation. Unlike the case for Tables 2 and 3, where only academic institutions are ranked, the individual rankings are based upon all publications regardless of affiliation type, whether academic or nonacademic. In the case of n joint authors, each author is assigned (1/n) of the publication credit. It took at least 100 Econometrica equivalent pages in econometric theory to belong to the top 150 lists. The top 50 individuals published at least 194 Econometrica equivalent pages, and the top 10 individuals published at least 402 Econometrica equivalent pages over this 17-year period—this is more than 23 pages a year.
Ranking of individuals by theoretical econometrics publications based on standardized page counts, 1989–2005

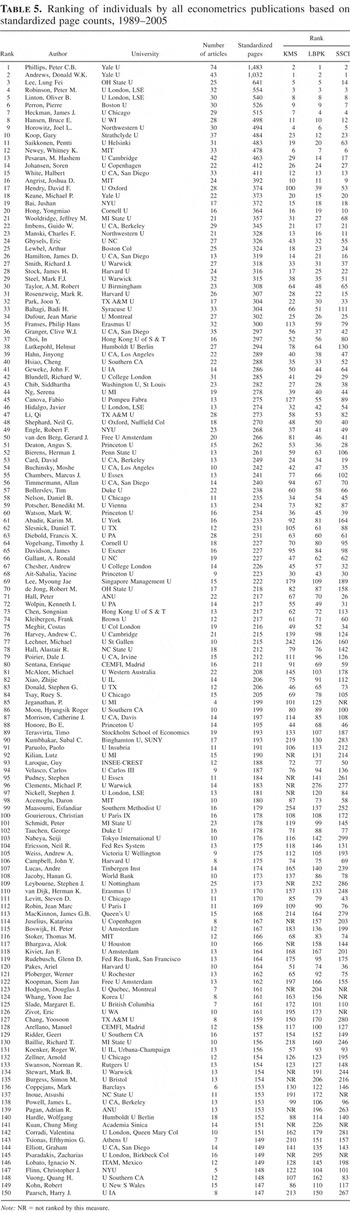
Similarly, Table 5 gives the list of the top 150 individual publishers in all econometrics from 1989 to 2005. These are based on the number of standardized pages published in all econometrics in the 16 journals over this 17-year period. It took at least 147 Econometrica equivalent pages to belong to this top 150 list. The top 50 individuals published more than 266 Econometrica equivalent pages, and the top 10 individuals published more than 484 pages over this 17-year period—this is more than 28 pages a year.
Ranking of individuals by all econometrics publications based on standardized page counts, 1989–2005

Table 6 shows an alternative ranking of individuals based on the number of articles published in theoretical econometrics in the 16 journals considered over the period 1989–2005. This alternative ranking counts an article as an idea and does not penalize the author for co-authorship as the page count does. However, this table suffers from a quality differential problem in that it weights an article equally among journals and does not reward it for its length or its impact. This table gives a list of 177 individuals who published 7 or more econometric theory articles in these 16 journals over this 17-year period. This ranking differs from that in Table 4, showing the penalty effect of the (1/n) division and the use of standardized page count. For example, Qi Li, who published 27 articles in econometric theory over this period, ranks 8th by article count in Table 6 as compared to 23 by standardized pages in Table 4. Other notable differences in rankings include M. Hashem Pesaran, who ranks 12 in Table 6 and 24 in Table 4; Clive Granger, who is 21 in Table 6 and 58 in Table 4; and Peter Schmidt, who is 23 in Table 6 and 70 in Table 4.
Ranking of individuals by the number of theoretical econometric articles, 1989–2005

Similarly, Table 7 ranks individuals based on the number of articles published in all econometrics in the 16 journals considered over the period 1989–2005. This table gives a list of 151 individuals who published 12 or more econometrics articles in these 16 journals over this 17-year period. Once again the rankings differ from those in Table 5. For example, Clive Granger, who has 35 articles over this period, is 5th in this ranking but 36 in Table 5 according to the standardized page count. Frank Diebold, with 28 articles over this period, is 22nd in this ranking but ranks 63 by the standardized page count. Other examples of a large differential in rankings include Philip Hans Franses, who published 32 articles over this period and ranked 11th by article count as compared to 35th by the standardized page count. Richard Blundell, who published 31 articles over this period, ranked 13th by article count as compared to 42 by the standardized page count.
Ranking of individuals by the number of all econometric articles, 1989–2005

5. IMPACT FACTOR: QUALITY ADJUSTED RANKINGS
To check the sensitivity of these rankings to quality differences across journals, we used the three impact factors described earlier that account for quality: KMS, LBPK, and SSCI. Multiplying these impact factors by the standardized page conversion used by Hall (1990) we obtain quality adjusted conversion rates. As is clear from these impact factors (see the last columns of Table 1), Econometrica and AER get premium weights, whereas JAE and OBES are highly discounted by the KMS weights, and ET and OBES are highly discounted by the SSCI weights. The columns of Tables 2 and 3 labeled KMS, LBPK, and SSCI show how the academic institutions rankings for theoretical and all econometrics are affected using these quality adjusted conversion rates. Similarly, the columns of Tables 4 and 5 labeled KMS, LBPK, and SSCI show how the individual rankings for theoretical and all econometrics are affected using these quality adjusted conversion rates.
For the theoretical econometrics rankings in Table 2, there is total agreement in the rankings for the top 6 universities by LBPK, KMS, and SSCI measures. Dispersions in the rankings occur as we move down in the table. For example, whereas the University of Wisconsin at Madison is ranked 25 by standardized pages, it is ranked higher by the impact weight rankings: 20 by KMS, 22 by LBPK, and 20 by the SSCI measures. The reverse is true for Oxford, which ranks 12th by standardized pages but is ranked lower by the impact weight rankings: 30 by KMS, 21 by LBPK, and 19 by the SSCI measures.
For the all econometrics rankings in Table 3, the London School of Economics ranks 4th by standardized pages but is ranked 7 by KMS, 5 by LBPK, and 5 by the SSCI measures. The University of Warwick ranks 22nd by standardized pages but is ranked 64 by KMS, 36 by LBPK, and 31 by the SSCI measures.
From the individual's rankings in econometric theory in Table 4, Peter C.B. Phillips has the top position in theoretical econometrics by the Hall and LBPK ranks and is second by the KMS and SSCI ranks. Don Andrews is second by the Hall and LBPK ranks and first by the KMS and SSCI ranks. Peter Robinson moves up from 4th to 3rd, whereas Lung-Fei Lee drops from 3rd to 4th, 5th, or 8th, depending on the quality adjusted measure. Pentti Saikkonen moves down from 6th to 14th, 13th, or 32nd place, depending on the quality adjusted measure. Overall, the individual rankings are sensitive to these quality factor adjustments. Those individuals publishing more in Econometrica move up, whereas those publishing more in ET, OBES, and ER, for example, move down. Among the gainers are Joel Horowitz, moving up from 9 to 4, 7, or 5; James Stock, moving up from 33 to 20, 27, or 21; Guido Imbens, from 28 to 24, 20, or 15; Yacine Ait-Sahalia, from 52 to 22, 30, or 19, Bo Honore, from 49 to 26, 32, or 23; Chuck Manski, from 40 to 23, 26, or 18; Werner Ploberger, from 65 to 36, 49, or 35; Rosa Matzkin, from 89 to 37, 56, or 27; and Andrew Chesher, from 87 to 38, 55, or 30. Among the losers from this quality adjustment in the rankings are Helmut Lutkepohl, from 26 to 58, 43, or 83; David Hendry, from 32 to 199, 77, or 88; Philip Hans Franses, from 60 to 162, 90, or 104; Myoung Jae Lee, from 64 to 131, 96, or 120.
From the individual's rankings in all econometrics in Table 5, Peter C.B. Phillips has the top position in all econometrics by the Hall and LBPK ranks and is second only by the KMS and SSCI ranks. Don Andrews is second by the Hall and LBPK ranks and first by the KMS and SSCI ranks. Among the top 10 econometricians, Lung-Fei Lee drops from 3rd to 5th or 14th, and Penti Saikkonen moves down from 11th to 19th, 20th, or 63rd. Jim Heckman moves up from 7th to 4th, and Jeff Wooldridge drops from 21 to 31, 27, or 68. Mark Rosensweig moves up from 31 to 28, 22, or 15, and Baltagi moves down from 33 to 66, 51, or 111. James Stock climbs from 28 to 17, 25, or 22, and Philip Hans Franses falls from 35 to 113, 59, or 79. These quality adjusted rankings have even more dramatic effects as we go down the list.
6. RANKINGS OF INDIVIDUALS AND ACADEMIC INSTITUTIONS BY JOURNAL
Next we focus on specific journals, namely, Econometrica, JoE, and ET. This controls for quality differences between journals but not among articles within the same journal. Table 8 lists the top 20 academic institutions by standardized pages in all econometrics by journal, over the period 1989–2005. This ranking is compared with the corresponding ranking in Table 3 for all 16 journals. Note that 16 out of the top 20 universities publishing in Econometrica are in the top 20 list ranked by standardized pages in all 16 journals.5
Bairam (1994) ranked universities by the total number of pages in Econometrica over the period 1985–1990.
Top 20 universities by number of pages by journal, 1989–2005

Table 9 gives the top 100 universities by standardized pages in the three core econometrics journals: Econometrica, ET, and JoE over the period 1989–2005. This was suggested by one of the referees. Tilburg is now 11 rather than 20, the University of Montreal climbs to 10 rather than 18, and Michigan State is 18 rather than 34. Harvard, on the other hand, drops from 3 to 8 and the University of Pennsylvania from 6 to 14.
Top 100 universities by standardized pages in three core econometric journals, 1989–2005

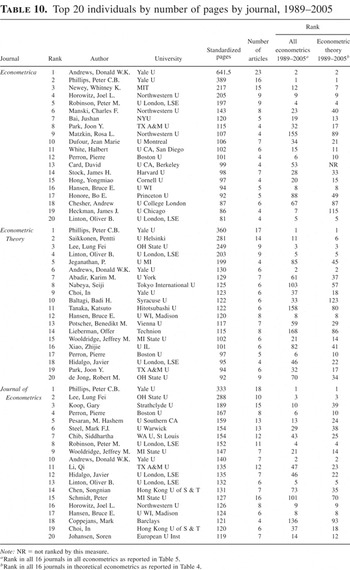
Table 10 shows the top 20 individuals by standardized pages in three core econometrics journals as represented by Econometrica, ET, and JoE over the period 1989–2005. The top 20 producers are also listed in the top 150 by all 16 journals; see Table 5. Peter C.B. Phillips ranks first in JoE, first in ET, and second in Econometrica over the period 1989–2005. Donald Andrews ranks first in Econometrica, 10th in JoE, and 6th in ET. Lung-Fei Lee ranks second in JoE and third in ET and is not ranked in the top 20 in Econometrica.
Top 20 individuals by number of pages by journal, 1989–2005

Table 11 gives the top 100 individuals by standardized pages in the three core econometric journals, Econometrica, ET, and JoE, over the period 1989–2005. Note that the top three people, by standardized pages, in the three core econometric journals are the same as in all 16 journals reported in Table 5. Oliver Linton is now 4th by this ranking as compared to 5th in Table 5, Peter Robinson is 5th by this ranking as compared to 4th in Table 5, and Joel Horowitz is 6th rather than 9th. Only 16 individuals in Table 11 are not in the top 150 listed in Table 5.
Top 100 individuals by standardized pages in three core econometrics journals, 1989–2005

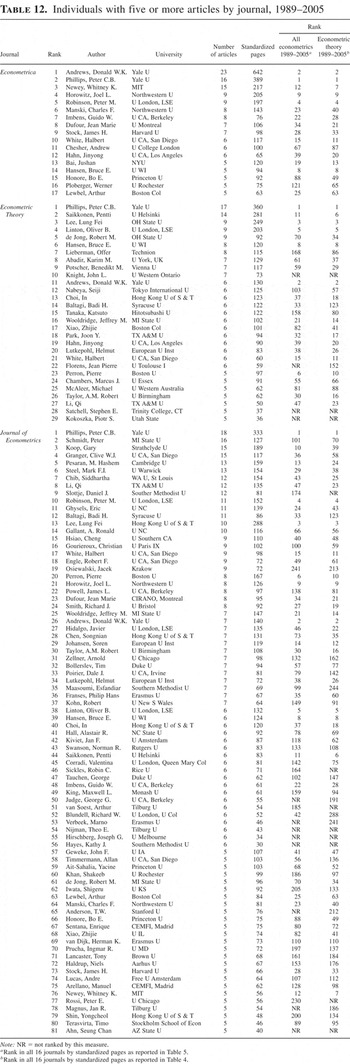
Table 12 lists individuals with five or more econometric articles, by journal, over the period 1989–2005. There were 17 individuals publishing five or more econometrics articles in Econometrica during this period. These 17 individuals were among the top 150 ranked individuals over the period 1989–2005 whether in econometric theory or all econometrics; see Tables 4 and 5. There were 81 individuals publishing five or more articles in JoE. Only 20 of these were not ranked among the top 150 individuals in Table 5. Among the 29 individuals with five or more articles in ET, only 6 were not in the top 150 in Table 5.
Individuals with five or more articles by journal, 1989–2005

7. SENSITIVITY OF THE RANKINGS TO ALTERNATIVE TIME PERIODS
Tables 13a and 13b and 14a and 14b replicate Tables 2 and 3, respectively, but for alternative time periods, namely, 1995–2005 and 2000–2005. Note that Tables 13a and 13b rank only the top 100 institutions as compared to the top 150 institutions in Table 2. For econometric theory rankings, Tables 13a and 13b show that even the top 20 universities are sensitive to the time period change. Although the top 3 universities are the same for the last 11 years of data (1995–2005) as over the whole period of 17 years (1989–2005), this is not the case for the last 6-year period (2000–2005). In fact, the London School of Economics takes over the number 1 slot for econometric theory, followed by Yale and the University of California–San Diego. Notable examples of changes in the econometric theory rankings over time include the University of Carlos III, which ranks 4th in the last 6 years of data (2000–2005) and 6th in the last 11 years of data (1995–2005) as compared to a rank of 13 in Table 2 for the last 17 years of data (1989–2005), and the University of York, which ranks 9th in the last 6 years and 9th in the last 11 years of data as compared to a rank of 20 over the entire sample of 17 years in Table 2. Hong Kong University of Science & Technology ranks 14th in the last 6 years of data (2000–2005) and 8th in the last 11 years of data (1995–2005) as compared to a rank of 15 in Table 2 for the last 17 years of data (1989–2005). Tilburg University shows a drop in the rankings. It is ranked 11 over the entire sample (1989–2005), but it drops to 17 over the last 11 years (1995–2005) and to 61 over the last 6 years (2000–2005). Other examples of the sensitivity of the rankings to the time period considered include the University of Birmingham, Humboldt University, the University of Helsinki, Ewha University, Seoul National University, and the University of Auckland. The University of Auckland was ranked 53 over the period (1989–2005) in Table 2, 41 over the period (1995–2005), and 22 over the period (2000–2005). The University of Birmingham was ranked 50 over the period (1989–2005) in Table 2, 33 over the period (1995–2005), and 16 over the period (2000–2005).
Ranking of institutions by theoretical econometrics publications, 2000–2005

Ranking of institutions by theoretical econometrics publications, 1995–2005

Academic ranking of institutions by all econometrics publications, 2000–2005

Academic ranking of institutions by all econometrics publications, 1995–2005

Similarly, for all contributions to econometrics rankings, Tables 14a and 14b show that the top 20 universities are sensitive to the time period change. Even the top 3 universities change their rankings over the last 6 and 11 years of data. The University of Chicago ranks 1st in all econometrics in the last 6 years of data (2000–2005) and 1st in the last 11 years of data (1995–2005) as compared to a rank of 2nd in Table 3 for the last 17 years of data (1989–2005). Yale ranks 6th in all econometrics in the last 6 years of data (2000–2005) and 2nd in the last 11 years of data (1995–2005) as compared to a rank of 1 in Table 3 for the last 17 years of data (1989–2005). London School of Economics ranks 2nd in all econometrics in the last 6 years of data (2000–2005) and 5th in the last 11 years of data (1995–2005) as compared to a rank of 4th in Table 3 for the last 17 years of data (1989–2005). More dramatic differences in the effect of time periods on the rankings of universities occur as we go further down the tables. Clearly University Carlos III is on the rise, from a ranking of 37 in Table 3 for the entire 17-year period (1989–2005) to 17 for the last 11-year period (1995–2005) and the last 6-year period (2000–2005), whereas Tilburg is on a decline, from a ranking of 20 in Table 3 for the entire 17-year period (1989–2005) to 38 for the last 6-year period (2000–2005).
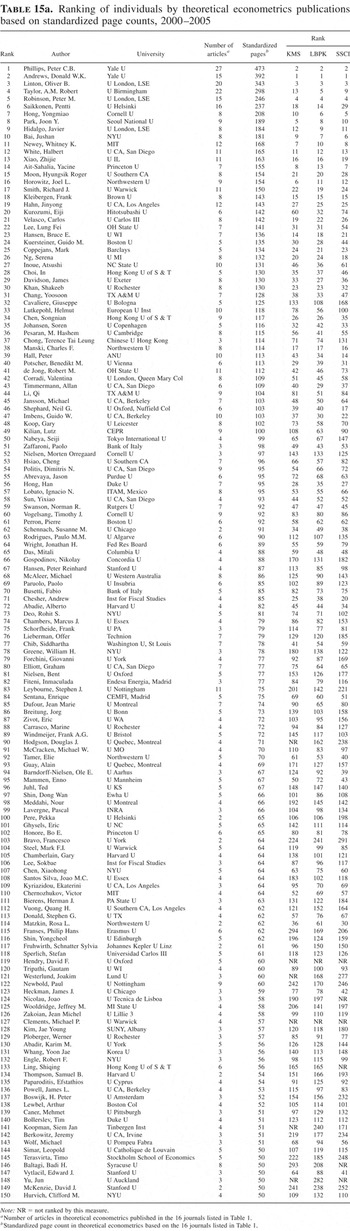
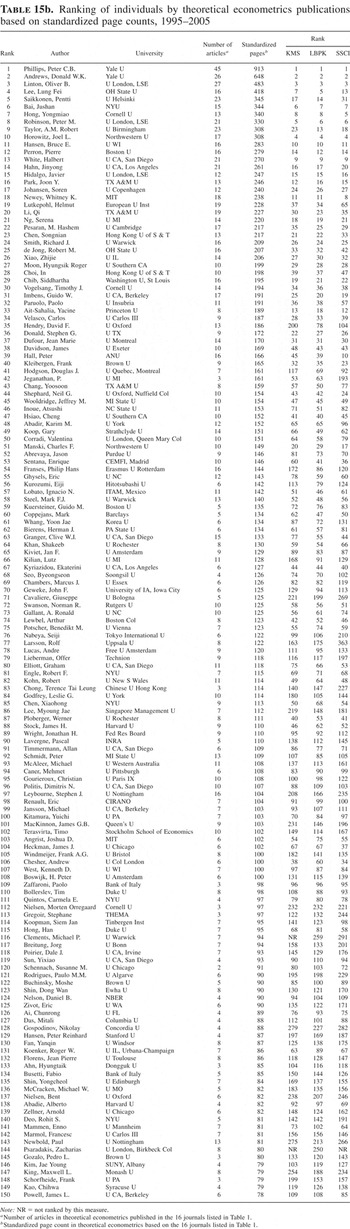
Tables 15a and 15b and 16a and 16b replicate Tables 4 and 5, respectively, but for alternative time periods, namely, 1995–2005 and 2000–2005. For econometric theory rankings, Tables 15a and 15b show that Peter C.B. Phillips and Don Andrews hold the top two positions in theoretical econometrics no matter what time period we consider. However, this is not the case for the rest of the rankings. In fact, Lung-Fei Lee, who ranks 3rd over the entire 17-year period (1989–2005), ranks 22nd over the more recent period (2000–2005). Oliver Linton, who ranks 5th over the entire 17-year period (1989–2005), ranks 3rd in the more recent periods (1995–2005 and 2000–2005). Robert Taylor, who ranks 16th over the entire 17-year period (1989–2005), ranks 4th in the more recent period (2000–2005). Yongmiao Hong, who ranks 15th over the entire 17-year period (1989–2005), ranks 7th in the more recent periods (1995–2005 and 2000–2005). Javier Hidalgo, who ranks 22nd over the entire 17-year period (1989–2005), ranks 9th in the more recent period (2000–2005).
Ranking of individuals by theoretical econometrics publications based on standardized page counts, 2000–2005

Ranking of individuals by theoretical econometrics publications based on standardized page counts, 1995–2005

Ranking of individuals by all econometrics publications, 2000–2005

Ranking of individuals by all econometrics publications based on standardized page counts, 1995–2005

Similarly, for all econometrics rankings, Tables 16a and 16b show that Peter C.B. Phillips and Don Andrews hold the top two positions in all econometrics no matter what time period we consider. However, this is not the case for the rest of the rankings. In fact, Lung-Fei Lee, who ranks 3rd over the entire 17-year period (1989–2005), ranks 32 in the more recent period (2000–2005). Oliver Linton, who ranks 5th over the entire 17-year period (1989–2005), ranks 3rd in the more recent periods (1995–2005 and 2000–2005). Gary Koop, who ranks 10th over the entire 17-year period (1989–2005), ranks 7th in the more recent period (2000–2005). Yongmiao Hong, who ranks 20th over the entire 17-year period (1989–2005), ranks 8th in the more recent period (2000–2005). More dramatic differences in the effect of time periods on the rankings of individuals occur as we go down the tables.
8. CONCENTRATION RATIOS
Table 17 gives the concentration ratios for theoretical and all econometrics for the entire 17-year period (1989–2005) and also the last 11 years of data (1995–2005), and the last 6 years of data (2000–2005). These are based on the percentage of standardized pages of the top 1, 5, 10, etc., using all econometrics publications of the top 150 academic institutions in the 16 journals. These are compared to the concentration ratios reported by Hall (1990) for the period 1980–1988. Note that the latter are based on 14 journals. Comparing 1980–1988 to 1989–2005, the share of the top ranked university rises from 4.5% to 5.2% for econometric theory and falls a little from 3.6% to 3.4% for all econometrics. Looking at the last 11 years of data (1995–2005), the corresponding concentration ratios are 4.2% for econometric theory and 3.5% for all econometrics. For the last 6 years of data (2000–2005), these are 3.8% and 3.4%, respectively. For the top 5 universities, these concentration ratios seem to be decreasing over time, going from 17.9% to 15.7% for econometric theory and 15.6% to 14.5% for all econometrics. The last 5 years of data (2000–2005) show even lower concentration of 14.2% in econometric theory and 13.7% for all econometrics.
Concentration ratios

9. GEOGRAPHICAL FACTORS
Table 18 shows the distribution of standardized pages, number of articles, number of authors, and number of academic institutions in theoretical econometrics by country. Only countries publishing 75 or more Econometrica equivalent standardized pages in theoretical econometrics over these 17 years (1989–2005) were included in this comparison. The United States dominates the rankings, with 31,250 standardized pages corresponding to 1,641 articles published by 851 authors at 182 academic institutions over the period 1989–2005. The United Kingdom is second, with 7,828 standardized pages attributed to 513 articles published by 218 authors at 54 academic institutions. Canada is 3rd, Netherlands is 4th, Australia is 5th, and France is 6th. In Table 2, for the period 1989–2005, we saw that LSE (UK) was ranked 2nd in econometric theory, the University of Montreal (Canada) was ranked 8th, Tilburg University (Netherlands) was ranked 11th, Oxford University (UK) was ranked 12th, University of Carlos III (Spain) was ranked 13th, Hong Kong University of Science & Technology was ranked 15th, and the University of York (UK) was ranked 20th. The remaining 13 of the top 20 in theoretical econometrics were U.S. universities. In Table 13a, for the 6-year period 2000–2005, we saw that LSE (UK) was ranked 1st in econometric theory, the University of Carlos III (Spain) was ranked 4th, the University of York (UK) was ranked 9th, Hong Kong Science and Technology was ranked 14th, Oxford University was ranked 15th, the University of Birmingham was ranked 16th, the University of Helsinki (Finland) was ranked 18th, the University of Amsterdam (Netherlands) was ranked 19th, and Humboldt (Germany) was ranked 20th. The remaining 11 of the top 20 in theoretical econometrics were U.S. universities. Note that the quality adjusted rankings given by KMS, LBPK, and SSCI do not vary much across countries.
Geographical distribution of theoretical econometrics publications, 1989–2005

Table 19 is a similar table for all econometrics publications by country over the period 1989–2005. Only countries publishing more than 85 Econometrica equivalent standardized pages over these 17 years (1989–2005) in all econometrics were included in this table. The United States ranks 1st in all econometrics, with 85,025 standardized pages attributed to 4,916 articles published by 3,240 authors at 328 academic institutions over the period 1989–2005. The United Kingdom ranks 2nd, with 22,669 standardized pages corresponding to 1,482 articles published by 926 authors at 101 academic institutions. Canada is 3rd, the Netherlands is 4th, Australia is 5th, and France is 6th. In Table 3, we saw that LSE (UK) was ranked 4th in all econometrics, Oxford University (UK) was ranked 9th, the University of Montreal (Canada) was ranked 18th, Tilburg (Netherlands) was ranked 20th. The remaining 16 of the top 20 in all econometrics were U.S. universities. In Table 14a, for the 6-year period 2000–2005, we saw that LSE (UK) was ranked second in all econometrics, Oxford University (UK) was ranked 11th, the University of Warwick was ranked 15th, the University of Carlos III (Spain) was ranked 17th, the University of York (UK) was ranked 19th. The remaining 15 of the top 20 in all econometrics were U.S. universities. Note that the quality adjusted rankings given by KMS, LBPK, and SSCI do not vary much across countries.
Geographical distribution of all econometrics publications, 1989–2005

9. CONCLUDING COMMENTS
This paper ranks academic institutions and individuals in econometric theory and all econometrics over a span of 17 years, covering the period 1989–2005. These ranking are based upon standardized page counts in 16 journals. The fact that 12 out of the 16 journals were used by Hall (1990) allows a comparison in rankings among academic institutions from the period 1980–1988 to the period 1989–2005. This covers a span of 26 years of econometrics research. The usual caveats apply. One could question the 16 journals used, or the conversion factors applied even after adjusting them by citation impact factors and size and age of the journal. We have addressed this by using alternative weights used by KMS, LBPK, and SSCI. We have also ranked academic institutions and individuals by the three core econometric journals. We offered another ranking based on a count of the number of articles published in these journals. We have also ranked these academic institutions and individuals over alternative time periods, including 1995–2005 and 2000–2005. Of course, there is a subjective element in classifying econometric theory articles. There are econometricians who publish in statistics journals that were not included in this study, and there are statisticians that were included in this ranking because their research was published in econometric journals or had econometricians as co-authors. The institutions rankings excluded nonacademic institutions such as federal reserve banks, NBER, World Bank, and IMF. However, the individual rankings include researchers affiliated with both academic and nonacademic institutions. Econometricians move from one university to another, and the rankings of these institutions are affected accordingly. Despite these shortcomings, we believe these rankings to be a helpful guide to graduate students, faculty, and academic administrators.