I. INTRODUCTION
Due to the nondestructive nature of hardness testing, it has been widely used to study mechanical properties like Young's modulus and hardness since long. Reference Gouldstone, Chollacoop, Dao, Li, Minor and Shen1–Reference Cai, Li, Liu and Chen5 So far, a wide range of literature is available on the microstructure and macroscopic mechanical behavior of materials based upon indentation testing (hardness test). Among various issues, forward problem and inverse problem are two hot topics for years. As forward problem, a model proposed by Tabor Reference Tabor6 in the 1950s had well explained the relation between hardness and flow stress, i.e., H = kσr, where H is hardness at flow stress corresponding to strain of 8% and constraint coefficient k as a constant equal to 3. Later, Cheng and Cheng has done plenty of works Reference Cheng and Cheng7–Reference Cheng and Cheng9 and gave a relationship between hardness and the basic mechanical properties of solids like Young's modulus, initial yield strength, and work-hardening exponent with certain indenter shape. According to Wei and Hutchinson, Reference Wei and Hutchinson10 indentation measured hardness is a function of the variables like size of the indenter relative to the material length parameters, the strain hardening exponent, the ratio of initial yield stress to Young's modulus, and the geometry of the indenter. Haj-Ali et al. Reference Haj-Ali, Kim, Koh, Saxena and Tummala11 has analyzed the indentation response to nanohardness tests for a variety of materials with nonlinear behavior by adopting artificial neural networks. Recently, Cao et al. Reference Cao, Xue, Chen and Raabe12 had studied the sharp indentation in soft metals and found a simple relation between the nominal hardness and the flow stress. With regard to inverse problems, indentation results are used to extract the elastic–plastic properties of materials. Among the various methods, Dao et al. Reference Dao, Chollacoop, Van Vliet, Venkatesh and Suresh2 proposed an algorithm to derive the material elastic–plastic properties from a representative stress σr = 0.033. Extending Dao's approach, Bucaille et al. Reference Bucaille, Stauss, Felder and Michler13 deduced yield stress and the strain hardening exponent from the values of the representative stress using two or more different indenters. Cao et al. Reference Cao and Lu14,Reference Cao and Huber15 has proposed a different way by using the indentation loads at two different indentation depths to uniquely determine the material yield strength and strain hardening exponent. Ogasawara et al. Reference Ogasawara, Chiba and Chen16,Reference Liu, Ogasawara, Chiba and Chen17 has re-defined the representative strain from equi-biaxial loading and proposed a new indentation stress-state based relation to measure the mechanical properties. Also, size effect (micro/macro) has been a prime focus in indentation testing for years. Different stain gradient theories Reference Fleck and Hutchinson18–Reference Nix and Gao21 were introduced to explain the size effect, where geometrically necessary dislocations were responsible for the increased hardness. Reference Cao and Huber15,Reference Nix and Gao21–Reference Gao and Huang23
For metal matrix composites (MMC), lots of researches have been carried out, Reference Bao, Hutchinson and McMeeking24−Reference Rosenberger, Forlerer and Schvezov30 such as particle size effect and finite element analysis (FEA). For FEA, the geometry model can be structured by representative volume element model, Reference Bao, Hutchinson and McMeeking24 the Voronoi cell method, Reference Ghosh and Moorthy25 real morphology model in 2D, or the serial section technology Reference Ayyar and Chawla26,Reference Chawla and Chawla27 for MMC. In general, material properties in those studies come from macro experiments data and then input into micro model for FEA use. While obtaining material (matrix and particles) properties for these methods, there exists some weakness: (i) the matrix properties from the test on matrix alloy without particles, thereby ignoring the influence from additive particles on matrix properties. (ii) if the material properties of MMC from macro experiment, shortage still existed that it treats the MMC as a uniform material, which departing from the composite property at a studied scale level. In this study, combining indentation experiments with inverse formulation, a new method has been introduced, which can provide much precise material properties for further simulation investigation.
II. EXPERIMENTS AND THEORY
A. Experimental methods
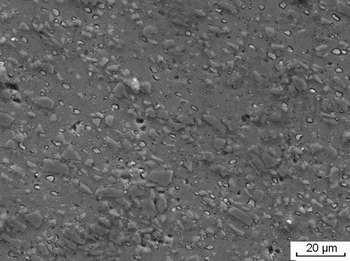
The specimens investigated (aluminum alloy reinforced by 15% SiC particles) were made through a powder metallurgy. The raw aluminum matrix was prepared by atomized powder and then mixed with SiC particles with size range 1–12 μm. Hot extrusion was adopted to develop the composite. Before testing, the specimens were annealed at 673 K for 2 h. The chemical composition of matrix is shown in Table I. Morphology of composite was examined by a TESCAN VEGAⅡ-LMH scanning electron microscope (SEM; Brno, Czech Republic), as illustrated in Fig. 1. Shimadzu Micro-Compression-Tester (MCT) type W501 equipped with a Berkovich diamond indenter was utilized for micro indentation. Indentation investigations were performed at 20 mN load with a loading speed of 2.231 mN/s on different micro structures (particles and matrix). Repeated experiment approaches were opted to gather data with average aim. Especially, matrix was the prime focus to study the micro mechanical behavior in this research.
Chemical composition of matrix in SiC particle reinforced Al matrix composites (wt%).

The SEM metallographic structure of MMC.

B. Theory
1. Analysis of loading–unloading curves
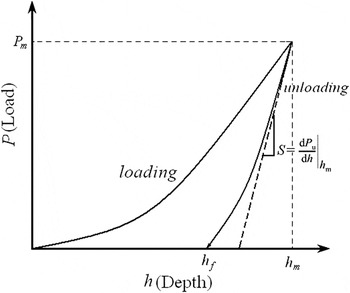
As shown in Fig. 2, it was a sketch of loading–unloading (P–h) curve by indentation experiment. For analysis of these curves, Oliver and Pharr Reference Oliver and Pharr3,Reference Oliver and Pharr4 have proposed their methods based on the Berkovich indenters. For loading curves, it can be presented by Kick's law as:
 $$P = C{h^2}\quad ,$$
where C is loading curvature, which depends on the elastic and plastic material properties, as well as indenter geometry. Similarly, the unloading curve follows a simple power-law relation determined by a least square fitting procedure:
 $$P = B \times {(h - {h_f})^m}\quad .$$
A sketch of P–h curve by an indentation experiment.

The slope of the unloading curve can be obtained as:
 $$S = {\left. {{{{\rm{d}}P} \over {{\rm{d}}h}}} \right|_{h = hm}} = {{2{\rm{\beta }}\sqrt A } \over {\sqrt {\rm{\pi }} }}{E^*}\quad .$$
The contact stiffness S is the initial unloading slope at maximum indentation depth, h m , Reference Dao, Chollacoop, Van Vliet, Venkatesh and Suresh2 which is a function of contact modulus E*, projected contact area A, and a constant β. For a Berkovich indenter, the value of β is between 1.034 and 1.09. Reference Gouldstone, Chollacoop, Dao, Li, Minor and Shen1,Reference Oliver and Pharr4 The projected contact area A is given by Reference Gouldstone, Chollacoop, Dao, Li, Minor and Shen1 :
 $$A = {\rm{\pi }}a_m^2 = {\rm{\pi }}\,{\tan ^2}\,{\rm{\theta }}h_{\rm{c}}^2\quad ,$$
where a m is the contact radius measured at h m , a m = h ctanθ, h c is contact depth, and θ is the included half-angle of the indenter. Reference Gouldstone, Chollacoop, Dao, Li, Minor and Shen1,Reference Dao, Chollacoop, Van Vliet, Venkatesh and Suresh2
Contact depth h c was determined from the unloading curves as:
 $${h_{\rm{c}}} = {h_m} - {\rm{\gamma }}{{{P_m}} \over S}\quad ,$$
where P
m
is the peak load at the onset of unloading, γ is a tip-dependent geometry factor, which is equal to 0.72 for a conical indenter and 0.75 for a Berkovich indenter. The modulus relation between material modulus E, indenter modulus E
i
, and contact modulus E* is:
 ${\textstyle{1 \over {{E^*}}}} = {\textstyle{{(1 - {{\rm{\nu }}^2})} \over E}} + {\textstyle{{(1 - {\rm{\nu }}_i^2)} \over {E{}_i}}}$
. For a given loading–unloading curve, once the unloading slope is obtained, the Young's modulus E and hardness H can be determined from Eqs. (3)–(5) as:
 $$E = (1 - {{\rm{\nu }}^2}){\left( {{1 \over {{E^*}}} - {{1 - {{\rm{\nu }}_i}^2} \over {{E_i}}}} \right)^{ - 1}}\quad ,$$
 $$H = {{{P_{\max }}} \over A}\quad .$$
2. Inverse algorithm for loading–unloading curves
In an early study, Dao et al. Reference Dao, Chollacoop, Van Vliet, Venkatesh and Suresh2 proposed a complete set of explicit analytical method. For soft specimens, the stress–strain relation is assumed to be the following Hookean elastic and power-law plastic formula Reference Gouldstone, Chollacoop, Dao, Li, Minor and Shen1,Reference Dao, Chollacoop, Van Vliet, Venkatesh and Suresh2 :
 $${\rm{\sigma }} = \left\{ {\matrix{ {E\varepsilon } \cr {R\varepsilon ^n } \cr } } \right.\,\,\,\,\,\,\,\,\,\,\matrix{ {{\rm{for}}\,\,\,\,\,\,\,\,\,\,\,\,{\rm{\sigma }} \le {\rm{\sigma }}_y } \cr {{\rm{for}}\,\,\,\,\,\,\,\,\,\,\,\,{\rm{\sigma }} \ge {\rm{\sigma }}_y } \cr } \quad ,$$
where R is the strength coefficient, n is the strain hardening exponent, and σ
y
is the initial yield stress. As known, the total strain composed of yield strain ε
y
and strain
 ${{\rm{\varepsilon '}}_p}$
, which is the total strain beyond yielding, i.e.,
 ${\rm{\varepsilon }} = {{\rm{\varepsilon }}_e} + {{\rm{\varepsilon }}_p} = {{\rm{\varepsilon }}_y} + {{\rm{\varepsilon '}}_p}$
, with zero offset strain, and Eq. (8) can be rewritten as:
 $${\rm{\sigma }} = \left\{ {\matrix{ {E{\rm{\varepsilon }}} \cr {{\rm{\sigma }}_y (1 + {E \over {{\rm{\sigma }}_y }}{\rm{\varepsilon '}}_p )^n } \cr } } \right.\,\,\,\,\,\,\,\,\,\,\,\matrix{ {{\rm{for}}\,\,\,\,\,\,\,\,\,{\rm{\sigma }} \le {\rm{\sigma }}_y } \cr {{\rm{for}}\,\,\,\,\,\,\,\,{\rm{\sigma }} \ge {\rm{\sigma }}_y } \cr } \quad .$$
According to Ref. Reference Dao, Chollacoop, Van Vliet, Venkatesh and Suresh2, the dimensionless functions used to describe the constitutive behavior are:
 $${\Pi _1}\left( {{{{E^*}} \over {{{\rm{\sigma }}_{\rm{r}}}}},n} \right) = {C \over {{{\rm{\sigma }}_{\rm{r}}}}}\quad ,$$
 $${{{\rm{d}}P} \over {{\rm{d}}h}}\left| {_{h = hm}} \right. = {E^*}{h_m}{\Pi _2}\left( {{{{E^*}} \over {{{\rm{\sigma }}_{\rm{r}}}}},n} \right)\quad .$$
Equations (10) and (11) are associated to loading curve and unloading curve, respectively, where C is the loading curvature, and
 ${\textstyle{{{\rm{d}}P} \over {{\rm{d}}h}}}\left| {_{h = hm}} \right. = S$
is the initial unloading slope at h = h
m
(Ref. Reference Dao, Chollacoop, Van Vliet, Venkatesh and Suresh2); and σr is the representative stress at
 ${\varepsilon '_p} = {\varepsilon _{\rm{r}}}$
for the description of loading curvature. When representative strain εr = 0.033,
 ${\Pi _1}$
is independent of hardening exponent n and can be given by
Reference Gouldstone, Chollacoop, Dao, Li, Minor and Shen1,Reference Dao, Chollacoop, Van Vliet, Venkatesh and Suresh2
:
 $${\Pi _1}\left( {{{{E^*}} \over {{{\rm{\sigma }}_{{\rm{0}}{\rm{.033}}}}}}} \right) = {C \over {{{\rm{\sigma }}_{{\rm{0}}{\rm{.033}}}}}} = - 1.131{\left[ {\ln \left( {{{{E^*}} \over {{{\rm{\sigma }}_{0.033}}}}} \right)} \right]^3} + 13.635{\left[ {\ln \left( {{{{E^*}} \over {{{\rm{\sigma }}_{0.033}}}}} \right)} \right]^2} - 30.594\left[ {\ln \left( {{{{E^*}} \over {{{\rm{\sigma }}_{0.033}}}}} \right)} \right] + 29.267\quad . \cr}$$
And
 ${\Pi _2}$
can be rewritten as:
 $$\prod\nolimits_2 {\left( {{{{E^ * }} \over {{\sigma _{\rm{r}}}}},n} \right)} = {S \over {{E^*}{h_m}}} = ( - {\rm{1}}{\rm{.40557}}{n^{\rm{3}}} + {\rm{0}}{\rm{.77526}}{n^{\rm{2}}} + {\rm{ 0}}{\rm{.15830}}n - {\rm{0}}{\rm{.06831}}){\left[ {\ln \left( {{{{E^ * }} \over {{{\rm{\sigma }}_{0.033}}}}} \right)} \right]^3} + ({\rm{17}}{\rm{.93006}}{n^{\rm{3}}} - {\rm{9}}{\rm{.22091}}{n^{\rm{2}}} - {\rm{2}}{\rm{.37733}}n + {\rm{ 0}}{\rm{.86295}}){\left[ {\ln \left( {{{{E^ * }} \over {{{\rm{\sigma }}_{0.033}}}}} \right)} \right]^2} - ({\rm{79}}{\rm{.99715}}{n^{\rm{3}}} + {\rm{ 40}}{\rm{.55620}}{n^{\rm{2}}} + {\rm{ 9}}{\rm{.00157}}n - {\rm{2}}{\rm{.54543}})\left[ {\ln \left( {{{{E^ * }} \over {{{\rm{\sigma }}_{0.033}}}}} \right)} \right] + ({\rm{122}}{\rm{.65069}}{n^{\rm{3}}} - {\rm{63}}{\rm{.88418}}{n^{\rm{2}}} - {\rm{9}}{\rm{.58936}}n + {\rm{6}}{\rm{.20045}})\quad . \cr}$$
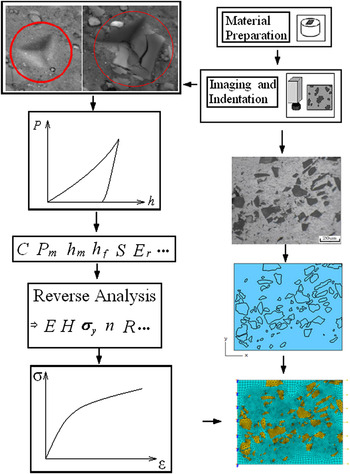
By combining Eq. (12) with Eqs. (13) and (9), the strain hardening exponent, n, and initial yield stress, σ y can be solved. Hence, through indentation experiment, the process of inverse analysis to obtain material properties can be concluded as shown in Fig. 3.
The process of indentation experiment and reverse analysis to obtain material properties using FEA.

III. RESULTS AND DISCUSSION
A. The micro-mechanical properties of different micro structures in MMC
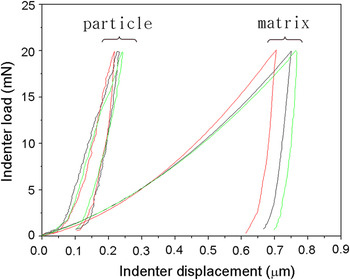
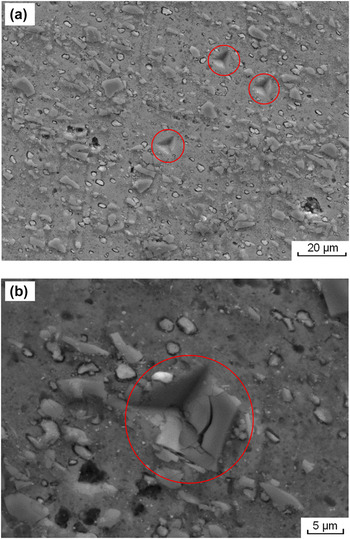
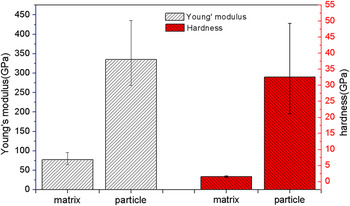
From indenter experiment, one cycle of the loading–unloading (P–h) curve was recorded. For a different portion (particles and matrix) in MMC, several selected curves are shown in Fig. 4. Obviously, the curves for particles and matrix have much difference, especially for the indentation penetration depth under the same load. For particle indentation experiments, the indenter displacements were low, and curves were serrated. In regard to matrix, the indenter displacements were much greater, as three times as that for particles. Different from particles, the curves of matrix indentation were comparatively smoother. After indentation experiments, the SEM metallographic structure is shown in Fig. 5 in detail. In Fig. 5(a), the indentations of matrix are similar to the general material. While in Fig. 5(b), the particle cracked after indentation. This was definitely due to the difference between material properties. For matrix, it was soft and easy to deform. However, SiC particles were hard and brittle with poor plastic deformation properties. With sharp indenter tip, the particle was much easy to damage and failure as shown. Using the method proposed by Oliver and Pharr Reference Oliver and Pharr3,Reference Oliver and Pharr4 in Sec. II. B, the indentation properties, i.e., the Young's modulus E and hardness H of the tested material, were calculated as shown in Fig. 6. For indentation experimental results, the Young's modulus and hardness of these micro structures were different and distributed over a wide range. The average Young's modulus of the matrix and particle was calculated as 76.8 GPa (from 65.1 to 96.2 GPa) and 334.7 GPa (from 268.4 to 435.8 GPa), respectively. With regard to particles, the indentation Young's modulus was less than the theoretical result to some extent. Reference Ghosh and Moorthy25,Reference Rosenberger, Forlerer and Schvezov30,Reference Shen, Williams, Piotrowski, Chawla and Guo31 And for the soft matrix, it was slightly greater than the typical Young's modulus 70 GPa. Reference Rosenberger, Forlerer and Schvezov30,Reference Shen, Williams, Piotrowski, Chawla and Guo31 Similar to Young's modulus, the hardness for particle spread over a wide range from 21.2 to 49.3 GPa, with mean value as 32.56 GPa under the test condition. The hardness for matrix was from 1.28 to 1.78 GPa with the mean value as 1.58 GPa. For the wide range of matrix and particles in MMC, the reason may be due to interaction between them, and individual difference.
Examples of P–h curves of different micro structures in MMC.

The SEM metallographic structure of MMC (a) indentation positions during micro indentation experiments; (b) SiC particle fracture after indentation experiments.

The Young's modulus and hardness for different parts in MMC.

For the inverse problem, using the method proposed by Dao et al., Reference Dao, Chollacoop, Van Vliet, Venkatesh and Suresh2 the loading curvature C was fitted from the loading curve, and contact modulus E* was obtained from the unloading curve from each experiment. From the inverse algorithm [Eq. (12)], the representative stress can be calculated from the obtained parameters C and E*. Then strain hardening exponent was determined as 0.384–0.399 from calculated S, h m , E*, and representative stress from the previous step. Yield stress of matrix in this MMC was finally determined as from 80.70 to 96.11 MPa with average values of strain hardening exponent and initial yield stress as 0.385 and 85.66 MPa.
B. The “second indenter” for particle in MMC
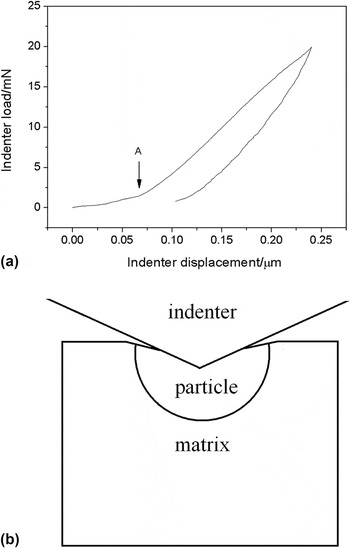
In Fig. 7(a), it was a detailed description of P–h curves for particles. Although, this curve was similar to the general curves, it still has a turning point. As from position “A” marked in this figure, it is clear that the load curve was flat before A. However, after position A, the curve went abrupt. For this phenomenon, it was different from the general metal material, which was smooth transition like standard curves in Kick's law. From the indentation experiments, this discrepancy may relate to the particle as a second indenter to matrix during indentation [see Fig. 7(b)]. At the beginning of indentation on particle, due to the mismatch between matrix and particle, or good deformation properties for matrix, the hard particle moves down with indenter with increasing load, which like an indenter to “push” the soft interface (or matrix), Reference Evans and Boyd32 and the P–h curves mainly captured the indentation property of interfaces or matrix before position A. After “compaction,” the particle was resisted strongly by the hardened interface (or matrix) due to the hardening effect, and then the loading curve will turn abrupt, which shows mainly the properties of the particle.
A detailed description for indentation experiments of the case of particle: (a) typical P–h curves of particle; (b) a sketch of particle as a second indenter to matrix during indentation.

C. Finite element analysis
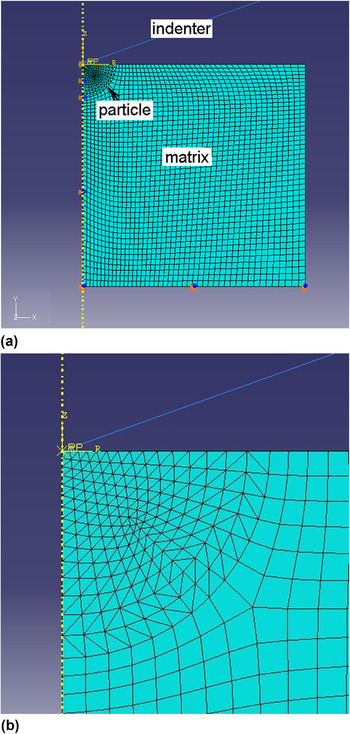
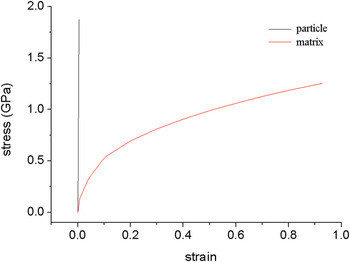
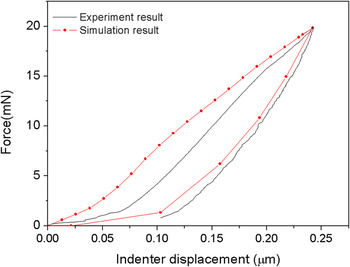
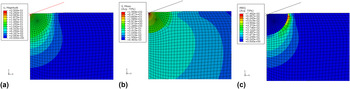
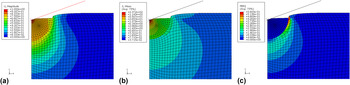
Using the material properties obtained by indentation experiments, the simulation has been carried out. A two-dimensional axisymmetric finite element model was constructed to simulate the indentation process by using the general finite element package ABAQUS/Standard, assuming that other particles in MMC were far from the indenter tip and they have no influence on the indentation properties i.e., one particle under the indenter tip was adopted for simplification. Reference Xia, Qi, Perry and Kim33 As shown in Fig. 8, the indenter was assumed to have a cone shape, and the tip apex angle θ was chosen as 70.3° for Berkovich indenter, Reference Gouldstone, Chollacoop, Dao, Li, Minor and Shen1,Reference Dao, Chollacoop, Van Vliet, Venkatesh and Suresh2,Reference Cheng and Cheng9 without considering the indenter radius effect. The size of the MMC model was 20 × 20 μm, in which the radius of the particle was 3 μm. The particle was designed as 1/4 circle, which was taken perfectly bonded to the matrix. Reference Bao, Hutchinson and McMeeking24 The mesh of the particle was included 400 3-node linear axisymmetric triangle elements (CAX3) and the matrix material element was included 1900 4-node bilinear axisymmetric quadrilateral, reduced integration elements (CAX4R). The frictionless tangential behavior has been applied for the contact between indenter and MMC model. The material properties used for simulation were from the result by indention inverse algorithm as: the aluminum matrix strain hardening exponent n = 0.385, the initial yielding stress was 85.66 MPa and the Young's modulus E = 76.8 GPa, the Young's modulus of SiC particle E = 334.7 GPa. The Poisson ratio of matrix and SiC particle was νm = 0.33 and νSiC = 0.17, Reference Shen, Williams, Piotrowski, Chawla and Guo31 respectively. The stress–strain curves for different parts in MMC were shown in Fig. 9. The boundary condition was that the bottom of the MMC model was fixed, the vertical direction of axsymmetry axis was set free, and the other directions were fixed. The indenter loading displacement was 0.24 μm. After finite element simulation, the load–displacement curves were presented in Fig. 10. From this figure, the curves by simulation and experiment were in good agreement. Also, the turning point A can be detected for the particle as second indenter. Before the turning point, the curve was relatively flat and then becomes abrupt after it. Figure 11 gives a detailed description of the deformation contour during indentation. As shown in Fig. 11, the displacement for particle was uniform, while under particle, the displacement of matrix was the same magnitude as the particle and then decreasing with the increasing distance from the particle. The stress was concentrated under the indenter tip and was greater than particle fracture strength, which will finally cause the particle to fracture. For the equivalent plastic strain (PEEQ), it was mainly distributed in matrix around particles.
The model of micro indentation experiment with particle.

The stress–strain curves for different parts in MMC.

Experimental versus computational indentation curve with indentation depth 0.25 μm on particle.

The deformation contour distribution with indentation depth 0.25 μm on particle: (a) displacement (μm); (b) stress (GPa); (c) PEEQ.

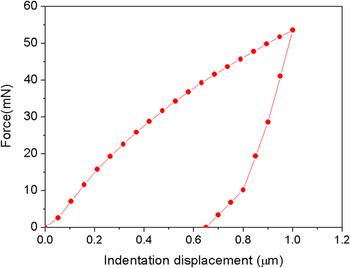
For further investigation, the displacement loading depth was set as 1 μm, and the results are also shown in Figs. 12 and 13. As illustrated in Fig. 12, the P–h curve was similar to Fig. 10; however, the turning point A became indistinct and the second indenter effect was not easy to detect from the P–h curve when the indentation depth is larger. Different from Fig. 11, the displacement distribution shows a big gap between the particle and matrix in Fig. 13 and that the average displacement of particle was about 0.75 μm while the average displacement of place in matrix around particle was about 0.58 μm. The displacement for the particle was not uniform in that the place in contact from indenter was with great displacement, while the place far from indenter was with smaller displacement. Besides, the contour distributions of deformation parameters, stress, and PEEQ were similar to Fig. 11, and the main differences for both were the changes in magnitude. With high-level stress, the particle under indenter would be damaged to fracture, similar to Fig. 5(b).
Computational indentation curve with indentation depth 1 μm on particle.

The deformation contour distribution with indentation depth 1 μm on particle (a) displacement (μm); (b) stress (GPa); (c) PEEQ.

D. Further investigation by FEA
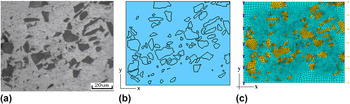
From the obtained material properties by indention inverse algorithm, an example was cited for MMC to demonstrate our proposal. Figure 14 depicts the process of modeling for MMC from original microstructure to meshed model. The average particles size was 1–12 μm as shown in Fig. 14(a). The size of this simulation model was 150 × 120 μm based on micro morphology of this composite. In this model, 75 particles were well banded to matrix. The particles and the matrix were meshed with 3000 3-node linear plane stress triangle elements (CPS3), and 5600 4-node bilinear plane stress quadrilateral, reduced integration elements (CPS4R), respectively. The material properties used for simulation were the same as the previous simulation: the aluminum matrix strain hardening exponent n = 0.385, the initial yielding stress σ y = 85.66 MPa, and the Young's modulus and Poisson ratio of aluminum matrix and SiC particle are E Al = 76.8 GPa, E SiC = 334.7 GPa, νAl = 0.33, and νSiC = 0.17 Reference Shen, Williams, Piotrowski, Chawla and Guo31 respectively. The stress–strain curves for particle and matrix in MMC are shown in Fig. 9. The boundary condition is shown in Fig. 14(c), in that one side was fixed and the other side was loaded with displacement of 10 μm.
The process of modeling for MMC: (a) the original microstructure; (b) the extraction of microstructure from (a); (c) the meshed model.

After simulation, the stress and PEEQ distribution is shown in Fig. 15. The average stress on matrix was about 0.55 GPa, while the average stress on particles was about 1 GPa. Comparatively, the particles were the main parts affording load during deformation. The matrix near sharp particle corners and the places where particles cluster was distributed with higher stress about 0.8 GPa, while the places in matrix with few particles were filled with lower stress around 0.3 GPa. The average equivalent plastic strain (PEEQ) of matrix was about 0.06. Corresponding to the places where great stress concentrated, greater PEEQ was distributed. Additionally, the places in particles with distributed higher level stress, especially particle sharp corners were easy to be damaged with such high-level stress concentration.
A demonstration of deformed results for MMC: (a) stress (GPa) in matrix; (b) stress (GPa) in particle; (c) PEEQ.

For composites or materials with one or more phases, it is no doubt that their mechanical properties at micro scale level are different from those at macro scale. To investigate the micro performance of composite, it deviates from the accurate target if adopting macro material properties in FEA study. Through indentation experiments, the micro properties of their phases can be calculated from inverse algorithm. Then with the inverse material properties at micro scale, the material model can be established according to composite theory, which can reflect a much precise result for further researches.
IV. CONCLUSIONS
In this paper, a modeling method was introduced for particle reinforcement aluminum matrix composite. Using instrumental micro-indentation technique, the micro properties of SiC particles and aluminum matrix were investigated with MCT. The recorded indentation curves for particle were serrated with low indentation depth, while the curves for matrix were comparatively smoother with much great indentation depth. From the method of Oliver and Pharr, the properties of different parts (matrix and particles) in composite, such as Young's modulus and hardness, were obtained. The Young's modulus of matrix and particle were calculated as 76.8 GPa (from 65.1 to 96.2 GPa) and 334.7 GPa (from 268.4 to 435.8 GPa), respectively. Similar to Young's modulus, the hardness for particle spread over a wide range from 21.2 to 49.3 GPa, with the mean value as 32.56 GPa under the test condition. The hardness for matrix was from 1.28 to 1.78 GPa, with the mean value as 1.58 GPa. For the wide range of matrix and particles in MMC, the reason may be due to interaction between them and individual difference. Besides, the material elastic–plastic properties of matrix have been analyzed by using inverse method. The phenomenon of second indenter for particle during indentation has been explained and simulated. Through indentation experiments, the micro properties of different parts in composite can be calculated from inverse algorithm. Then with the inverse material properties at micro scale, the material model can be established according to composite theory, which can reflect a much precise result for further researches.
ACKNOWLEDGMENT
The authors are very grateful for the support received from the Aeronautical Science Foundation of China under Grant No. 2011ZE53059 and National Natural Science Foundation of China (Grant No. 51275414).