


Introduction
Omnibus policies, where programs are bundled together into one piece of legislation, are a common feature of modern democracies (Bar-Siman-Tov Reference Bar-Siman-Tov and Bar-Siman-Tov2021; Fiorina Reference Fiorina1978b; Mayhew Reference Mayhew2005). They are typically used as a way to unite diverse interests (Krutz Reference Krutz and Bar-Siman-Tov2021; Sinclair Reference Sinclair2017). Some include riders, where policies are “hitched” onto a larger bill (Hassell and Kernell, Reference Hassell and Kernell2016; Krutz Reference Krutz2001a). Others are passed by way of logrolling, where legislators trade votes leading to deals, often with aspects of pork-barrel spending (Baron and Ferejohn Reference Baron and Ferejohn1989; Evans Reference Evans1994; Stratmann Reference Stratmann1992). While the reasons for policymakers to engage in policy bundling are extensively studied – for example, avoiding blame (Arnold Reference Arnold1990; Wenzelburger Reference Wenzelburger2011), overcoming coalitional challenges (Krutz Reference Krutz2001b; Sinclair Reference Sinclair2017), and breaking legislative gridlock (Krutz Reference Krutz2000) – we know little about how voters make sense of these complex policies, raising fundamental questions about political preference formation and democratic accountability.
Despite the prominence of omnibus legislation, limited research has explicitly examined public attitudes toward such policies.Footnote 1 Dominant explanations of policy preferences have limited purchase when applied to omnibus legislation. Self-interest-based accounts suggest that individuals assess trade-offs and weigh costs and benefits (e.g., Chong et al. Reference Chong, Citrin and Conley2001; Feldman Reference Feldman1982; Freeder et al. Reference Freeder, Lenz and Turney2019). In the case of omnibus policies, which bundle multiple provisions and programs, such evaluations become considerably more challenging. Similarly, because omnibus policies tend to emerge from cross-party collaboration, they complicate reliance on political cues, challenging explanations rooted in partisanship (e.g., Rathje et al. Reference Rathje, Shariff and Schnall2023; Sears et al. Reference Sears, Hensler and Speer1979, Reference Sears, Lau, Tyler and Allen1980; Slothuus and Bisgaard Reference Slothuus and Bisgaard2021). Omnibus legislation also distributes benefits across diverse groups (making it possible for both liked and disliked groups to simultaneously benefit), which can muddle policy assessments based on fairness, deservingness, or group preferences (e.g., Mettler and Soss Reference Mettler and Soss2004; Nelson and Kinder Reference Nelson and Kinder1996; Piven and Cloward Reference Piven and Cloward2012; Schneider and Ingram Reference Schneider and Ingram1993). In short, omnibus policies confront voters with informational complexities that challenge the viability of conventional explanations of public opinion. How voters reason about such policies with diffuse costs and targeted benefits remains unclear.
We argue that when faced with the challenge of making sense of omnibus policies, people resort to cognitive shortcuts in the form of group heuristics. We introduce the average-person heuristic as a key yardstick for people’s policy evaluation. Overriding the informational complications of omnibus bills, this heuristic reflects whether a policy benefits a large share of the population. It provides a straightforward way to assess complex legislation by capturing broad distributive benefits. While individuals may have varying definitions of the average person, policymakers frequently invoke the average person or voter and in doing so, create a shared social reference group for the public. Rather than parsing through the intricacies of a policy, individuals simply rely on a general sense of whether the average person benefits. By emphasizing perceptions of fairness and inclusivity (through benefits to many), this heuristic allows people to bypass conflicts over self-interest, partisan divides, and targeted group benefits.
In our analysis of the United States Farm Bill, we examine this heuristic in the form of the “average American.” A classic example of omnibus legislation, the Farm Bill is the largest social welfare policy in the United States after Social Security, Medicare, and Medicaid (Hansen Reference Hansen1991; Nestle Reference Nestle2019). It is a highly targeted policy that primarily benefits two groups: low-income households and farmers.Footnote 2 Large majorities of the population support the bill despite only about 12 percent of Americans receiving direct benefits (Babcock Reference Babcock2017; Tomko and Corwine Reference Tomko and Corwine2023). However, the bill’s renewal has occasionally sparked controversy, such as in 2014, when partisan conflict over its size and scope led to political deadlock and a government shutdown (Hamilton Reference Hamilton2014; McCabe Reference McCabe2018). Although the 2018 reauthorization ultimately passed with bipartisan support (Marzen Reference Marzen2018), the bill’s post-2023 renewal efforts have exposed growing partisan divisions over nutrition assistance, agricultural subsidies, and climate-related spending (Keeney et al. Reference Keeney, Widmar and Berenda2025; Qiu Reference Qiu2026). Leveraging the Farm Bill’s diverse beneficiary groups and its varying levels of public salience, we assess the role of the “average American” in shaping public opinion relative to other group heuristics, such as benefits to the poor and farmers.
We test our theoretical proposition using multiple waves of public opinion data. Our findings consistently show that support for the Farm Bill is strongly associated with whether respondents believe the “average American” benefits from its programs. Additional model specifications corroborate this core finding. When accounting for alternative explanations, the “average American” demonstrates explanatory value that goes beyond narrow self-interest and racial bias.
We introduce the average-person heuristic as a group-based shortcut that individuals use to evaluate complex omnibus policies and argue that bundled legislation presents unique challenges for voters, requiring alternative decision-making strategies. The average-person heuristic simplifies policy assessments by focusing on broad social benefits, bypassing conflicts over equity and equality while aligning with democratic norms of majority rule (McClosky and Zaller Reference McClosky and Zaller2013). As a fast and frugal heuristic (Gigerenzer et al. Reference Gigerenzer, Czerlinski, Martignon, Shanteau, Mellers and Schum1999; Martignon and Hoffrage Reference Martignon, Hoffrage, Gigerenzer, Hertwig and Pachur2011), it mirrors judgments about whether most people benefit, similar to appeals that democracy and political institutions work for the “common man” or average voter rather than specific groups (Dewey, Reference Dewey1927; Friedrich Reference Friedrich1940; Gilens and Page Reference Gilens and Page2014). We do not aim to explain how legislators construct or sustain omnibus coalitions but rather examine how the public evaluates policies whose (re)distributive consequences are difficult to observe. This perspective enhances our understanding of public opinion by showing that policy preferences arise not only from self-interest, target group preferences, or partisan affiliation but also from individuals’ recognition of broad social benefits and their judgments about whether most people benefit.
The farm bill and target groups
The origins of the modern Farm Bill can be traced back to agricultural crises at the beginning of the 20th century, the New Deal of the 1930s, and the Great Society of the 1960s (Saloutos Reference Saloutos1974). Early versions of the Farm Bill were created as a social safety net for farmers, farming families, and farming communities in the wake of economic depression (Bowers et al., Reference Bowers, Rasmussen and Baker1984; Rasmussen et al. Reference Rasmussen, Baker and Ward1976). In the 1930s, food stamps, an in-kind transfer for purchasing food, were originally designed as a temporary response during the depression but also aimed to encourage domestic consumption (Bosso Reference Bosso2023). By the 1960s, the Farm Bill was promoted by a coalition of rural and urban congressional members that mutually supported food stamps and agricultural supports (Ferejohn Reference Ferejohn, Wright, Rieselbach and Dodd1986).
The 1973 Farm Bill constituted a committee-based logroll, where programs supporting agriculture and low-income food assistance were incorporated into the same authorization bill (Hansen Reference Hansen1991; McCabe Reference McCabe2018). Food stamps became a permanent policy piece in the Farm Bill as a hallmark of the Great Society social welfare policies, seeking to alleviate the burdens of poverty (Levitan and Taggart Reference Levitan and Taggart1976). Until 2014, both policies would depend on one another for congressional approval as a tactic to harmonize the interests of rural and urban congressional districts to ensure enough votes for passage (Graddy-Lovelace et al. Reference Graddy-Lovelace, Diamond and Ichikawa2020).
Passage in 2014 was stalled due to political gridlock about the role of government and public spending (Hamilton Reference Hamilton2014), leading to negotiations about the omnibus relationship between its two key policies (Bosso Reference Bosso2017). The amount of spending on nutritional assistance was of particular concern, chiefly by the Republican-controlled Congress. For the first time since 1973, the House departed from the long-standing legislative bargain by advancing a proposal that separated food assistance from agricultural support programs (Weisman and Nixon Reference Weisman and Nixon2013). Legislators from both sides, as well as the farm lobby, adamantly disagreed with the division of food subsidies from farm subsidies (Hamilton Reference Hamilton2014). Farming advocates pressured lawmakers to pass the omnibus bill, noting that without passage, farm programs would revert to laws designed in 1949, driving up the price for basic commodities like milk and bread (Nixon Reference Nixon2014a, Reference Nixon2014b).
During congressional debates in 2014, multiple versions of the bill were put forth. For the first time since it was logrolled, Republicans sought to remove food stamps for low-income households from the farm support programs. In the meantime, the policy remained unpassed, leaving subsidy programs in limbo. The final compromise came about through moves toward crop insurance for agricultural producers and a decreased budget for food assistance for low-income households (Hamilton Reference Hamilton2014). What ultimately passed in Congress was an altered version of the Farm Bill, which repealed direct and counter-cyclical payments to farmers, but increased spending on crop insurance. Although it remains the largest spending component of the bill, with over 70% of all funding allocated to food subsidies, the 2014 version also decreased funding for the SNAP (Supplemental Nutrition Assistance) program by approximately 8 billion dollars between 2014 and 2023 (Nixon Reference Nixon2014c). Following passage of the 2014 Farm Bill, congressional debates over reauthorization have become increasingly shaped by partisan conflict. The 2018 Farm Bill expired in 2023, but has since been extended on a one-year basis due to disputes over funding for nutrition programs (Congressional Research Services 2026; Winter Reference Winter2024).
Two groups are of particular importance to the Farm Bill: farmers and the low-income. Since initial passage of the bill, political symbolism surrounding the family farm has shaped political rhetoric for agricultural policies (Appleby Reference Appleby1982; Browne et al. Reference Browne, Skees, Swanson, Thompson and Unnevehr1992; Clapp and Fuchs Reference Clapp and Fuchs2009; Dixon and Hapke Reference Dixon and Hapke2003; Vogeler Reference Vogeler1981). However, nowadays, corporate farming operations largely benefit from subsidies (McFadden and Hoppe Reference McFadden and Hoppe2017). The other main group of Farm Bill beneficiaries is low-income households, those who qualify for or receive food (stamp) assistance through the SNAP program (Hamilton Reference Hamilton2014; Lobao et al. Reference Lobao, Meyer and Harper2004). Today, the largest share of Farm Bill spending is allocated to nutrition assistance to low-income families. Low-income households and farmers should thus serve as key group heuristics if the public knows that these groups benefit and also believe they should benefit.
The Farm Bill is frequently referenced as one of the classic examples of logrolling, linking geographically and economically distinct interests. It encompasses programs that support different crops in different regions and ties rural agricultural subsidies to urban nutrition assistance (Coppess Reference Coppess2018; McCabe Reference McCabe2018; Monke and Stubbs Reference Monke and Stubbs2024; Stratmann Reference Stratmann1992). While the Farm Bill originated in the 1920s and certainly reflects legacy aspects of the original legislation, many modern policies have similar structural features to it. For example, the Inflation Reduction Act (2022) combined tax credits, healthcare provisions, and climate subsidies and the One Big Beautiful Bill (2025) brought together tax reform, spending and welfare reductions, funding for agriculture, and altered student loans, among other changes. Like the Farm Bill, these newer pieces of legislation package policies to provide benefits to various constituencies. While the legislative processes required for passage differ (e.g., often through budget reconciliation), they all constitute forms of omnibus legislation (Borwegen and Mehrotra Reference Borwegen and Mehrotra2026; Quinn and Stokes Reference Quinn and Stokes2026). Because the public is often asked to evaluate such legislation, how voters determine support for omnibus bills remains an important and understudied question.
The average-person heuristic
Classic self-interest models predict that individuals will support policies from which they are net beneficiaries and oppose those for which they are net payees (Campbell et al. Reference Campbell, Converse, Miller and Stokes1960; La Palombara, Reference La Palombara1966; Nie and Andersen Reference Nie and Andersen1974). A parallel literature emphasizes sociotropic reasoning, where citizens judge policies by their broader economic or national consequences (Fiorina Reference Fiorina1978a; Kinder and Kiewiet Reference Kinder and Kiewiet1981; Lewin Reference Lewin1991). While often presented as competing explanations, these two logics are not mutually exclusive. We contend that they may be especially difficult to disentangle in the context of omnibus legislation. Such policies frequently combine redistributive mechanisms (with clearly defined payees and beneficiaries) and social insurance programs (with diffuse beneficiaries across the population). This mixing can obscure “who benefits and pays,” foster misperceptions about policy incidence, and produce dynamics akin to “fiscal illusions” (Golden and Min Reference Golden and Min2013; Wagner Reference Wagner1976). In this context, self-interest and sociotropic reasoning are likely to intertwine, since personal well-being is closely tied to the welfare of families, communities, and fellow citizens (Kiewiet and Lewis-Beck Reference Kiewiet and Lewis-Beck2011).
Because few citizens possess either the political information or the time to calculate complex costs and benefits of omnibus legislation, it becomes likely that they rely on heuristics to guide their evaluations (Lupia Reference Lupia1994, Reference Lupia2017). Heuristics serve as informational shortcuts that reduce complexity and simplify decision-making (Colombo and Steenbergen Reference Colombo, Steenbergen and Hannah2020; Gigerenzer and Goldstein Reference Gigerenzer, Goldstein, Gigerenzer, Hertwig and Pachur2011; Kahneman et al. Reference Kahneman, Slovic and Tversky1982). Among the most influential are group-based heuristics, which provide a socially grounded reference point for evaluation (Jackman and Jackman Reference Jackman and Jackman1973; Mutz and Mondak Reference Mutz and Mondak1997; Wilson Reference Wilson2012). By considering how a relevant social group is affected, individuals can assess policies through the lens of group identification or preference, where they are more likely to support policies if they perceive that groups they identify with or value stand to benefit (Brady and Sniderman Reference Brady and Sniderman1985; Hall et al. Reference Hall, Varca and Fisher1986). In this way, group-based evaluations bridge the individualistic logic of self-interest and the more diffuse sociotropic reasoning. They provide a middle ground by allowing individuals to affirm their own material interest while also aligning with collective or societal outcomes (Conover Reference Conover1985, Reference Conover1988; Mutz and Mondak Reference Mutz and Mondak1997 Reference Mutz and Mondak).
We propose that the average-person functions as one such heuristic. Unlike narrow appeals to specific groups, this concept may signal self-reference (“people like me”) and collective fairness (“most people”). Evaluating a policy in terms of its impact on average people (specific to the US context, the “average American”) provides a simple proxy. This should be particularly useful when confronting complex, omnibus legislation that lacks clear partisan signals and has diffuse benefits. Unlike self-interest, which reflects narrow personal gain, or sociotropic reasoning, which reflects aggregate economic gains, this group-based heuristic invokes a social reference point that allows people to make political judgments when these cues (personal and aggregate) are less clear. It captures a prototypical segment of the population that allows individuals to infer policy effects based on relative outcomes for this group. The intuition is straightforward: If individuals believe a policy benefits the “average American,” they will be more likely to support it; if they believe it harms the “average American,” they will be less likely to support it. In this respect, it is analogous to sociotropic voting.
The concept of the “average American” has deep cultural and political roots. Emerging from the statistical quantification of the population in the early twentieth century (Igo Reference Igo2007), it came to symbolize ordinary people in contrast to elites (Kelly Reference Kelly, Kaltwasser, Taggart, Espejo and Ostiguy2017). Especially during the 1930s, it became an important cultural concept as the nation sought to find and create a common way of life among diverse people (Susman Reference Susman2009). Today, politicians across the ideological spectrum routinely invoke it to justify policy decisions, framing policies as responsive to the “average American” (Greenberg Reference Greenberg1995).Footnote 3 For instance, in signing the 2014 Farm Bill, President Barack Obama emphasized income stagnation of the “average American” as a justification for the legislation (Office of the Press Secretary 2014). Such elite discourse is critical for shaping the importance of groups as useful heuristics (Druckman et al. Reference Druckman, Kuklinski and Sigelman2009; Sniderman et al. Reference Sniderman, Brody and Tetlock1991), making the “average American” a plausible and politically salient reference group.
Its resonance also rests on self-placement. Most Americans perceive themselves as close to average, a biased sentiment reinforced by widespread middle-class identification (Cansunar Reference Cansunar2021; Evans and Kelley Reference Evans and Kelley2004; Jackson and Payne Reference Jackson and Payne2021). This makes the “average American” a particularly resonant and flexible group or category. At the same time, this group-based heuristic draws boundaries between people. Historically, it has been associated with white, middle-class identities, meaning that while it appears universal, it can also reinforce exclusionary judgments about who truly counts as average and deserves government support (Dawkins and Hanson Reference Dawkins and Hanson2024; Igo Reference Igo2007).
What does the average-person heuristic mean for people’s thinking about policies? The heuristic is not meant to capture a statistically average individual, but rather a socially meaningful reference group through which voters interpret policy consequences and distributional outcomes. Like class-based appeals, such as the “middle-class” or “working class,” it serves as a form of group identification but lacks a precise definition (Elenbaas et al. Reference Elenbaas, McGuire, Ackerman, Kneeskern, Kinnard, Farooq, Law, Makanju, Ebert and Mistry2025; Hout Reference Hout2008; Stearns Reference Stearns1979). Rather, it qualifies along the lines of a “superordinate identity,” whereby people are recategorized as belonging to a more inclusive group which eclipses subgroup boundaries (Gaertner and Dovidio Reference Gaertner and Dovidio2000). Belonging to a superordinate group, especially among people with a lower social status, “provides a thriving positive social identity to replace the poorly regarded subgroup identity” (Hornsey and Hogg Reference Hornsey and Hogg2000, 152). Notably, it can foster intergroup solidarity once it becomes salient among people (Campbell-Bethancourt et al. Reference Campbell-Bethancourt, Bilgili, Blommaert and Lubbers2025). Identification with a higher-level group, such as “American,” is present among both majority and minority groups, without reducing the latter’s subgroup identification (Huo Reference Huo2003), and correlates weakly with individualist values, suggesting greater orientation toward collective outcomes (Schwartz et al. Reference Schwartz, Park, Huynh, Zamboanga, Umaña-Taylor, Lee, Rodriguez, Kim, Whitbourne, Castillo, Weisskirch, Vazsonyi, Williams and Agocha2012).
We contend that the average-person heuristic is rooted in such superordinate group-based identification, imagined as representative of ordinary people. It contextualizes average effects of a policy, within the national economy, based on how people perceive its effects on this group (Dausgaard Reference Dausgaard2026; Mutz and Mondak Reference Mutz and Mondak1997b). Such appeals help resolve tension in conventional models of sociotropic preferences, which often overlook the role of group identities (Bornschier et al. Reference Bornschier, Häusermann, Zollinger and Colombo2021; Donnelly Reference Donnelly2021), and therefore understate the importance of distributional conflicts. In this sense, the “average American” remains in line with sociotropic considerations but operates through group-centered reasoning rather than purely national economic considerations. As such, it does not contradict sociotropic arguments but rather complements them by way of adding this group-based perspective. Ample studies have contrasted and dichotomized egotropic and sociotropic factors – often making assumptions that people think about policies in either one of these terms at a time. We argue that people often rely on simpler ways of thinking about complicated public policies; if people hear from political elites how policies benefit the “average American,” it is then plausible that people also rely on this cognitive shortcut as a way to understand distributional outcomes.
Thus, we propose that the “average American” functions as a heuristic through two overlapping mechanisms. First, it cues self-interest because many individuals perceive themselves as “close to average.” They likely interpret this category as representing “people like me,” and thus capturing their own material interests. Second, it functions as a sociotropic heuristic of a group with symbolic power in American politics, like the “middle-class” or “working class.” Even when people do not identify as average, this category can also be shorthand for majority fairness and collective well-being. A policy that benefits the average person signals broad social gains in welfare.
Importantly, the average-person heuristic should matter for omnibus policy because it operates as a cognitive shortcut for evaluating complex, multidimensional policy. Omnibus bills, whether enacted by budget reconciliation or other procedures, bundle multiple policy components into a single package that voters evaluate. As a result, individuals are unlikely to form opinions by independently assessing each provision but rather rely on higher-level interpretations of who benefits. By anchoring judgments in the average-person heuristic, citizens navigate such redistributive complexity without needing detailed policy knowledge. Its explanatory potential lies in its simplicity: It functions as a symbolic representation of majority benefits, bridging personal and collective concerns, while remaining politically resonant. Even in political science, the term “average American” has been employed to reference “median voters” (Gilens and Page Reference Gilens and Page2014) or “nonaffluent Americans” (Gilens and Thal Reference Gilens and Thal2018). Yet, despite its centrality in political discourse and American culture, the “average American” as a group-based, average-person heuristic has not been systematically theorized or empirically tested as a relevant group shaping policy preferences.
Data and methods
Our empirical analysis draws on two Cooperative Election Survey (CES) modules: a 2014 survey (N = 1,524) conducted during heated congressional debates over the Farm Bill and a 2022 survey (N = 1,000) fielded a year before bill renewal. These periods capture contrasting levels of political salience. In 2014, partisan conflict over the bill contributed to a federal government shutdown (higher salience) and in 2022, the bill was not yet on the congressional agenda (lower salience).Footnote 4 As a legacy logroll, the Farm Bill offers a unique case to test voter reasoning because it bundles distinctive beneficiaries, obscures individual-level costs, and offers a case of legislative ambiguity that allows for testing how “who benefits” shapes support.
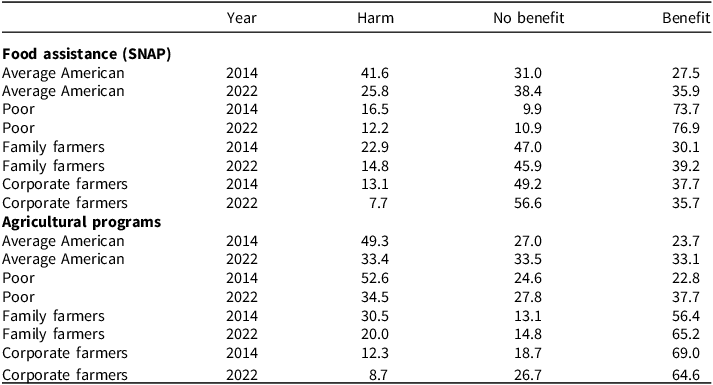
We first measure perceptions of group-based benefit or harm by asking: “For each of the following policies we’d like to know who you think benefits and who is harmed?” We explain agricultural policies as “Price supports to farmers for corn, wheat, sugar, milk, and other commodities (to receive a minimum price for their products)” and food assistance as “Food Stamps (nutrition assistance for low-income households).” Groups include: the “average American,” poor people, rich people, corporate farmers, family farmers, business (general), and food and beverage companies. In the analysis, we focus on the “average American” and main target groups from the Farm Bill (poor, corporate farmers, and family farmers). Responses range from harm (=−1), to no effect (=0), to benefit (=1). Using these two measures, we construct an index of perceptions by averaging respondents’ evaluations of the effects of agricultural and food subsidies on the “average American.” Table 1 displays the percent who believe groups benefit, are unaffected, or harmed by food assistance and agricultural policies. We also recode these measures to capture beliefs that groups benefit or are unaffected (=1) compared to harmed (=0), with results shown in Appendix B.
Percent of respondents who believe food assistance and agricultural policies benefit, do not effect, or harm target groups

Table 1. Long description
The table presents data on the perceptions of harm, no benefit, and benefit from food assistance and agricultural programs across different groups and years. It has 12 rows and 4 columns. The columns are labeled Year, Harm, No benefit, and Benefit. The rows are categorized into Food assistance (S N A P) and Agricultural programs, with subcategories for Average American, Poor, Family farmers, and Corporate farmers, each with data for the years 2014 and 2022. Row 1: Food assistance (S N A P), Average American, 2014, Harm, 41.6; No benefit, 31.0; Benefit, 27.5. Row 2: Food assistance (S N A P), Average American, 2022, Harm, 25.8; No benefit, 38.4; Benefit, 35.9. Row 3: Food assistance (S N A P), Poor, 2014, Harm, 16.5; No benefit, 9.9; Benefit, 73.7. Row 4: Food assistance (S N A P), Poor, 2022, Harm, 12.2; No benefit, 10.9; Benefit, 76.9. Row 5: Food assistance (S N A P), Family farmers, 2014, Harm, 22.9; No benefit, 47.0; Benefit, 30.1. Row 6: Food assistance (S N A P), Family farmers, 2022, Harm, 14.8; No benefit, 45.9; Benefit, 39.2. Row 7: Food assistance (S N A P), Corporate farmers, 2014, Harm, 13.1; No benefit, 49.2; Benefit, 37.7. Row 8: Food assistance (S N A P), Corporate farmers, 2022, Harm, 7.7; No benefit, 56.6; Benefit, 35.7. Row 9: Agricultural programs, Average American, 2014, Harm, 49.3; No benefit, 27.0; Benefit, 23.7. Row 10: Agricultural programs, Average American, 2022, Harm, 33.4; No benefit, 33.5; Benefit, 33.1. Row 11: Agricultural programs, Poor, 2014, Harm, 52.6; No benefit, 24.6; Benefit, 22.8. Row 12: Agricultural programs, Poor, 2022, Harm, 34.5; No benefit, 27.8; Benefit, 37.7. Row 13: Agricultural programs, Family farmers, 2014, Harm, 30.5; No benefit, 13.1; Benefit, 56.4. Row 14: Agricultural programs, Family farmers, 2022, Harm, 20.0; No benefit, 14.8; Benefit, 65.2. Row 15: Agricultural programs, Corporate farmers, 2014, Harm, 12.3; No benefit, 18.7; Benefit, 69.0. Row 16: Agricultural programs, Corporate farmers, 2022, Harm, 8.7; No benefit, 26.7; Benefit, 64.6.
N (2014) = 1453, N (2022) = 825.
Descriptive statistics on perceptions about who benefits reveal that the American public understands the broad contours of the Farm Bill. In both 2014 and 2022, a majority of people believe that family farms and corporate farms benefited from the agricultural commodity programs. In 2014, 69% of respondents believed that corporate farms benefit from agricultural commodity programs, while 58% believed that family farms benefited. Results are nearly the same in the 2022 survey. We also find that people understand who benefits from the supplemental food assistance program. In 2014, 74% of respondents and in 2022, 77% reported that low-income households benefit from this policy. These descriptives suggest that public opinion about the Farm Bill is not a matter of confusion or lack of understanding of who benefits.
Between 2014 and 2022, perceptions that the Farm Bill benefits the “average American” grew. For food assistance, the share who believed that this policy benefits the “average American” increased from 28% to 36%, while the share reporting that it causes harm declined from around 42% to 26%. Perceptions of agricultural programs shifted even more dramatically. The share of respondents who believed that the “average American” benefits from agricultural policy in the bill rose from 24% to 33%, accompanied by a decline in the share who reported they cause harm from around 49% to 33%.
To measure policy support (our dependent variables), respondents were informed: “Every five years, the United States Congress passes the “Farm Bill,” a piece of legislation that covers agricultural and food programs. Without reauthorization, two major programs in the Farm Bill expire: (1) Price supports for crops such as corn, wheat and sugar to guarantee that farmers receive a minimum price for their products, and (2) Food stamps (SNAP) for low-income households to help them pay for groceries.”Footnote 5 They were then asked about their support of the following bill versions: (1) renew the food stamps program and renew the price supports program, (2) renew price supports, but end food stamps, (3) renew food stamps, but end price supports, and (4) end food stamps and end price supports. Policy support is a dichotomous variable (0 = oppose and 1 = support). All four versions of the Farm Bill in our survey were proposed in the 2014 congressional debate.Footnote 6 Table 2 displays average support for each version of the bill.
Percent of public support for farm bill versions

Table 2. Long description
A table comparing public support for different farm bill versions in 2014 and 2022. The table has four rows and three columns. The columns are labeled ‘Legislative versions’, ‘2014 Mean’, ‘2022 Mean’, and ‘Difference 2022–2014’. The rows are labeled with different legislative versions: 1) Renew both (package), 2) Renew food assistance, 3) Renew price supports, and 4) Eliminate both. Each row shows the mean support percentages for 2014 and 2022, along with the difference between these years. Row 1: Renew both (package), 2014 Mean 0.58, 2022 Mean 0.79, Difference 0.21. Row 2: Renew food assistance, 2014 Mean 0.38, 2022 Mean 0.29, Difference -0.09. Row 3: Renew price supports, 2014 Mean 0.28, 2022 Mean 0.22, Difference -0.06. Row 4: Eliminate both, 2014 Mean 0.27, 2022 Mean 0.16, Difference -0.11.
A simple cross-tabulation suggests that the “average American” is important in understanding public support for omnibus legislation (Appendix Table A.1, Panel A). In 2014, only 33 percent of individuals who believed that agricultural price supports benefit both the “average American” and family farmers support a Farm Bill that would only renew funding for agricultural price supports. In contrast, 73 percent of individuals who believe that agricultural price supports benefit both the “average American” and family farmers support a farm bill deal that equally renews funding for both agricultural price supports and food assistance. Similarly in 2014, 80 percent of individuals who believe that both the “average American” and low-income benefit from food assistance, support renewal for both policies. Nearly the same pattern holds in 2022, but with stronger degrees of support.Footnote 7 There is a stable pattern in which people who see poor people, family farmers, and the “average American” as beneficiaries of the Farm Bill programs want to see Congress renew the legislation as an omnibus bill. While these patterns suggest the “average American” also matters, they cannot reliably distinguish perceived benefits from other factors that might account for support for the Farm Bill.
Next, we estimate a series of unweighted linear regression models with state fixed effects and robust standard errors. Because the dependent variables are binary (0 = oppose and 1 = support), we have also estimated all models as logit models and average marginal effects. We find that coefficients remain the same with only very slight differences in standard errors in the linear regression models. For ease of interpretation, we present our findings from the linear regression models.
We control for individual-level measures of demographics and political orientation, including party identification (republican and democrat), ideology (very liberal = 1, very conservative = 5), family income (a 12-point categorical variable), education (a 6-point categorical variable), race (non-white = 1), gender (female = 1), age, and importance of religion (a 4-point categorical variable). Such control variables account for well-established predictors of both policy attitudes and political preferences. We measure food assistance eligibility (not uptake) based on self-reported income from the surveys (low-income = 1). Individuals with lower incomes or eligibility for assistance may simultaneously be more likely to perceive personal or group-level benefits and support the policy. We also control for the rurality of respondents’ counties by including the USDA Urban-Rural Continuum, a nine-category classification system. Inclusion of this variable controls for spatial heterogeneity in terms of exposure to the Farm Bill (i.e., rural residents may be more aware and supportive). The inclusion of these key demographic and political characteristics reduces concerns that estimates are driven by observable differences in sample composition. For descriptive statistics of control variables, see Table A.1, Panel B in the Appendix.
The literature on the Farm Bill conjectures that support for the legislation mainly derives from direct benefits that communities receive (Hansen Reference Hansen1991). To measure local benefits from food stamps assistance and agricultural subsidies, we use the latest data available for each respective survey as lagged values of food stamp participation rates at the county and at the congressional district-level from the US Census Bureau’s American Community Survey (Manson et al. Reference Manson, Schroeder, Van Riper, Kugler and Ruggles2022) and farm subsidy data as average government payment per farm from the 2012 and 2017 USDA Census of Agriculture (USDA 2019). These measures are the only indicators available during both census years that would capture local benefits from agricultural policies. Figure A.1 in the Appendix maps the geography of agricultural policy benefits and Figure A.2 the supplemental food assistance participation rates across counties.
Results
In the following models, we explore the explanatory power of the average-person heuristic. We first focus our analysis on the bill version that renews both policies as an omnibus package (food stamps and agricultural programs) and the version that eliminates both. We first estimate a model of policy support including beliefs that the “average American” benefits (labeled “Benefit Average American”) without any controls apart from survey year. This baseline model (full results in Table A.3) indicates that the perception of benefits to the “average American” is strongly associated with policy support for the omnibus bill in expected directions: Respondents who believe the policy benefits the “average American” are significantly more likely to support renewing the Farm Bill policy package and less likely to support eliminating it.
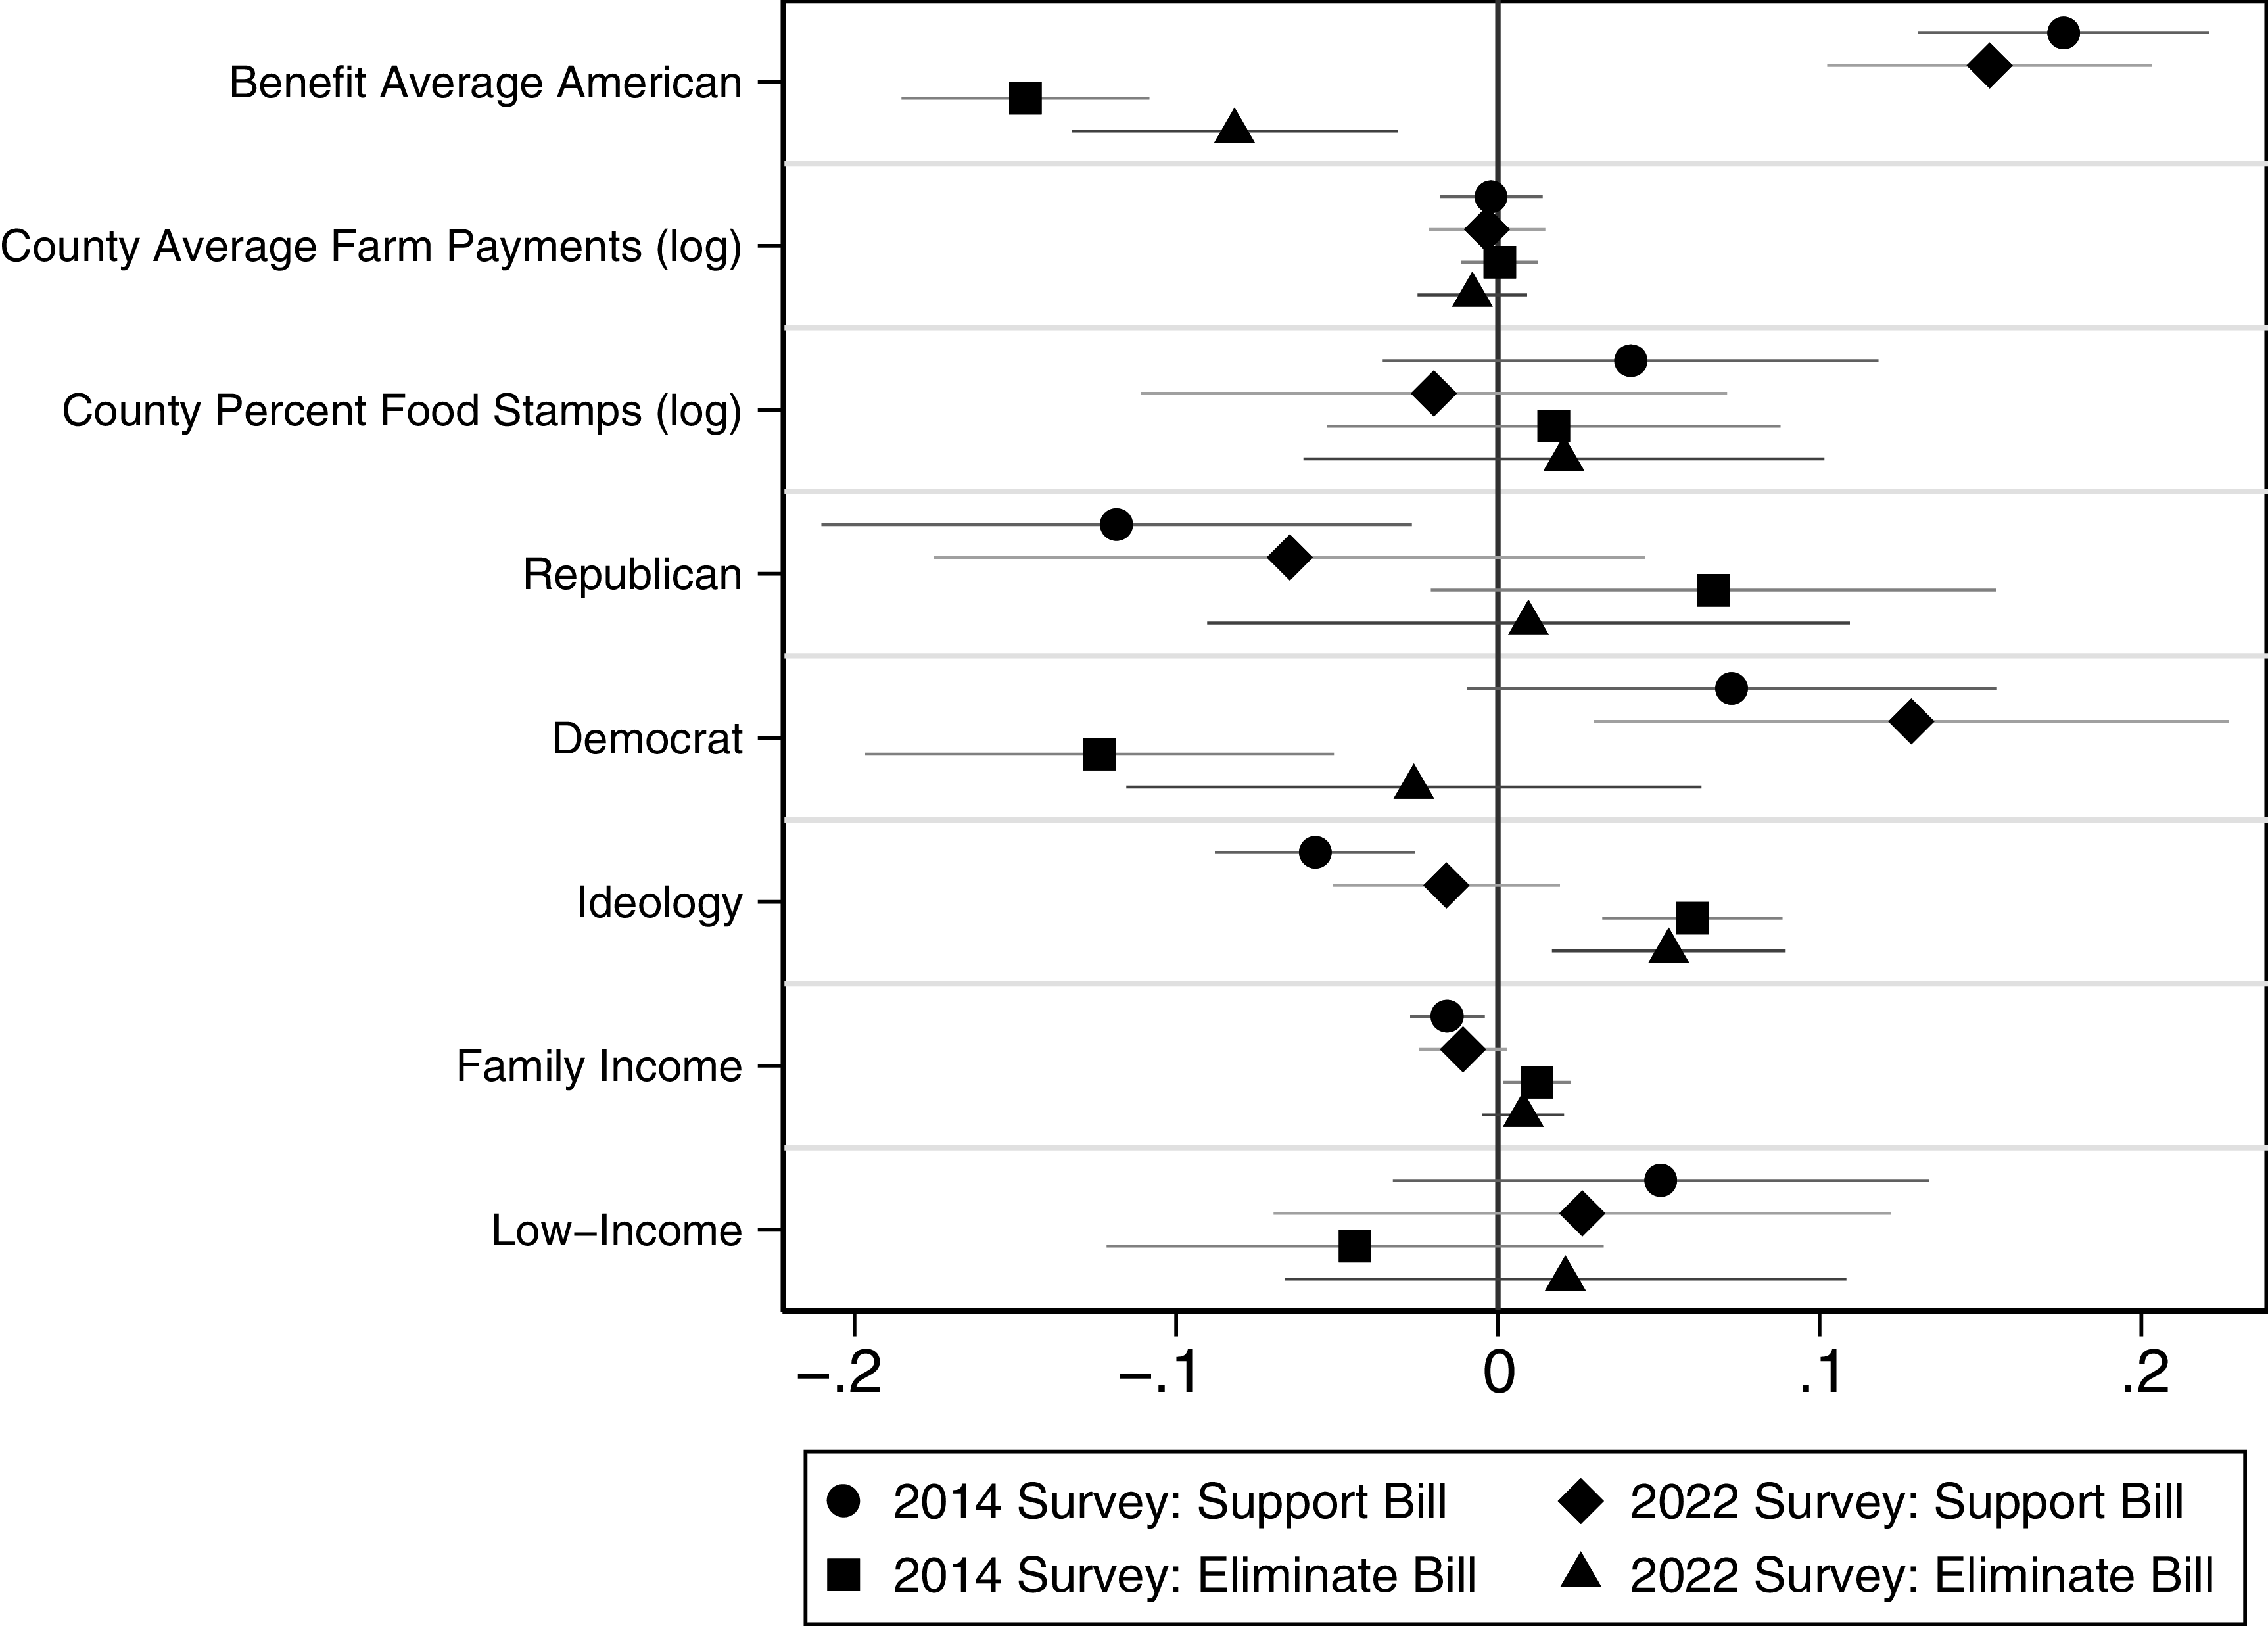
Even after introducing individual and county-level controls (Figure 1, Appendix Table A.4), these findings remain stable. Holding all else constant, perceived benefits to the “average American” increase support for the Farm Bill policy package in both 2014 (
 $\beta = 0.18$
) and in 2022 (
 $\beta = 0.15$
). It also increases opposition to eliminating the policy package in both 2014 (
 $\beta = -0.15$
) and in 2022 (
 $\beta = -0.08$
). Compare these coefficients to party affiliation. Being a Democrat, holding other factors constant, increases policy support for the Farm Bill package (
 $\beta = 0.07$
) in 2014 whereas being a Republican decreases support (
 $\beta = -0.12$
). Neither being low-income nor living in a beneficiary district are significant, ostensibly shedding doubt on self-interest-based arguments. These findings are comparable in the model including congressional district-level benefits (Table A.5 in the Appendix).
Perceptions of benefits to the average American on support for farm bill package renewal and elimination (county-level benefits, 95% confidence intervals, results from Table A.4.
Source: CES survey modules).

Perceptions of benefits to the “average American” may overlap with respondents’ other beliefs about distributional benefits from the Farm Bill. To account for this, we include measures of benefit perceptions from the bill to its “main” target groups: the low-income (poor) and corporate and family farms.Footnote
8
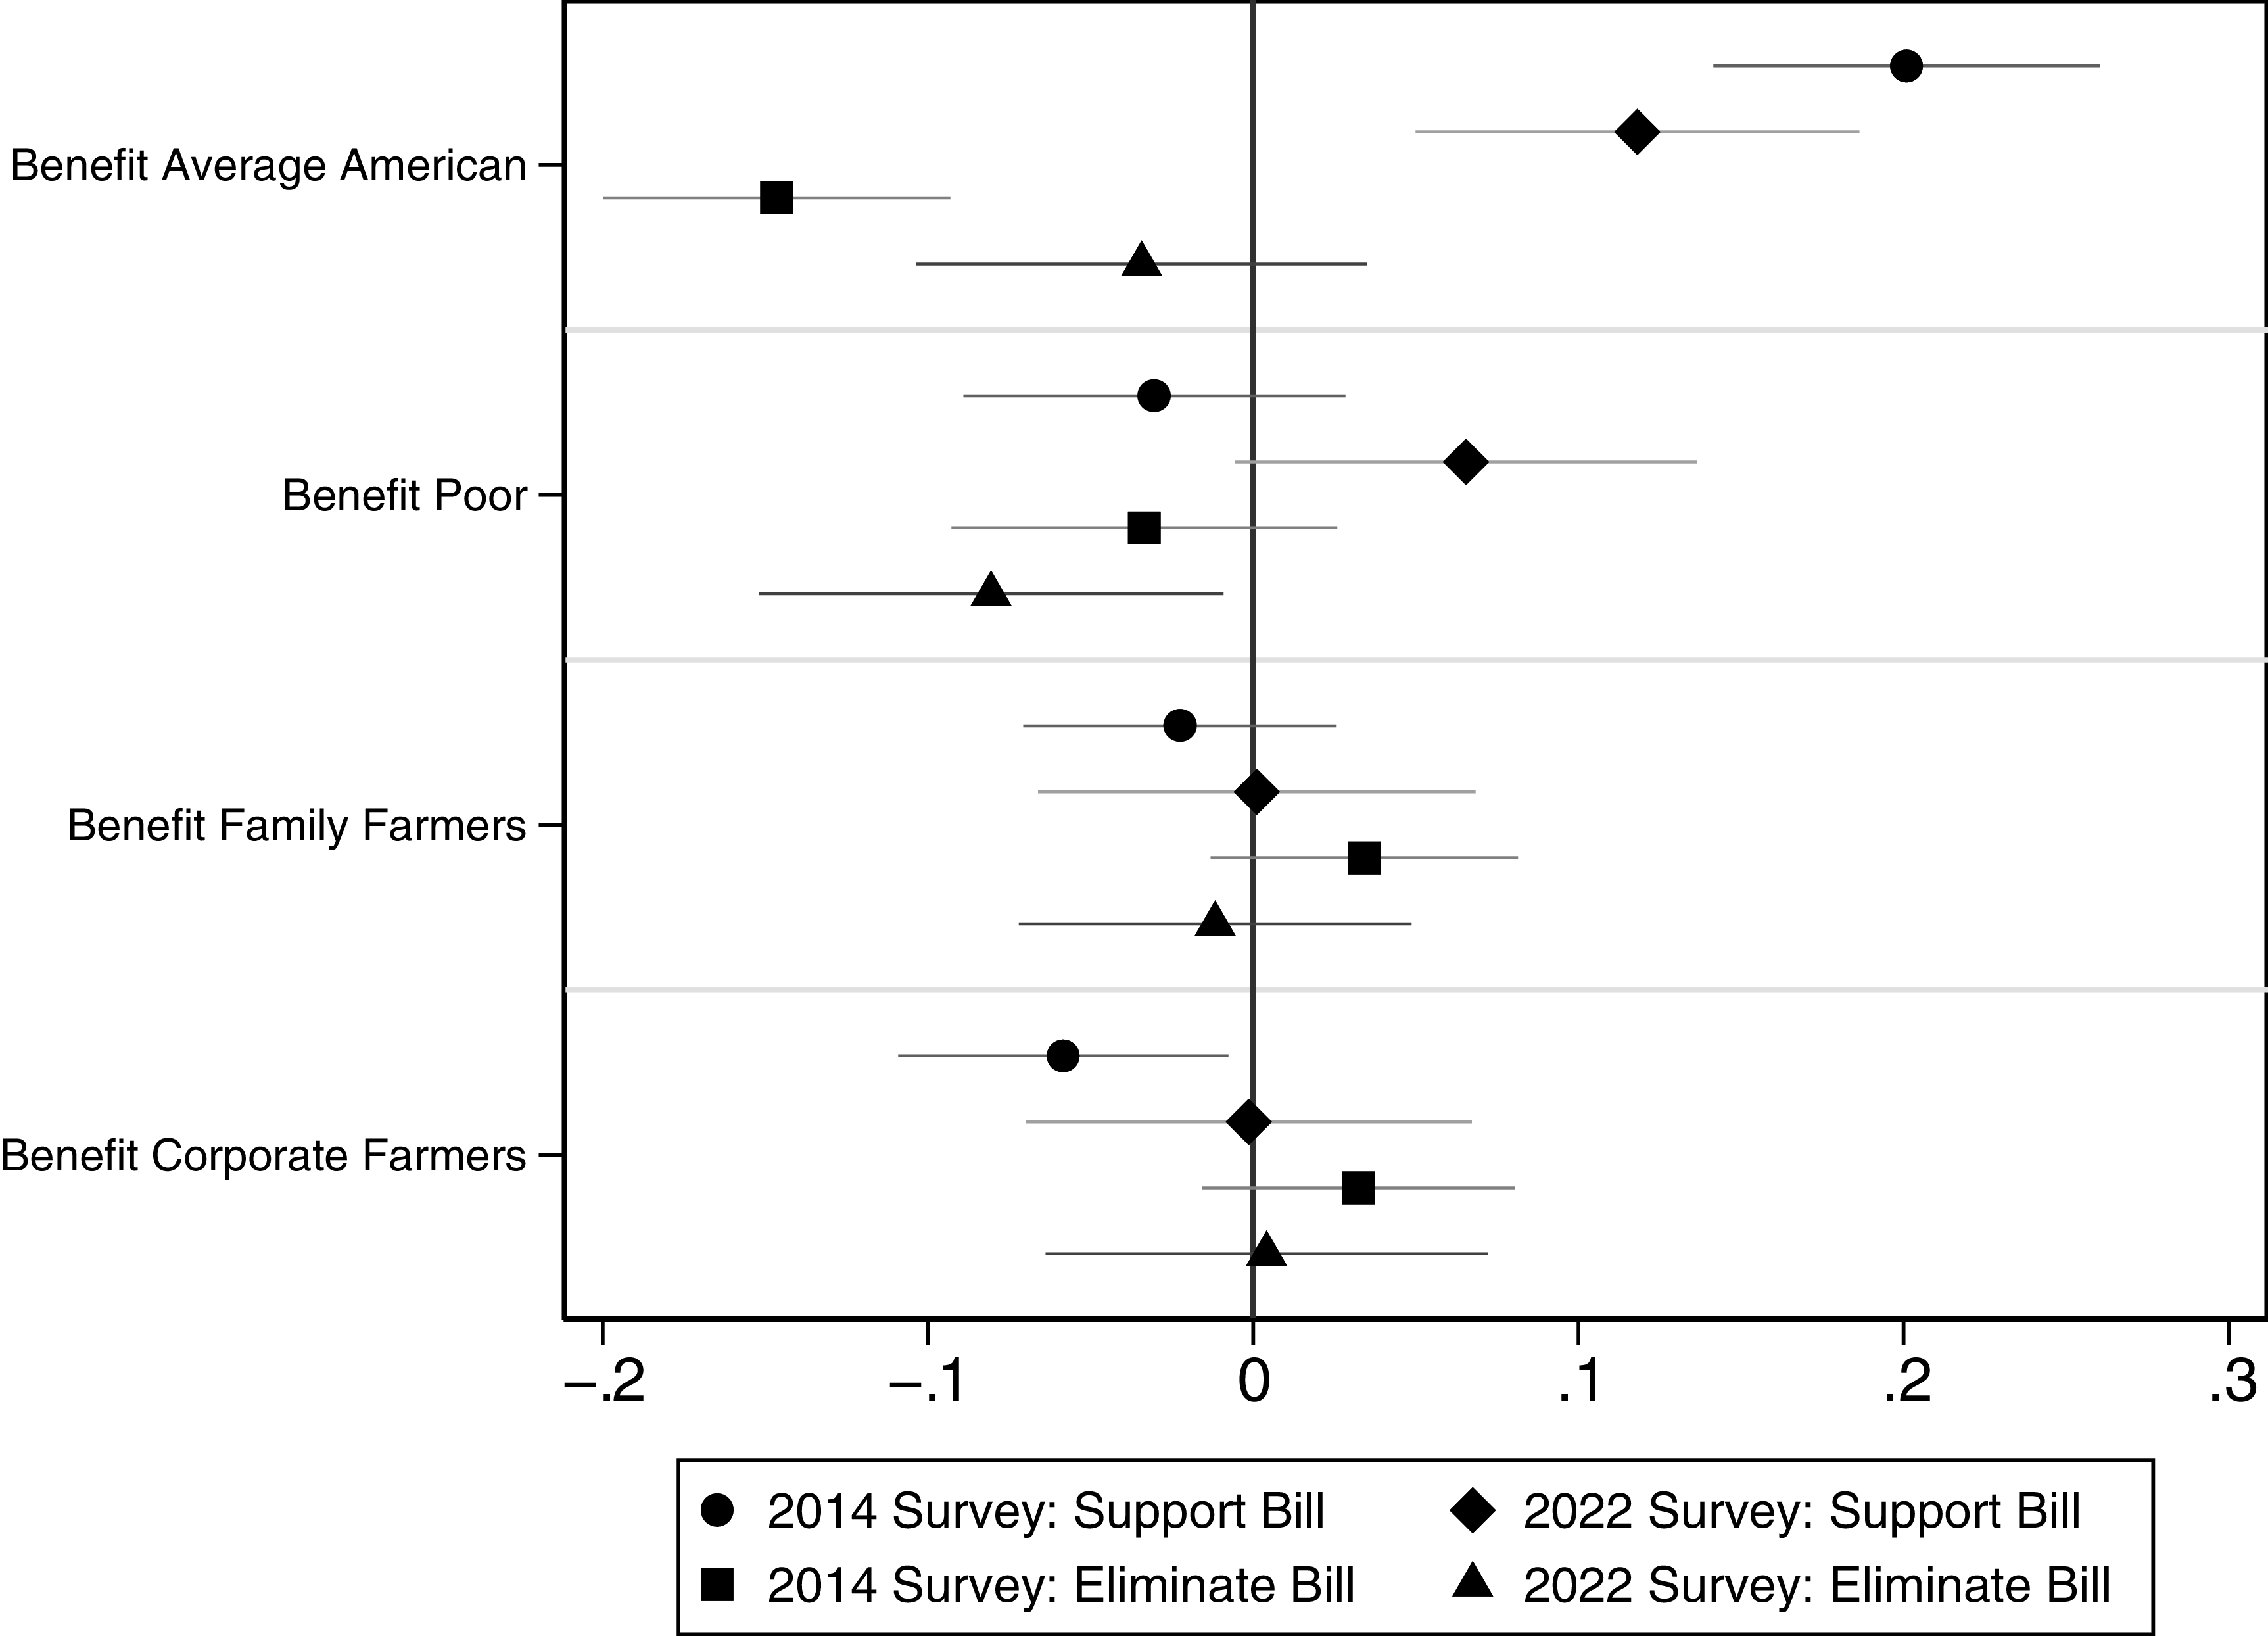
Coefficients are plotted in Figure 2 (Appendix Table A.6). Again, perceptions that the “average American” benefits from the Farm Bill remain significantly associated with policy support. Holding all else equal, perceived benefits to the “average American” increase support for the Farm Bill policy package in both 2014 (
 $\beta = 0.20$
) and in 2022 (
 $\beta = 0.12$
). In contrast, beliefs about the poor, family farmers, and corporate farmers as beneficiaries are not significantly associated with explaining policy support. We only see that once we account for main target group benefits, beliefs about the “average American” benefiting do not explain opposition to eliminating the policy package in 2022. Rather, opposition to eliminating the bill in 2022 is associated with benefits to the poor.
Perceptions of benefits to the average american and main target groups on support for farm bill package renewal and elimination (county-level benefits, 95% confidence intervals, results from Table A.6.
Source: CES Survey Modules).

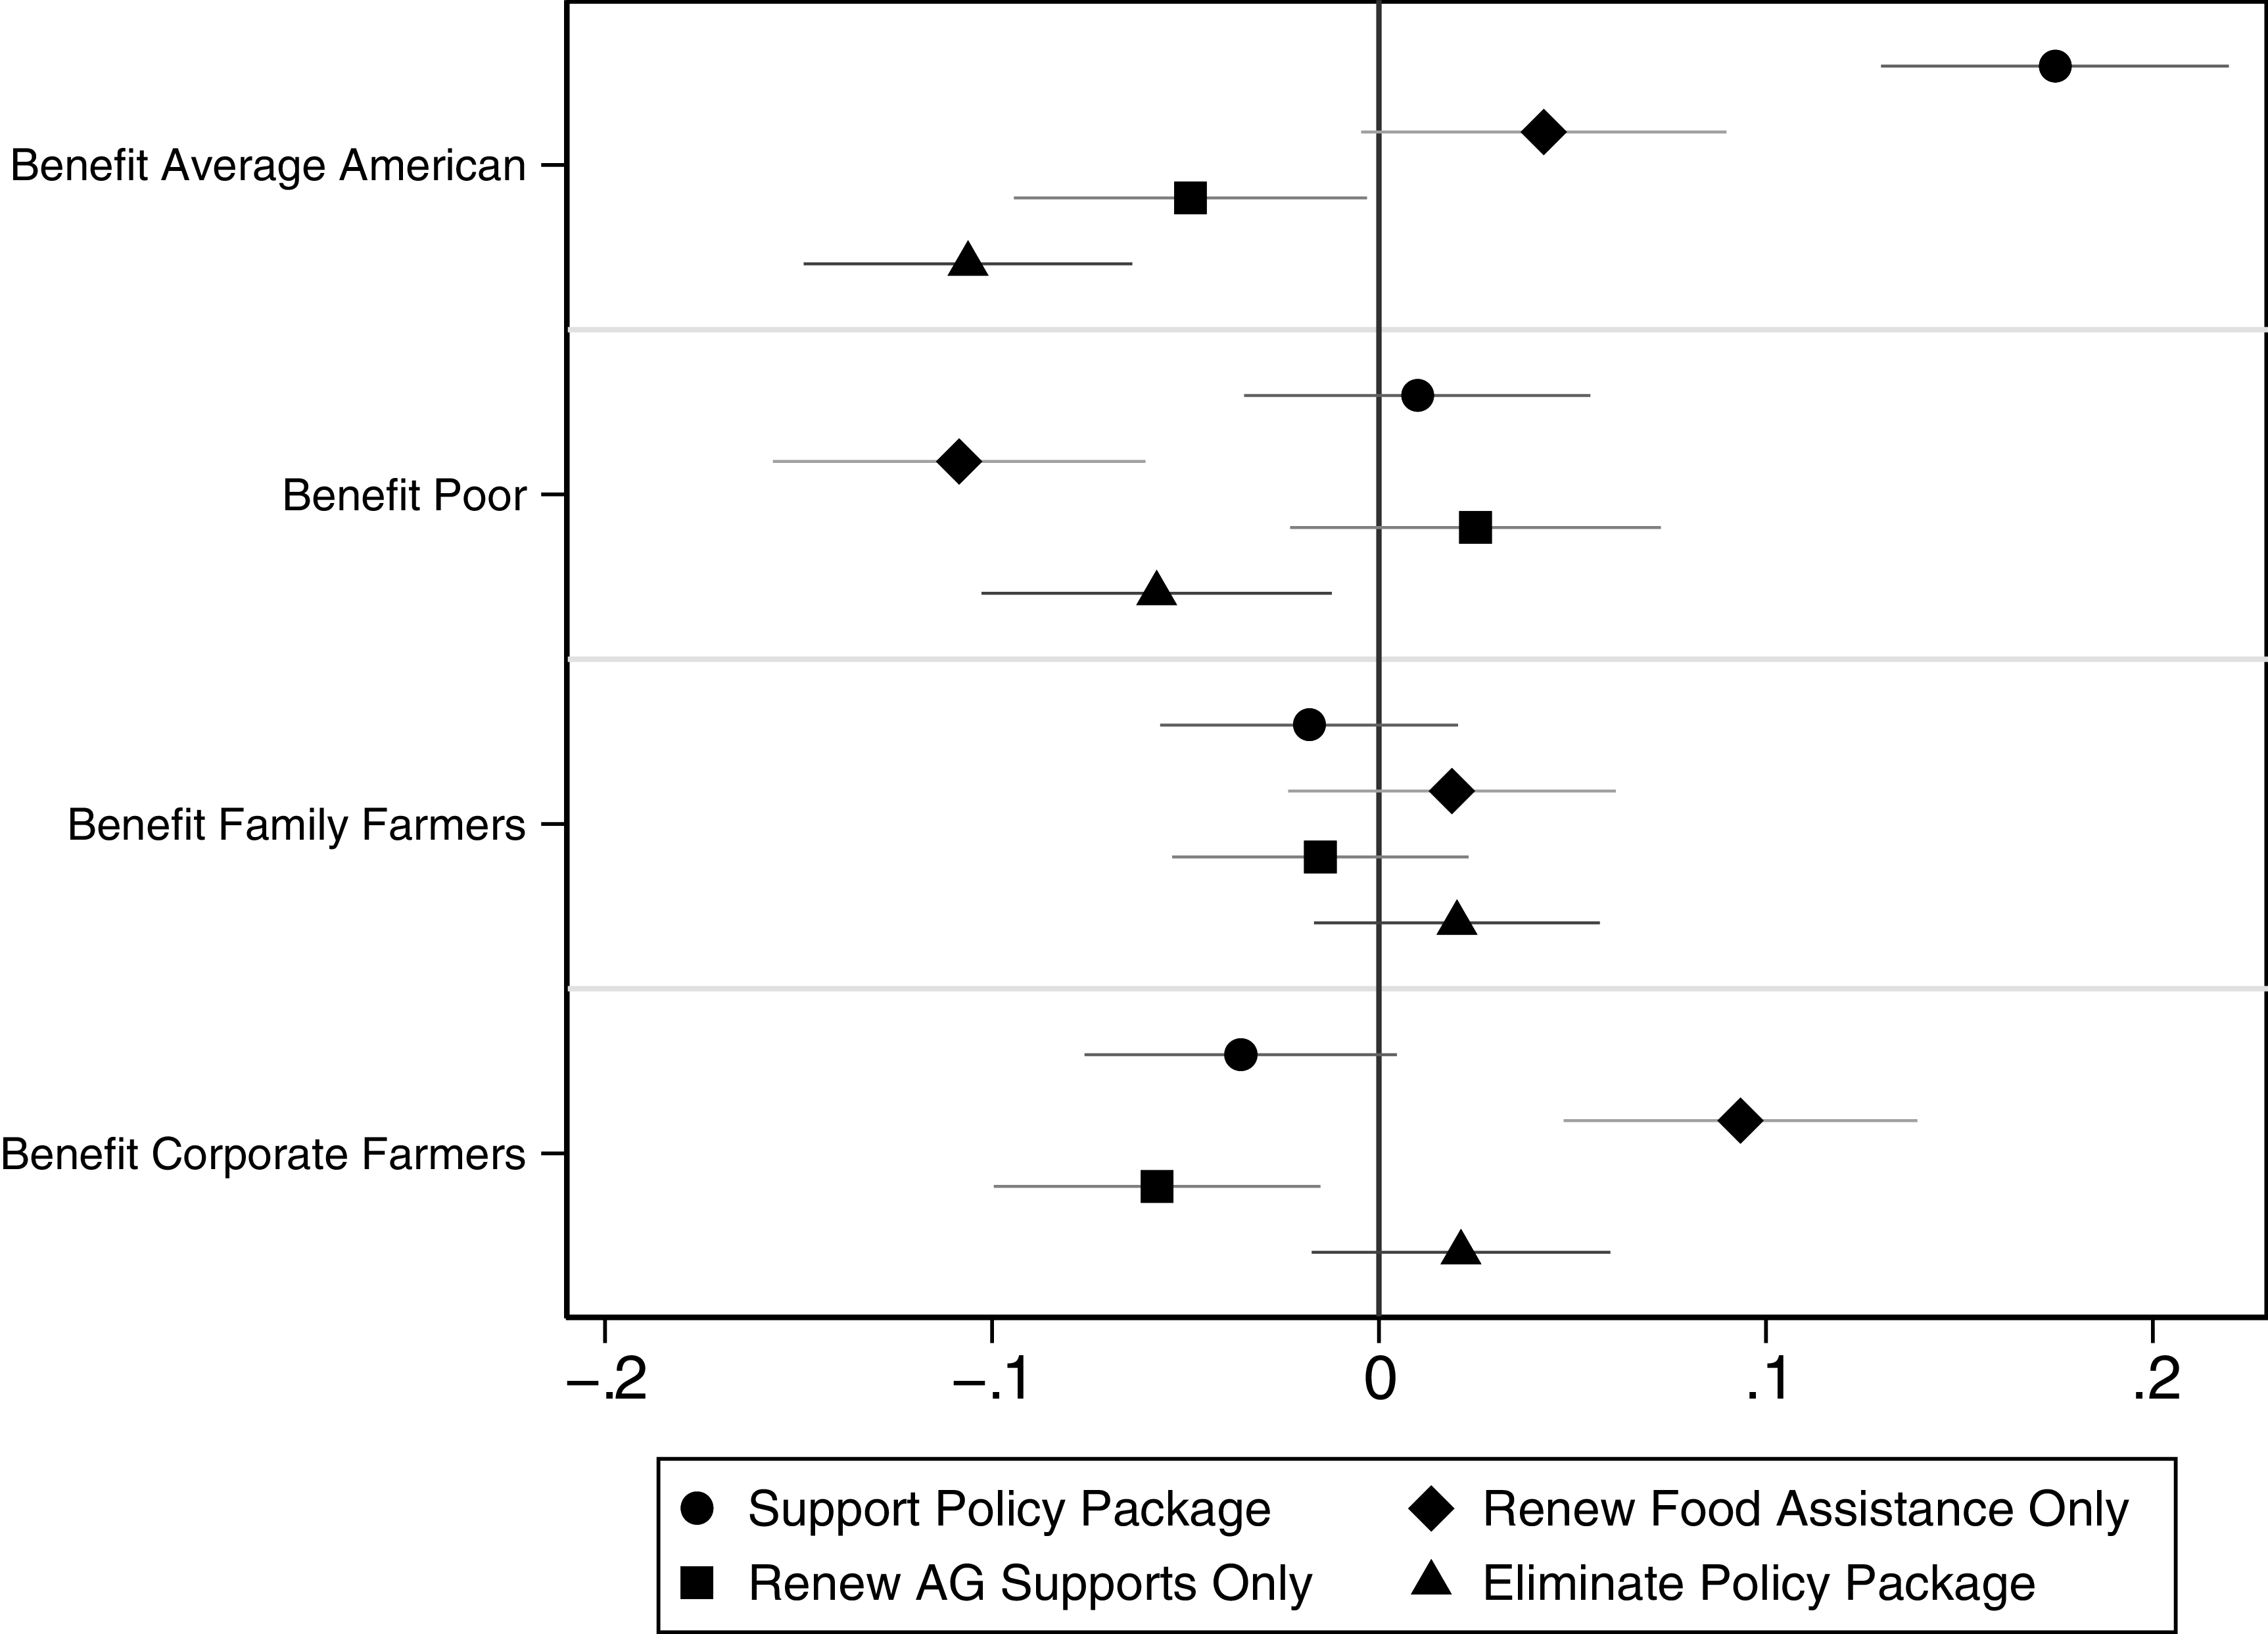
To assess the accuracy of the cross-sectional models, we also estimate our model by pooling the survey data so that we can test whether the effect of the “average American” changes over time (Appendix Table A.7). This captures not just individual-level variation, but also shifts across survey waves, allowing us to assess whether the effect of perceived benefits is stable across time, while holding constant other controls. The results, shown in Figure 3, reveal that perceptions of benefits to the “average American” are consistently and substantively associated with policy support for the Farm Bill package. Respondents who perceive benefits to the “average American” are significantly more supportive of renewal (
 $\beta = 0.17$
) and less supportive of eliminating the package (
 $\beta = -0.11$
). Benefits to the “average American” are less consistently associated with support (insignificant or negative) for non-omnibus versions of the Farm Bill that would separate policies (only renewing food assistance or agricultural subsidies). Rather, the “average American” heuristic is most consistently associated with support for the omnibus (package) version of the Farm Bill.
Perceptions of benefits to the average American and main target groups on support for varying farm bill packages in pooled model (county-level benefits, 95% confidence intervals, results from Table A.7.
Source: CES Survey Modules).

While the “average American” heuristic holds across waves, it has little effect on support for splitting the bill into only agricultural support or food assistance. Perceptions of benefits to other groups produce a more mixed pattern. Unlike the “average American,” benefits to the main target groups (farmers and low-income) appear to work differently depending on the specific components of the policy package under consideration and often, in unclear directions.
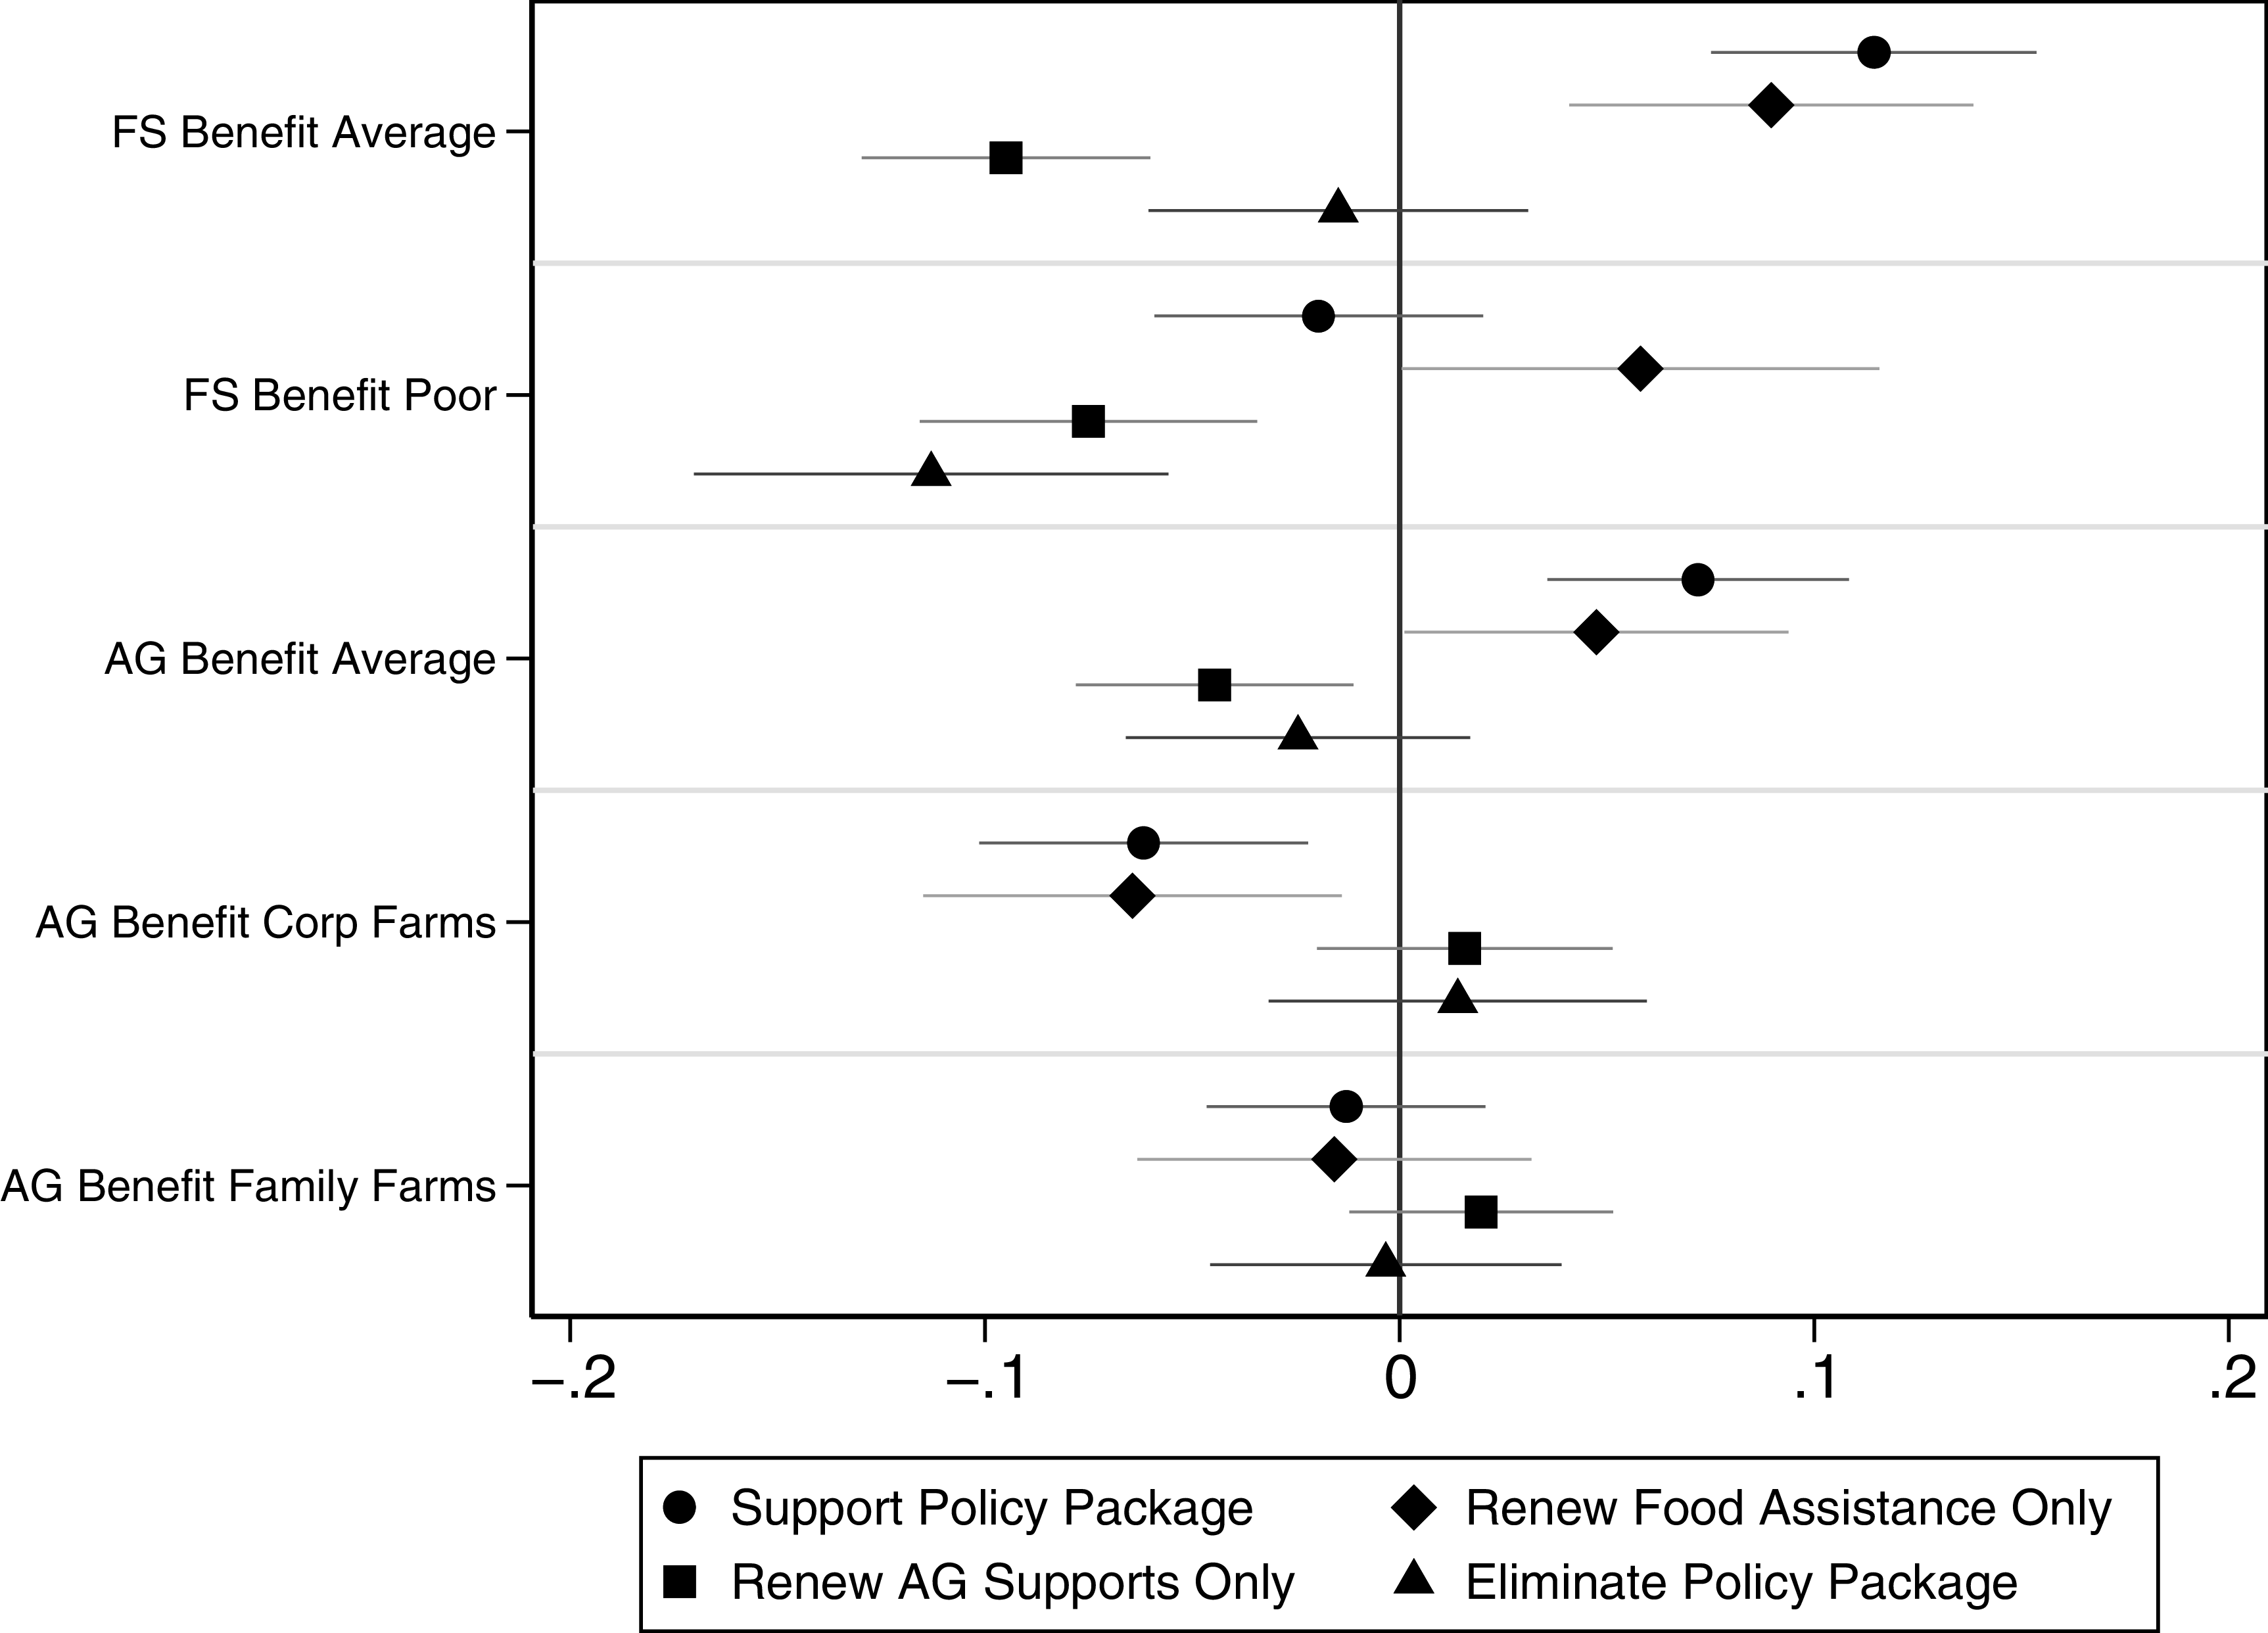
To test whether the “average American” heuristic operates differently across policies in the Farm Bill, we also break down group-based benefits by SNAP Food Stamp assistance (FS) or Agricultural Price Supports (AG). Figure 4 displays the coefficients in the model for policy support with county-level benefits (Appendix Table A.8). Holding all else equal, perceived benefits to the “average American” from food assistance increases support of the Farm Bill policy package in both 2014 (
 $\beta = 0.11$
) and in 2022 (
 $\beta = 0.09$
). Results are nearly identical in the model with congressional district-level benefits (Table A.9). Compared to renewing the omnibus policy package, benefits to the “average American” are similarly associated with policy support, as well as opposition to eliminating the bill in 2014.
Perceptions of benefits to the average American and main target groups by individual policies in the farm bill (county-level benefits, 95% confidence intervals, results from Table A.8.
Source: CES Survey Modules).

Benefits to the “average American” from agricultural policies also matter. In contrast to benefits to corporate farmers, which is correlated with opposition to the omnibus version of the bill, benefits to the “average American” through agricultural policies is associated with roughly the same policy support in both 2014 (
 $\beta = 0.07$
) and in 2022 (
 $\beta = 0.05$
). This group-based heuristic is clearly evident in the models examining support for and opposition to the Farm Bill proposals that separated food assistance from farm assistance (Table A.8 & Table A.9). In both 2014 and 2022, perceptions that the “average American” benefits from the agricultural policies, correlates with opposition to a package that only renews funding for supplemental food assistance. This is also the case for beliefs that the “average American” benefits from food stamps, which results in opposition to the Farm Bill option that only renews agricultural price supports.
Other group heuristics surface as well. Notably, whether the programs helped the poor had significant effects when food stamps were at risk of being eliminated in 2014. In both 2014 and 2022, most people believed that food assistance helped the poor. In 2014, this portion of the Farm Bill drove much of the political conflict over passage. We see that, in 2014, believing that the poor benefit from this policy drove opposition to eliminating the Farm Bill package (
 $\beta = -0.08$
) in the county-level model (Table A.8, Model 7). Again in 2022, the belief that food assistance benefited the poor was by far the strongest predictor of opposition to the proposal to end the Farm Bill entirely (
 $\beta = -0.11$
).
Farmers are the other group targeted by the Farm Bill. As shown in Table 1, most people see programs as benefiting family farms and corporate farms. The perceived benefits to corporate farms, however, do not consistently translate into support. In 2014, beliefs that corporate farms benefit translated into opposition to the Farm Bill policy package (
 $\beta = -0.06$
). This suggests that Americans do not want to see corporate farms as beneficiaries of this policy package (Table A.8 & Table A.9). More surprising, though, are the null findings for family farms. Much of the rhetoric and debate around the federal agricultural policy is shaped by the importance of the family farmer (Browne et al. Reference Browne, Skees, Swanson, Thompson and Unnevehr1992). Nonetheless, findings suggest that, in both 2014 and 2022, perceptions that agricultural programs benefit family farmers did not translate into meaningful support for the Farm Bill package.
A central challenge is disentangling whether perceptions that the “average American” benefits from the Farm Bill drives support, or whether existing support shapes these perceptions. Although our observational data cannot fully resolve such potential sources of endogeneity, we take several steps to assess robustness. Drawing on variation across survey years and alternative model specifications, we find that the association between the average-person heuristic and policy support remains stable. In contrast, perceptions that the Farm Bill benefits the poor or farmers do not consistently predict policy support in the same way. These patterns suggest that the “average American” captures something distinct from general acquiescence or uniform positive responding, even if we cannot fully rule out endogeneity between perceptions and support. To further clarify what may underlie the “average American” as an average-person heuristic, we now examine variation over time and its relationship to race and self-interest.
Disentangling race and the “average American”
We have shown that perceptions of the Farm Bill as a benefit to the “average American” is consistently associated with support for the policy package. Yet, this notion is unlikely to be race neutral; conceptualizations of being “American” can signal default whiteness (Dawkins and Hanson Reference Dawkins and Hanson2024; Yogeeswaran and Dasgupta Reference Yogeeswaran and Dasgupta2010). Racial discrimination profoundly influences public opinion and opposition to social policies in the United States (Alesina et al. Reference Alesina, Glaeser and Sacerdote2001; Baekgaard et al. Reference Baekgaard, Herd and Moynihan2023; McClain et al. Reference McClain, Carew, Walton and Watts2009; Schneider and Ingram Reference Schneider and Ingram1993; Zhirkov et al. Reference Zhirkov, Lunz Trujillo and Myers2025). Rhetoric around social policies often relies on race-coded language, which, especially among white Americans, conditions policy attitudes (Gilens Reference Gilens1996, Reference Gilens1999; Haney-López Reference Haney-López2015; Winter Reference Winter2006). In line with this, prior research shows that framing policies as disproportionately benefiting white Americans increases support among white people (Clawson and Jett Reference Clawson and Jett2019; Wetts and Willer Reference Wetts and Willer2018; Winter Reference Winter2006).
These studies suggest that policy support is shaped not only by economic considerations but also by perceptions of deservingness (Ellis and Faricy Reference Ellis and Faricy2020) and implicit racial associations about recipient groups (Brown-Iannuzzi et al. Reference Brown-Iannuzzi, Cooley, McKee and Hyden2019; Hancock Reference Hancock2004). If such racialized perceptions shape the “average American,” then its association with policy support should vary systematically across respondents, conditional on their levels of racial resentment.
To account for these racialized attitudes, we construct an index of racial resentment. We rely on two questions from CES to measure levels of agreement with the following statements: “Irish, Italians, Jewish and many other minorities overcame prejudice and worked their way up. Blacks should do the same without any special favors” and “Generations of slavery and discrimination have created conditions that make it difficult for Blacks to work their way out of the lower class.” For the first, higher values indicate greater racial resentment, while the second is reverse coded to capture denial of structural barriers. We averaged responses to create a single index of “racial resentment.” In the following, we include the racial resentment index as a covariate in our estimations of support for the Farm Bill package.
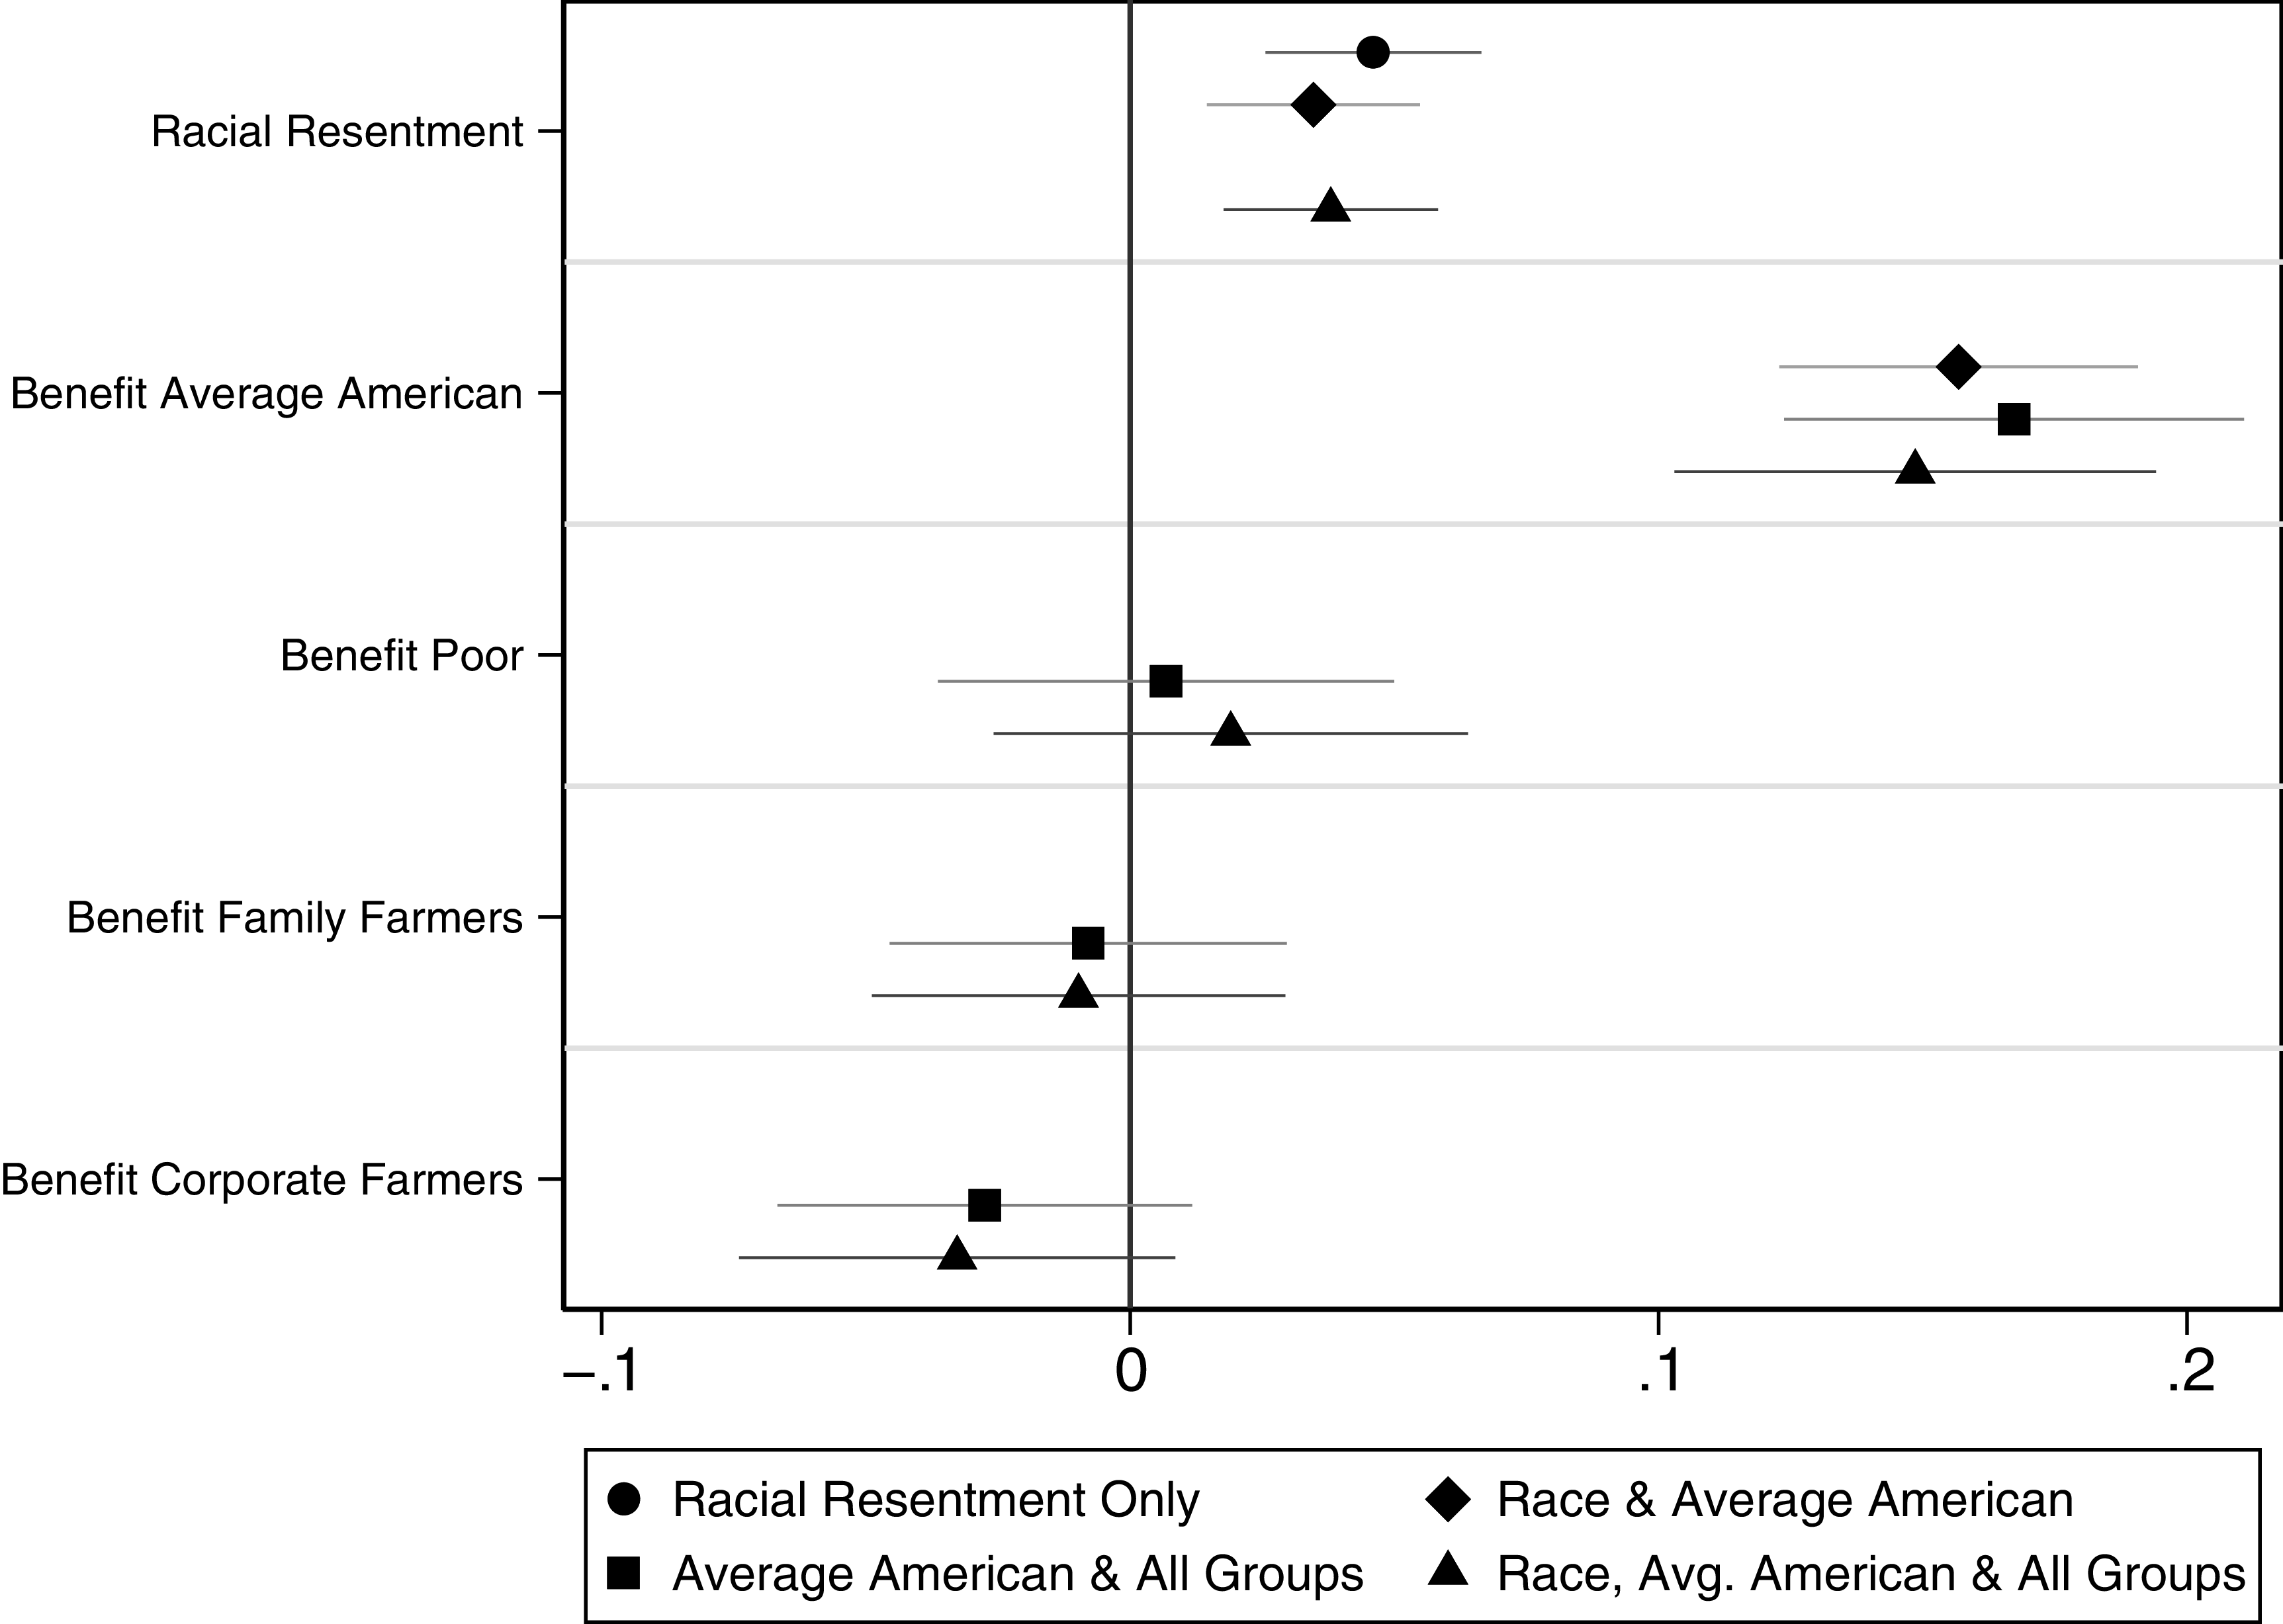
Even after including racial resentment, support for the Farm Bill still largely hinges on perceptions of benefitting the “average American.” Using the pooled survey data, Figure 5 (Appendix Table A.10) plots coefficient estimates for perceptions of benefits across four model specifications: (1) racial resentment only, (2) benefits to “average American” and main target groups, (3) racial resentment and benefits to the “average American,” and (4) racial resentment and benefits to the “average American” and main target groups.
Varying model specifications of perceptions of benefits to groups on support for farm bill package renewal controlling for racial resentment (county-level benefits, 95% confidence intervals, results from Table A.10.
Source: CES survey modules).

When modeled alone, resentment is a positive and significant predictor of support for policy renewal. Once perceptions of group-based benefits are included, the effect shrinks somewhat. This suggests that part of what resentment captures may be tied to how people perceive the distribution of benefits to the “average American.” Across all models, benefits to the “average American” are strongly and positively associated with policy support and remain significant even after controlling for racial resentment and other target groups. Benefits to the poor, family farmers, and corporate farmers have smaller and less stable effects.
Importantly, racial resentment and perceptions of benefits to the “average American” are both significant in the model. The inclusion of racial resentment does not diminish the association of the “average American” to policy support. It appears that the two work in parallel, with both associated with some level of support for the Farm Bill. While meaningful, the substantive effects of racial resentment are notably smaller and appear to work through a different channel. Some support from the Farm Bill may reflect racialized perceptions about deservingness and beneficiary groups, yet including racial resentment does not significantly diminish the predictive power of the “average American.” Even after controlling for racial resentment, the explanatory power of the “average American” heuristic remains significant for predicting support of the policy package.
Variation in perceptions of the “average American”
To account for heterogeneity in perceptions of benefits to the “average American,” we examine other subgroup models, including by race (Appendix Table A.11 and A.12). We find little substantial differences in the “average American” heuristic across racial groups, suggesting that the “average American” serves as a broadly shared reference point in evaluating policy benefits. Comparing levels of income (Appendix Table A.13) or political affiliations (Appendix Table A.14) yields similar results. For nearly all income groups, benefits to the “average American” are associated with significant and substantial policy support. The effect is greatest for all groups in 2014. Between partisan groups, benefits to the “average American” are consistently associated with policy support. For Republicans in 2022, however, the effect is only significant at the 10% level, while it is a significant predictor among Democrats in this period.
To account for potential bias in our findings based on variation in levels of political knowledge, we also estimate models that examine whether the relationship between perceptions that the Farm Bill benefits the “average American” is conditioned by political interest and engagement. To do so, we include a measure of news interest (4-point scale where higher values indicate that respondents more regularly follow the news) and a measure of political engagement based on three forms of political participation. These questions ask respondents if, in the last year, they have: (1) attended local political meetings, (2) donated money to a candidate or political organization, and (3) displayed a political sign. Using the binary responses to the questions, we created a mean value where higher levels indicate greater political engagement. Across models that include these variables (Appendix Table A.15), perceptions that the Farm Bill benefits the “average American” remain consistently associated with support for the policy package. Even after accounting for differences in news interest and political engagement, policy benefits to the “average American” significantly explain support for the Farm Bill policy package. The broad contours of these subgroup findings reinforce the average-person heuristic as a factor shaping public support of complex policies while also highlighting minimal variation for its relevance between different racial or income groups and party affiliations.
Understanding the shift from 2014 to 2022
Changes in public opinion over time offer further evidence of the general importance of group heuristics and the salience of the “average American” as a policy beneficiary. Between 2014 and 2022, support for the Farm Bill grew substantially. Policy support rose from 58% to 79% within the estimation sample, a difference of 0.21 points. What explains this shift?
To assess this, we use a Blinder-Oaxaca decomposition to account for the gap in policy support by separating changes attributable to differences in observed characteristics (endowments) from changes in the relationship between those characteristics and support (coefficients). Full results are in Appendix Table A.16. This method is widely used to distinguish compositional changes from structural change in relationships between variables, for example, discrimination in labor markets (Jann Reference Jann2008). In our descriptive application, the endowment component captures changes in perceptions of policy beneficiaries across time, while the coefficient component captures changes in how those perceptions translate into policy support. In other words, this approach allows us to assess whether changes in support are driven more by changes in beliefs about who benefits from a policy or by changes in the political weight attached to those beliefs. The decomposition partitions the observed changes into 1) shifts in perceptions of beneficiaries (X), using 2014 as the reference period, and 2) shifts in the association between those perceptions and policy support:
 $${y_{22}} - {y_{14}} = \left({{X_{22}} - {X_{14}}} \right){\beta _{14}} + \left({{X_{22}}} \right)\left({{\beta _{22}} - {\beta _{14}}} \right)$$
Results indicate that both channels contribute meaningfully to observed increases in support, but in substantively distinct ways. Change in policy support is due to both shifts in perceptions of policy beneficiaries (endowments) and changes in how those perceptions translate into policy support (coefficients).
Perceptions that the Farm Bill benefits the “average American” play a significant role in the decomposition. They constitute the largest contributor to the endowment effect, accounting for 8.1 percentage points of the increase in support for the Farm Bill policy package. This indicates that respondents in 2022 were substantially more likely than those in 2014 to perceive the policy as benefiting the “average American.” Beyond this compositional shift, the coefficient effect shows that the relationship between this perception and support of the Farm Bill also strengthened over time, contributing an additional 2.5 percentage points to the increase in support. Taken together, these results suggest that the growing prevalence of the “average American” as a perceived beneficiary contributed meaningfully to the rise in public support for the Farm Bill.
Other beneficiary perceptions played a comparatively limited role. Changes in perceptions that the Farm Bill benefits low-income individuals made a small negative contribution through the endowment component (−1.4 percentage points), indicating that shifts in the prevalence of this belief slightly offset the overall increase in support. Changes in the prevalence of beliefs about family farmers and corporate farmers contributed little to the endowment effect. Within the coefficient component, perceptions of benefits to corporate farmers were not statistically significant, while the coefficient component associated with family farmers was positive but only marginally significant. These results suggest that changing perceptions of low-income individuals, family farmers, and corporate farmers were not primary drivers of the increase in support of the farm bill policy package between 2014 and 2022.
Overall, the decomposition indicates that rising support for the Farm Bill was primarily due to changes in perceptions that the policy benefits the “average American.” Both the increased prevalence of this belief and its stronger relationship with policy support account for a substantial share of the observed increase. In contrast, changes in perceptions of other target groups contributed relatively little to the shift in public opinion, suggesting that broadening perceptions of who benefits from the Farm Bill, rather than changing views of its traditional beneficiaries, was the principal factor underlying increased support between 2014 and 2022.
Unpacking self-interest from the “average American”
While we have shown that the “average American” is strongly associated with support for the Farm Bill as an omnibus policy package and that racial resentment works in tandem with this heuristic, it remains unclear whether this heuristic differs from self-interest motivations. People may simply think of themselves as an “average American.” To disentangle this, we examine results from a supplemental survey that mirrors our approach in CES but includes perceptions of “benefits to you” as a measure of self-interest. This module was part of the Harvard CAPS/Harris Poll conducted in December 2023 with a nationally representative sample of 2,222 respondents.Footnote 9
In this survey, we included two additional questions gauging personal benefit, asking respondents if they think they personally benefit from food assistance and agricultural price supports. As with our CES survey, we construct an index of perceptions by averaging respondents’ evaluations of the effects of agricultural and food subsidies on themselves, “average Americans,” family farms, corporate farms, and the poor. If the “average American” holds explanatory power beyond self-interest, then including both personal benefits and group-based benefit measures in the model should not cause one to lose significance.
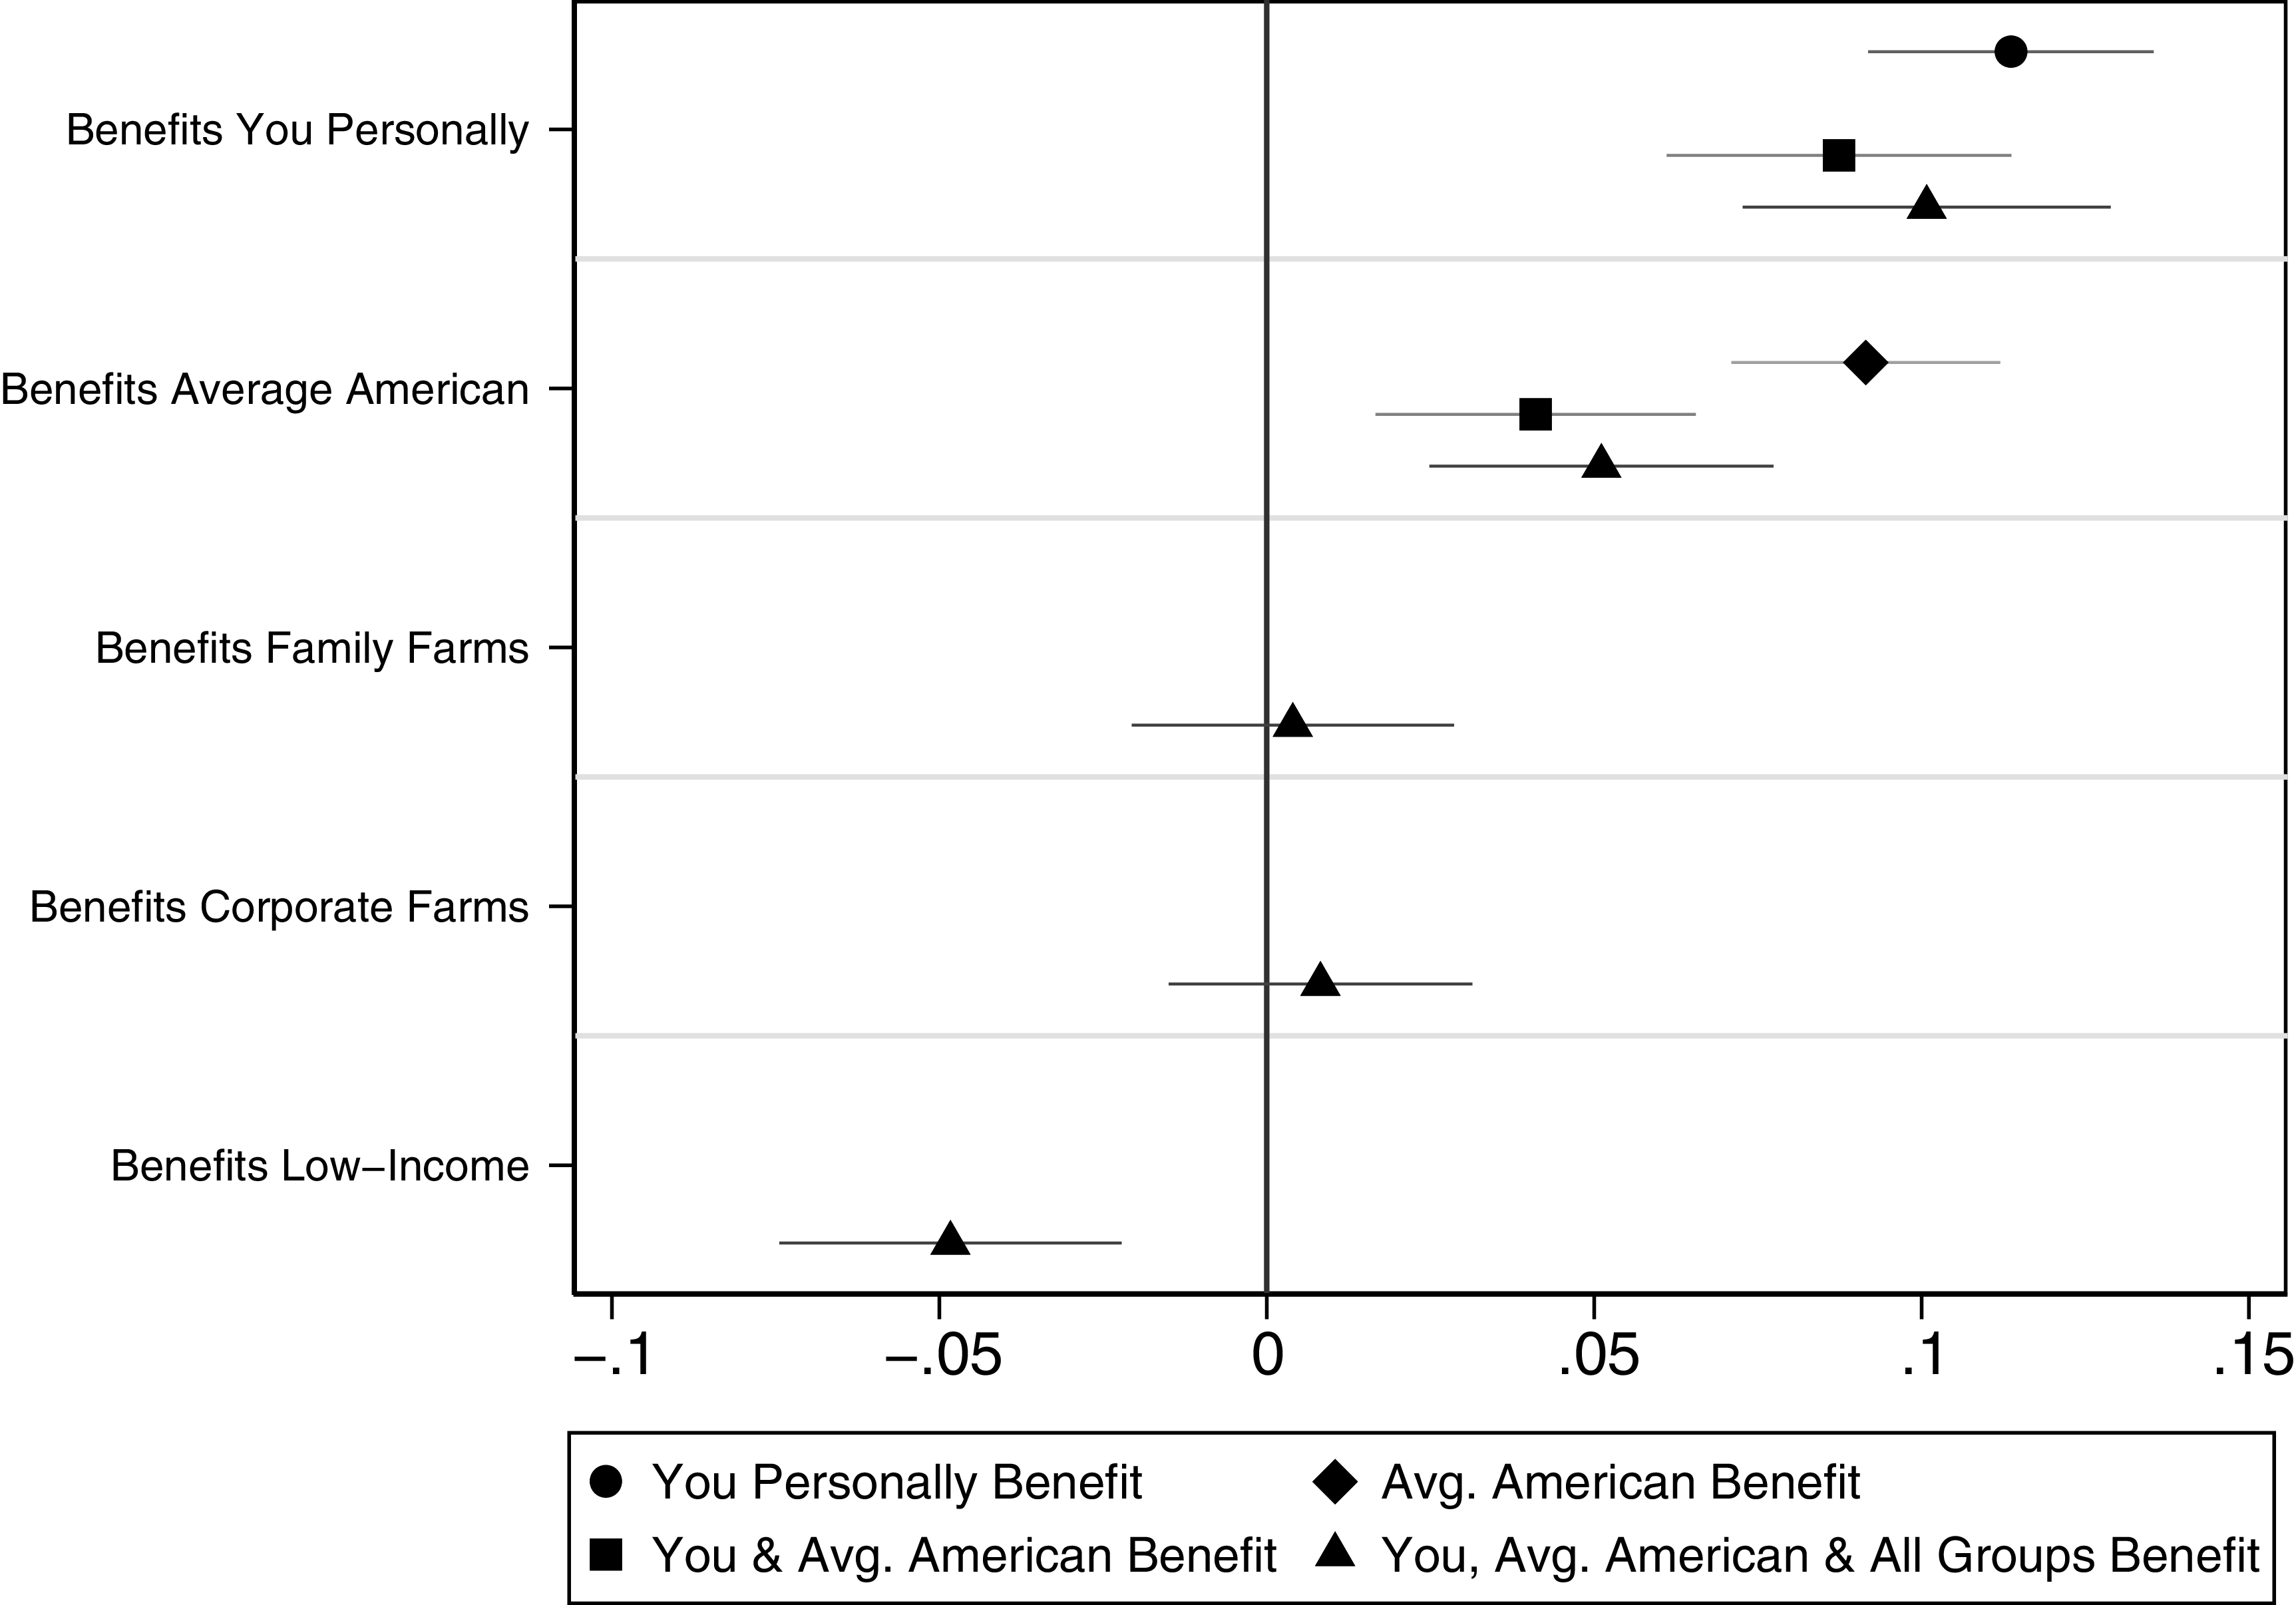
We begin by examining cross-tabulations of respondents who believe that they are personally benefiting alongside the “average American” from Farm Bill policies. Over 60% of respondents think that both groups benefit from agricultural policies and food assistance policies, suggesting considerable overlap. Perceptions of personal benefits from Farm Bill policies are strikingly similar with over 60% of Americans perceiving more benefit than cost. But does this matter for policy support? To test this, we first model support for renewal of the Farm Bill package including only the “average American” and then, adding personal benefit into the model. Both remain statistically significant predictors of support. Including personal benefit reduces the coefficient for the “average American” by about half a percentage point, but the difference between the two is substantively small, suggesting that assessment of broad benefits (through the average-person heuristic) and self-interest simultaneously shape support. Figure 6 (Appendix Table A.17) plots these effects. Benefits to family farmers are again insignificant and benefits to the low-income reduced support for the policy package.
Effect of personal benefit, benefits to the average American and main target groups on support for farm bill policy package renewal (95% confidence intervals, Results from Table A.17.
Source: Harris Survey Data).

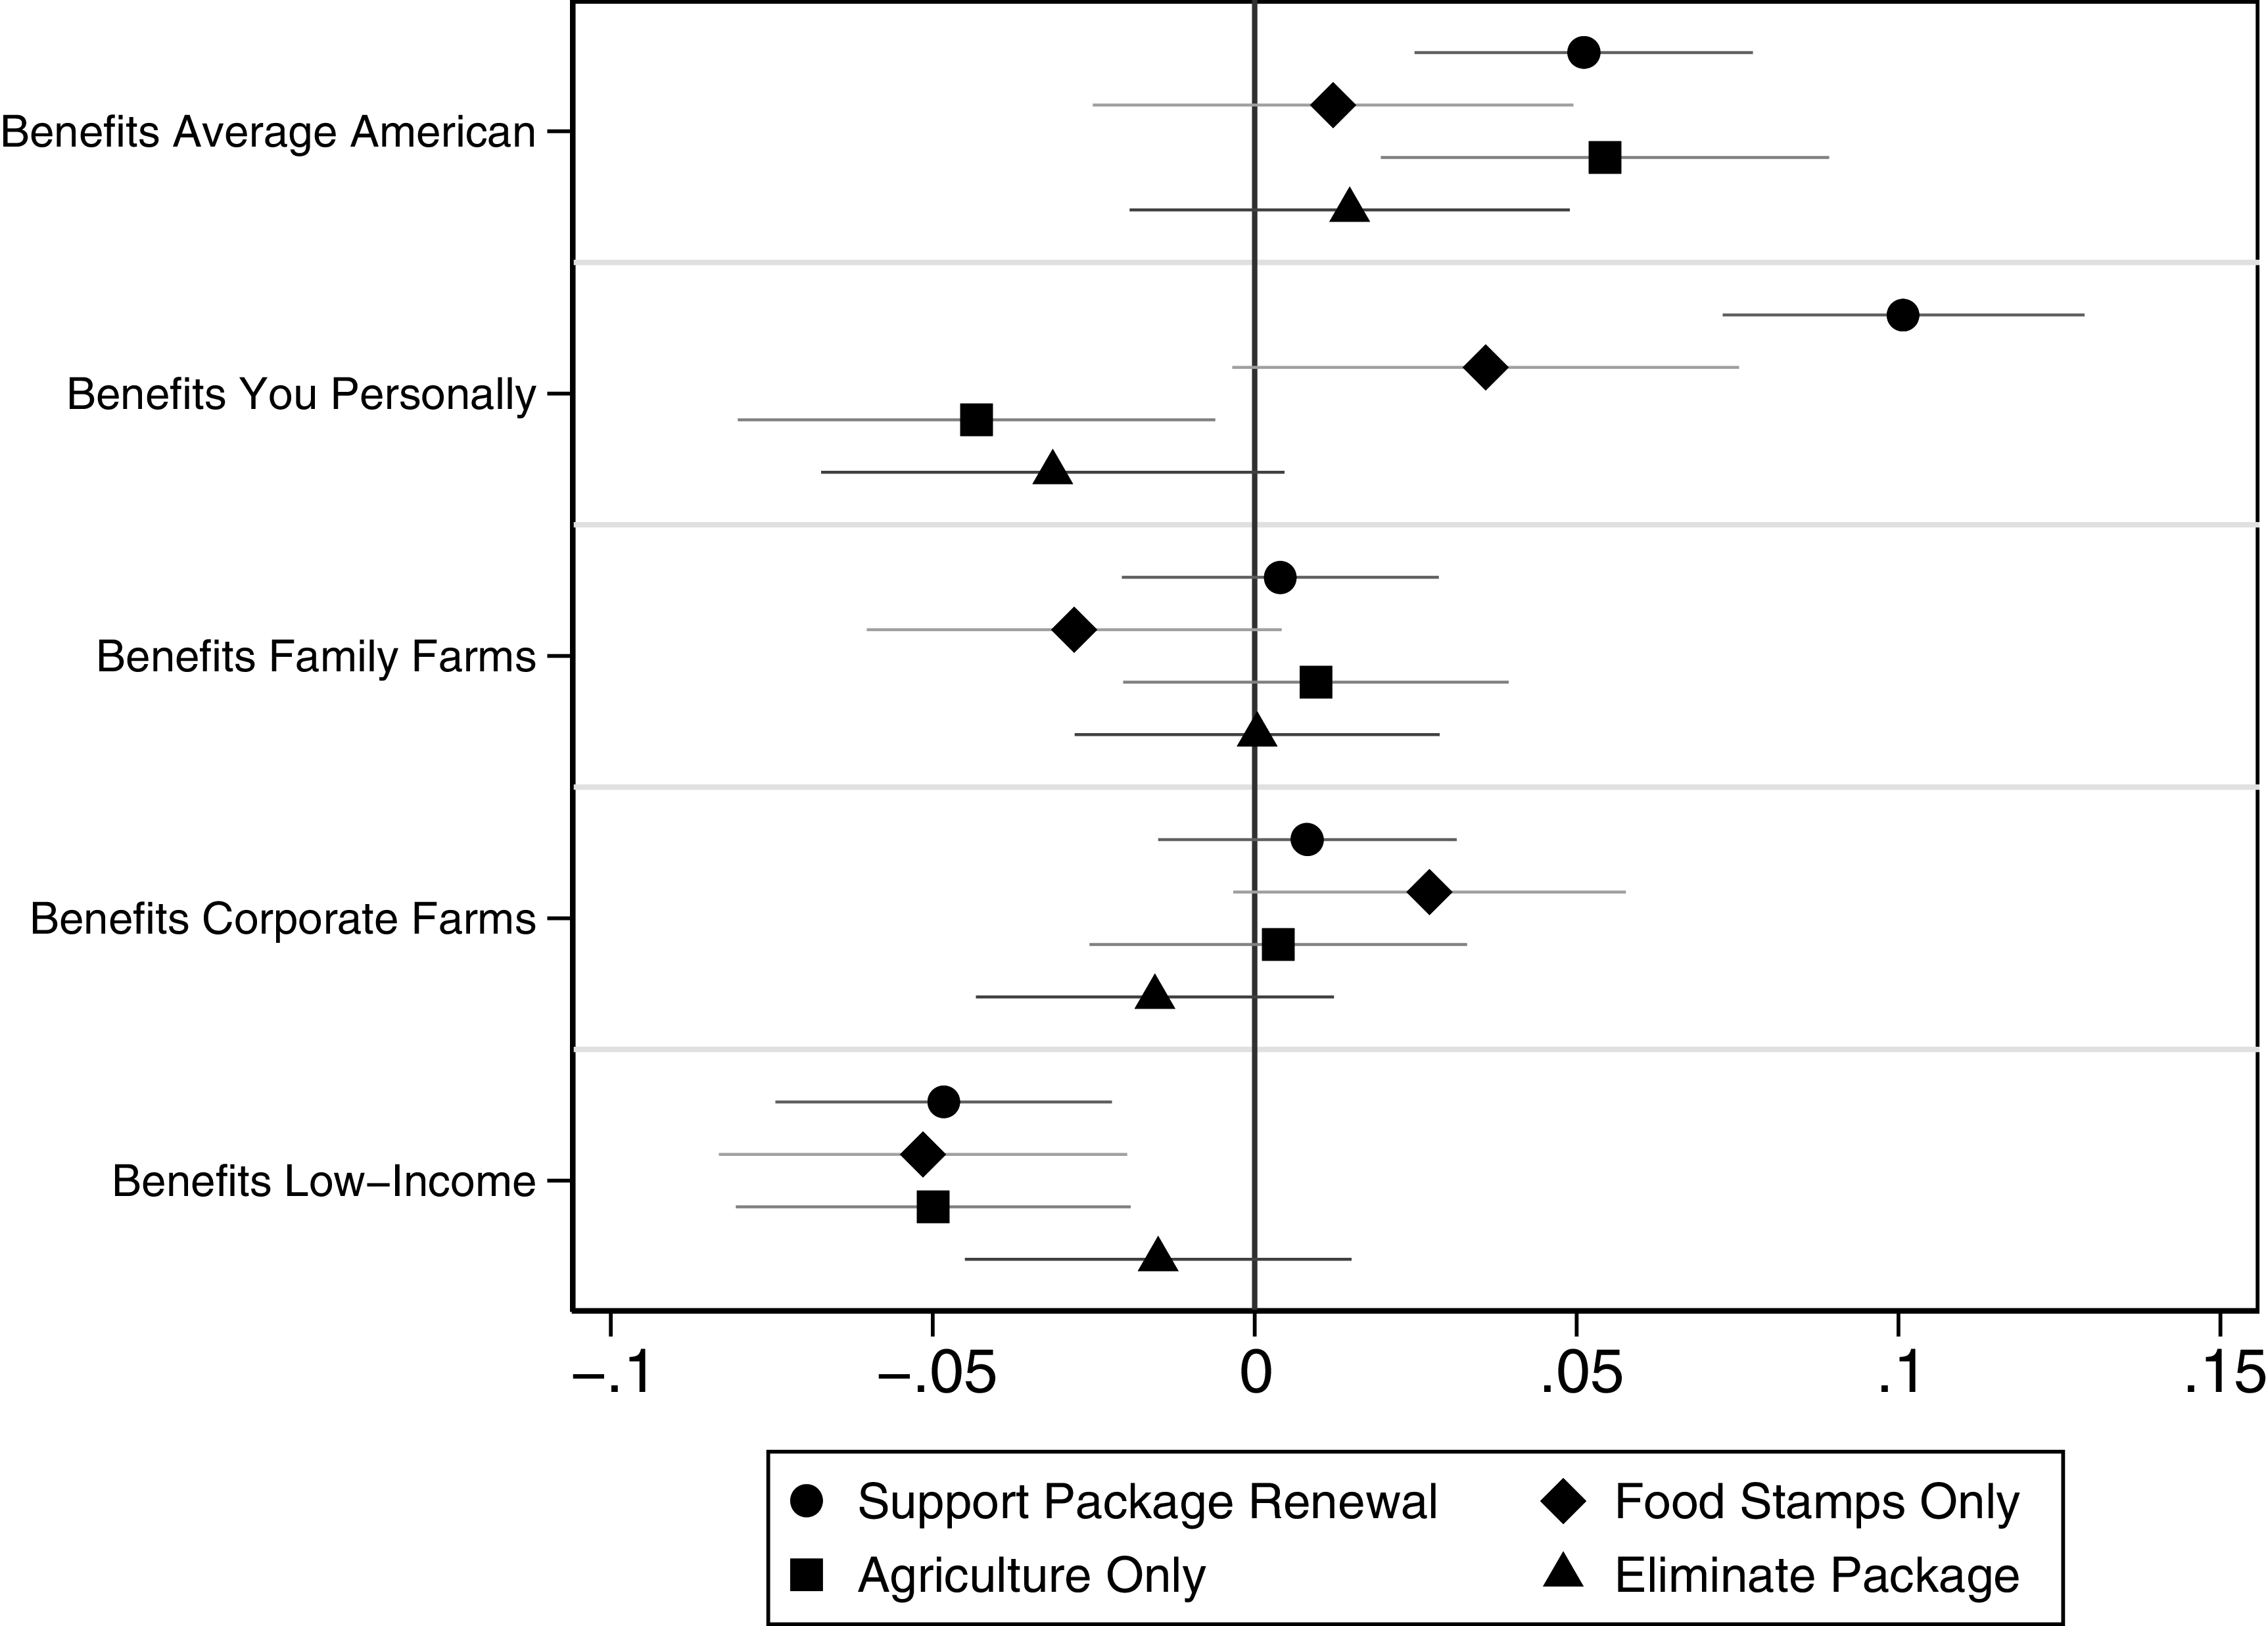
We next assess how adding personal benefits impacts support for alternative Farm Bill policy options. Figure 7 shows that both the “average American” and personal benefit significantly predict support for the full package and for agriculture-only renewal (Table A.18). In contrast, perceptions that policies benefit the low-income, corporate or family farmers are statistically insignificant and much smaller in size. While Farm Bill policies are often justified as bargains struck between targeted constituencies, our analysis suggests that support is not rooted in perceptions of benefits to these groups. Strikingly, perceptions that the poor benefit reduce support. Instead, judgments appear to rest on personal and broad assessments: whether policies benefit oneself and, also, whether they benefit the average person.
Effect of personal benefit, benefits to the average American and main target groups on support for varying farm bills (95% confidence intervals, results from Table A.18.
Source: Harris Survey Data).

These results imply that both personal benefits and benefits to the “average American” increase support for the Farm Bill policy package, meaning self-interest and broad social assessments work simultaneously. Yet, the pattern that emerges from these models also suggests that many people may implicitly conflate their own circumstances with those of the “average American.” In other words, rather than viewing the “average American” as a distinct and external beneficiary group, for many respondents this group-based heuristic captures their own interest. Yet, this is not necessarily the case for all.
Results from this supplemental survey reinforce previous findings that suggest people’s support for omnibus (or complex) policy hinges less on attitudes related to main target groups and more on whether they perceive that benefits align with their own economic situation as well as the collective good, captured by the “average American.” Because our results are based on observational associations, future research should aim to causally identify how priming the “average American,” particularly through elite cues and framing, affects policy support. Further unpacking how respondents conceptualize the “average American,” including for whom this framing resonates and who respondents imagine when invoking the term, is an important direction for future research.
Conclusion
Omnibus policies pose challenges for voters to gauge who benefits, who pays, and whether they support the legislation. We argue that in such contexts people rely on simplifying group-based heuristics. The proposed average-person heuristic serves as such an informational shortcut that captures not only common political rhetoric but also bridges self-interest and sociotropic reasoning. In our analysis of the United States Farm Bill, we examine this heuristic in the form of the “average American.” Its cultural and political salience, reinforced by middle-class identification and political discourse, makes it a cognitively simple yet powerful group-reference that helps people navigate redistributive complexity.
Across survey waves and model specifications, perceptions that the “average American” benefits from the Farm Bill are consistently associated with support for renewing the omnibus package and opposition to its elimination. Contrary to much of the literature (e.g., Hansen Reference Hansen1991), we do not find that policy benefits at the local level explain patterns of support. Along similar lines, perceptions that the Farm Bill benefits traditional target groups, such as the poor or family farmers, do not consistently shape support, which suggests that public opinion for the bill is driven less by positive evaluations of helping disadvantaged constituencies than ensuring broad social benefits.
To further clarify, we assess whether the “average American” heuristic is partly a proxy for other considerations, including racial attitudes and self-interest. The effect of the “average American” holds after controlling for racial resentment. Adding individual self-interest to our model reduces the “average American” heuristic, suggesting that part of its association with policy support reflects perceived personal benefit. However, the heuristic remains significant, indicating that it also captures reasoning beyond narrow self-interest. This suggests that, for some respondents, the “average American” is a proxy for themselves, while for others, it captures something distinct from personal benefit.
We expect the average-person heuristic to be most influential when citizens confront omnibus policies that bundle diverse programs, have multiple beneficiary groups, and lack clear partisan signals. In such contexts, self-interest and partisan cues are less reliable guides, creating a space for people to fall back on broad, socially resonant heuristics like the “average American.” In contrast, policies with high levels of salience and polarized debates (e.g., immigration reform) should offer people clearer cues regarding partisanship. Similarly, when benefits are highly transparent and clear (e.g., Social Security, veterans’ benefits), self-interest reasoning should be more plausible. The average-person heuristic operates in contexts marked by complexity and diffuse benefits, where citizens face the greatest uncertainty over the implications of public policies.
This paper is among the first to examine people’s support for omnibus legislation, addressing a policy domain, especially in public opinion scholarship, that has received little attention (Bar-Siman-Tov Reference Bar-Siman-Tov and Bar-Siman-Tov2021). It advances a novel theoretical contribution by identifying a group-based heuristic, the “average American,” that voters use to evaluate complex legislation. Despite its ubiquity in American politics, the political importance of the “average American” has yet to be theorized or empirically tested as a group that shapes policy support. The findings likely extend beyond the United States as both omnibus policies (Massicotte Reference Massicotte and Bar-Siman-Tov2021; Meßerschmidt, Reference Meßerschmidt and Bar-Siman-Tov2021; Oliver-Lalana Reference Oliver-Lalana and Bar-Siman-Tov2021) and political discourse invoking the average person (Dawkins and Hanson Reference Dawkins and Hanson2024) are common across many countries.
The results presented here indicate that policy benefits for broader groups, rather than targeted beneficiaries, explain trends in public support for the Farm Bill, meaning that diffuse understanding of policies (i.e., it is good for most) may be more relevant for public opinion than precise policy knowledge. Our results may also help explain the durable political support for complex omnibus policy, suggesting that the Farm Bill has enjoyed sustained support not because people understand the intricacies of the policy, but because they associate it with helping “people like us” or offering benefits to most Americans.
Results also point to the importance of symbolic politics and related group identities (Schildkraut Reference Schildkraut2007, Reference Schildkraut2014, Reference Schildkraut, Schwartz, Luyckx and Vignoles2011). The “average American” is not a specified, technical category but functions as a symbolic group, like the “working class” or “middle-class.” Especially in times of political polarization, such symbolic cues may be increasingly consequential for voters (Lamont et al. Reference Lamont, Park and Ayala-Hurtado2017; Loy and Wetts Reference Loy and Wetts2026; Robison et al. Reference Robison, Stubager, Thau and Tilley2021; Thau Reference Thau2021). Likewise, the ideas and sentiments that underscore superordinate identities such as “American” continue to shift and remain politically contested (Citrin et al. Reference Citrin, Wong, Duff, Ashmore, Jussim and Wilder2001; Dawkins and Hanson Reference Dawkins and Hanson2024). This means that symbolic and overarching groups like the “average American” serve as a rhetorical tool and may be reframed to fit competing political agendas. Does the invocation by politicians of belonging to the average group improve social trust (Levendusky Reference Levendusky2018) or exclude out-group members, reducing sentiments of collectivity (Devos and Banaji Reference Devos and Banaji2005; Kuo et al. Reference Kuo, Malhotra and Mo2017)? Further questions remain about what the “average American” actually means to voters and how this might differ by partisan affiliation. The ways in which policymakers use the average-person heuristic as a framing device and voters react to it, remain important avenues for future research.
Supplementary material
The supplementary material for this article can be found at https://doi.org/10.1017/S0143814X26101263.
Data availability statement
Replication materials are available in the Journal of Public Policy Dataverse at https://doi.org/10.7910/DVN/C2MAMT.
Acknowledgments
The authors would like to thank the Dean of the Faculty of Arts and Sciences at Harvard University for its support and The Politics of Inequality Cluster community at the University of Konstanz for helpful feedback, especially Nils Röper, Thomas Kurer, and Kris-Stella Trump.
Funding statement
This research was supported by the National Science Foundation (grant #1430505 in 2014 and grant #2148907 in 2022). This project was also funded by the Deutsche Forschungsgemeinschaft (DFG – German Research Foundation) under Germany’s Excellence Strategy -EXC-2035/1 – 390681379.
Competing interests
The author(s) declare no competing interests.



 Open access

