Since the 1960s, scholars have studied the rising price and escalating cost of higher education. These two concepts must be carefully distinguished. Price is what students and their parents pay. Cost, sometimes called the production cost, is what colleges and universities spend to produce the education (Baum et al. Reference Baum, Kurose and McPherson2013: 30; Bowen Reference Bowen2012: 3; Toutkoushian Reference Toutkoushian, Paulsen and Smart2001: 11n). Ambiguity arises because “price” may be interpreted as “the cost to students,” and the ambiguity often appears even in the scholarly literature. But the distinction is critical in higher education, where price is not set by adding “a markup over cost.”Footnote 1 In the preponderant, nonprofit sector of higher education, prices are almost always below cost, and do not correspond to the production cost in any direct way. In public institutions, the prices are politically determined, and in the private sector, pricing is skewed by subsidies from gifts and endowment income and by financial aid policies and tuition discounting (Breneman Reference Breneman2001: 16–17; Winston Reference Winston2001). This article addresses cost in the productive sense generally employed by economists: the expense incurred to provide higher education.
Cost escalation means that the expense of higher education is growing faster than the cost of living or the national income. When cost escalates, higher education consumes an increasing fraction of national income, and this trend becomes a serious problem over time, as with health care. After all, “if we extrapolated current trends [in cost] sufficiently far unto the future, the entire GNP would be devoted to higher education” (Jencks and Riesman Reference Jencks and Riesman1968: 111n). Cost escalation may be justified, even salutary, if the population of students is expanding. But the trend becomes particularly worrisome if the per student cost increases. This might be explained by improving quality of education, by need for more remediation of entering students, or by increasing cost of inputs (goods and services) to get the same output from a college or university (Smith Reference Smith2000: 32–42). But the trend is generally taken to mean that higher education is becoming inefficient and consuming national income at a faster rate than the number of students is growing. Consequently, scholars have long studied “the seemingly inexorable tendency for institutional cost per student . . . to rise faster than costs in general over the long term” (Bowen Reference Bowen2012: 3).Footnote 2
Among the explanations for cost escalation proposed over the last 50 years, two economic theories predominate (Archibald and Feldman Reference Archibald and Feldman2008; Breneman Reference Breneman1996: 96; Reference Breneman2001: 14; Clotfelter Reference Clotfelter1996: 34–35; Frank Reference Frank2012; Geiger Reference Geiger2004: 275n3; Johnstone Reference Johnstone and Altbach2005: 391n14; Lasher and Greene Reference Lasher, Greene, Paulsen and Smart2001: 512; Olson Reference Olson1997: 229; O'Neill Reference O'Neill1971: 49). In 1980, economist Howard Bowen studied the period 1930–78 and proposed the “revenue theory of cost.” Many scholars and leaders of higher education, including some economists, subsequently embraced this view. But many distinguished economists have endorsed the “cost disease” theory, advanced in 1968 by William Bowen to explain cost escalation in higher education between 1905 and 1966 (Bowen Reference Bowen1968; Bowen Reference Bowen1980).Footnote 3
Economists’ preference for the latter theory rests on what might be called its technical character. While revenue theory is said to be circular and specific to higher education, cost disease theory addresses a large sector of the economy and predicts certain economic outcomes. This makes cost disease theory more susceptible to empirical testing and validation, although both explanations for cost escalation in higher education are difficult to test (Archibald and Feldman Reference Archibald and Feldman2008: 269; Breneman Reference Breneman1996: 60).
Yet, that technical character also generates problems for cost disease theory. Focused on mathematical analysis of quantitative data drawn from large data sets, the economic studies of cost disease in higher education have tended to overlook the technical problems of historical method in drawing data from historical sources and then reasoning from that. Further, some of the leading economic studies make unjustified conclusions about testing and validating the theory. Finally, the succession of such studies, invoking their predecessors over the past 50 years, has built up sediments in the literature that obscure the problems of historical method.
This article examines three historical dimensions of cost disease theory in higher education from the 1870s to the 2010s. First, we explain the historiography of cost disease theory, that is, how the scholarship on the cost disease in higher education developed over the past 50 years. Second, we concurrently analyze the historical data and the reasoning of economists on behalf of their conclusions. Our intent is not to attack or impugn distinguished economists, who have contributed so much to understanding about costs trends, or to challenge the value of statistical techniques. The aim here is to examine carefully the inferences between the questions asked, the data, the findings, and the stated conclusions. Our analysis concludes that the economic literature over the last 50 years provides little validation for the cost disease theory as an explanation for cost trends in higher education during the twentieth century.
Finally, given the unsuccessful attempts at validation, we present historical research on the cost trends in US higher education from 1875 to 1930. We do so because this was both the formative period in American higher education and the period of greatest growth in the national economy and productivity. Due to the growth in productivity, cost disease theory would predict that the cost of higher education, a services industry, would rise sharply relative to costs generally and to the national income.
In aggregate terms, the annual operating income of higher education and the total capital invested in it did, indeed, rise much faster than the gross national product (GNP) over the entire period. This increase is remarkable given that US economic growth was “unique in human history” during this period (Gordon Reference Gordon2016: 285). The aggregate cost of the expanding higher education rose much faster than national income, which grew feverishly. The nation made a stupendous aggregate investment in higher education between 1875 and 1930.
But the story is quite different in per capita terms. The research reveals that the per capita cost of higher education grew very slowly over this period, scarcely faster than the price of all commodities, and much more slowly than per capita income. Higher education became slightly more expensive in absolute terms, but scarcely more so than commodity prices, and became much cheaper compared to per capita income. This finding does not consist with the prediction of cost disease theory. This conclusion, combined with our analysis of cost disease scholarship, leads us to infer that there is little validation that cost disease theory explains cost escalation in US higher education from the 1870s to the 2010s.
Cost Escalation and Two Predominant Explanations
Studying historical cost trends and cost escalation in higher education is difficult for several reasons. First is the problem of defining and measuring cost. Colleges and universities conduct many auxiliary enterprises, including housing, food services, bookstores, and athletics. They also construct buildings and contract with outside agencies to receive or provide services, including sponsored research. Many universities own large medical centers, clinics, or hospitals. Economists customarily try to exclude all these costs in order to address “educational and general expenditures,” from which is deducted institutionally funded student aid or tuition discounts (Bowen Reference Bowen2012: 4; Clotfelter Reference Clotfelter1996: 51; Getz and Siegfried Reference Getz, Siegfried, Clotfelter, Ehrenberg, Getz and Siegfried1991: 286–87, 296; McPherson and Shapiro Reference McPherson and Shapiro2001: 75). Both William Bowen and Howard Bowen followed this approach in their landmark studies. But the overlapping categories and entwined data make higher education costs “notoriously hard to interpret” (Bowen Reference Bowen2012: 4; see Bowen Reference Bowen1968: 6–10; Bowen Reference Bowen1980: 6–10).
Difficulty also arises in the sources of the cost data. Many economic studies have taken 1929–30 as their starting point because, purportedly, “the earliest source of [federal] financial data is the Biennial Survey of Education in the United States,” which “first started in 1929–30, and was conducted every other year through 1963–64” (Toutkoushian Reference Toutkoushian, Paulsen and Smart2001: 16; see Bowen Reference Bowen1980: 39n, table 40; Getz and Siegfried Reference Getz, Siegfried, Clotfelter, Ehrenberg, Getz and Siegfried1991: 359; Halstead Reference Halstead1975; Jencks and Riesman Reference Jencks and Riesman1968: 111n; O'Neill Reference O'Neill1971; To Reference To1987). However, the US Commissioner of Education began publishing extensive annual reports on higher education in 1868. Economists studying cost trends have rarely consulted these reports prior to 1930 and cursorily when they have.
One reason for the neglect may be that decennial financial data for higher education between 1889 and 1930 is readily available both in Historical Statistics of the United States, published by Cambridge University Press, and in the Digest of Educational Statistics produced by the National Center for Education Statistics (NCES). These sources draw their pre-1930 data from the “statistical portrait” of American education edited by Thomas Snyder in 1993 for NCES. All these compilations evidence their data by citing generally annual reports and biennial surveys of the US Commissioner of Education. But these government documents prior to 1930 are voluminous and, by their own admission, present incomplete data that varies internally and from year to year. Also, the figures in these compilations do not, in fact, match the summary data in the reports (Kimball and Luke Reference Kimball and Luke2016. See Goldin Reference Goldin and Carter2006a, Reference Goldin and Carter2006b; National Center of Educational Statistics 1996, 1999; Snyder Reference Snyder1993: 89, 92).
Another difficulty is that the cost trends of the public and private sectors of higher education have often differed over time. For example, public institutions generally fared better during the 1930s, due to an influx of students into low-cost, local colleges and universities. But they fared worse during the 1940s, due to wartime inflation. Later, over the decade from 1985–86 to 1995–96, per student educational expenditures rose 22 percent in public higher education and 9 percent in the private sector (Breneman Reference Breneman2001: 16; McPherson and Shapiro Reference McPherson and Shapiro2001: 75; Millett Reference Millett1952: 116). Finally, one more difficulty in explaining historical cost trends is that the shaping forces are multiple and variable, including economic, political, and social factors, as well as academic developments and public policies.
Given these difficulties, the basic historical narrative of cost escalation since 1930 becomes complicated. During the 1930s and 1940s, the per student educational expenditure in constant dollars decreased annually by 0.4 percent on average due to the Depression, though spiking upward during World War II as a result of falling enrollments. During the economic expansion of the 1950s and 1960s, that expenditure escalated significantly, increasing annually on average by 3.21 percent. Hence, it was in the late 1960s that the “crisis in college finance” began to be “much discussed” (Jencks and Riesman Reference Jencks and Riesman1968: 111n; see Bowen Reference Bowen1968: 68; Bowen Reference Bowen1980: 38; O'Neill Reference O'Neill1971). During the period of largely stagnant growth and inflation from 1970 to 1982, the per student expenditure rate declined slightly. Then between 1982 and 1995, significant cost escalation resumed, and the question of the 1960s therefore returned at the end of the twentieth century: Why does the cost of higher education keep rising so fast (Archibald and Feldman Reference Archibald and Feldman2008: 277–79; Bowen Reference Bowen1980: 38, 46; Geiger Reference Geiger2004: 23, 50; Getz and Siegfried Reference Getz, Siegfried, Clotfelter, Ehrenberg, Getz and Siegfried1991: 300; Olson Reference Olson1997: 228–30)?
Economists have considered various models to explain the phenomenon, particularly the theory of the firm, as well as “human capital theory, labor market theory, price theory, and theories of production and costs” (Paulsen Reference Paulsen, Paulsen and Smart2001: 193. See Massy Reference Massy2003: 30; Toutkoushian Reference Toutkoushian, Paulsen and Smart2001: 13–15; Winston Reference Winston1998, Reference Winston2001). In addition, scholars have identified various adventitious contributing factors, such as increases in federal regulation (Clotfelter Reference Clotfelter1996; Ehrenberg Reference Ehrenberg2000: 14–16; Getz and Siegfried Reference Getz, Siegfried, Clotfelter, Ehrenberg, Getz and Siegfried1991; Leslie and Rhoades Reference Leslie and Rhoades1995; Massy Reference Massy1991a, Reference Massy1991b; Olson Reference Olson1997: 216). It is widely agreed that “the issue is complex, and no single explanatory hypothesis can . . . account for a set of problems whose roots are undoubtedly sociological and psychological as well as economic” (Baumol Reference Baumol1993: 622. See Baumol and Blackman Reference Baumol and Blackman1995: 2; Bowen Reference Bowen2012: 7–10; Getz and Siegfried Reference Getz, Siegfried, Clotfelter, Ehrenberg, Getz and Siegfried1991). Nevertheless, among the explanations for cost escalation proposed over the last 50 years, two economic theories predominate.
In 1980, economist Howard Bowen, who served successively as president of Grinnell College, University of Iowa, and Claremont Graduate University, proposed the “revenue theory of cost” to explain cost escalation across higher education between 1930 and 1978. This theory holds that “costs of operating colleges or universities are set more largely by the amount of money institutions are able to raise . . . than by the inherent technical requirements of conducting their work” (Bowen Reference Bowen1980: 15). Howard Bowen's work rapidly became “the conventional wisdom” and “classic book on the costs of higher education” for many scholars and leaders of higher education, including some economists (Brinkman Reference Brinkman, Hoenack and Collins1990: 109; see Clotfelter Reference Clotfelter1996: 34; Geiger Reference Geiger2004: 59, 278n7; Lasher and Greene Reference Lasher, Greene, Paulsen and Smart2001: 511; Lewis and Dundar Reference Lewis, Dundar, Paulsen and Smart2001: 137–38; Massy Reference Massy2003: 39–47, 307; Paulsen Reference Paulsen, Paulsen and Smart2001: 193; Thelin and Trollinger Reference Thelin and Trollinger2014: 97; Toutkoushian Reference Toutkoushian, Paulsen and Smart2001: 13–15; van Vught Reference van Vught2008: 169). But many economists have argued that this theory is circular or tautological or inverts cause and effect. Also, it is said that “Bowen did not properly specify an objective function that guides university behavior,” and the absence of such a function “renders his theory difficult to frame as a testable hypothesis” (Archibald and Feldman Reference Archibald and Feldman2008: 281. See Bowen Reference Bowen1980: 19; Massy Reference Massy2003: 40; Toutkoushian Reference Toutkoushian, Paulsen and Smart2001: 14–15).
Hence, many highly respected economists have preferred a different theory. In 1966, two economists at Princeton University, William Baumol and William Bowen, developed the “cost disease” theory to explain cost escalation in the performing arts industry. In 1968 William Bowen, who later became president of Princeton University and then the Mellon Foundation, applied the cost disease theory to explain cost escalation in major private research universities between 1905 and 1966. Subsequently, Bowen, Baumol, and other distinguished economists repeatedly endorsed that explanation for most, or much, of the cost escalation in higher education (Alsalam Reference Alsalam1995; Archibald and Feldman Reference Archibald and Feldman2008: 268–95; Baumol Reference Baumol1993, Reference Baumol2012: xix, 3; Baumol and Blackman Reference Baumol and Blackman1995; Baumol and Bowen Reference Baumol and Bowen1966; Bowen Reference Bowen2012: 3; Ehrenberg Reference Ehrenberg2000: 5–6; Frank Reference Frank2012; O'Neill Reference O'Neill1971: 53; Swensen Reference Swensen2009: 34–35). Forms of these two theories are sometimes identified under different names or without citing either Bowen, but throughout the literature these two predominate (Archibald and Feldman Reference Archibald and Feldman2008; Breneman Reference Breneman1996, Reference Breneman2001: 14; Clotfelter Reference Clotfelter1996: 34–35; Frank Reference Frank2012; Geiger Reference Geiger2004: 275n3; Johnstone Reference Johnstone and Altbach2005: 391n14; Lasher and Greene Reference Lasher, Greene, Paulsen and Smart2001: 512; Olson Reference Olson1997: 229; O'Neill Reference O'Neill1971: 49).
Cost Disease Theory
Cost disease theory begins with a fundamental distinction between manufacturing or goods-producing industries and personal services industries. “In some cases labor is primarily an instrument . . . for the attainment of the product, while in other fields . . . the labor is itself the end product,” in the words of Baumol, the senior collaborator of William Bowen and the economist most widely associated with the general theory (Baumol Reference Baumol1967: 416). In addition to treating labor as the end, rather than the means, of production, personal services include a “handicraft—or in-person—attribute” (Baumol Reference Baumol2012: 22. See Baumol and Blackman Reference Baumol and Blackman1995: 3). Defined by these two attributes, personal services industries include “most notably, health care, education, legal services, welfare programs for the poor, police protection, sanitation services, repair services, the performing arts, restaurant services, and a number of others” (Baumol Reference Baumol1993: 624).
That fundamental distinction has important implications for economic productivity, according to the theory. Over time, goods-producing industries have increased their productivity, or output per labor hour, due to labor-saving technology introduced especially during the Industrial Revolution. It took fewer people and fewer hours to dig by steam shovel than by hand, for example, so construction became cheaper. But the personal services industries are “stagnant” because they cannot increase their productivity in this way. A service provider today must spend the same amount of time with those served as in the past. “It still takes four musicians nine minutes to perform Beethoven's String Quartet in C minor, as it did in the nineteenth century” (Frank Reference Frank2012; see Baumol Reference Baumol2012: xvii). Further, because compensation in the service industries must keep pace with that in the goods-producing sector, the “costs in the personal services industries move ever upward at a much faster rate than the rate of inflation” and the prices of goods in the economy (Baumol Reference Baumol2012: xvii–xviii). The cost of a live concert becomes ever more expensive relative to a loaf of bread.
“The central point . . . is that for an activity . . . where productivity is stationary, every increase in money wages will be translated automatically into an equivalent increase in unit labor costs . . . [because] there is no offsetting increase in output per man-hour as there is in a rising productivity industry,” as Baumol and William Bowen stated in their pathbreaking 1966 study explaining rising costs in performing arts (171). As a result, services industries are “stagnant” in terms of productivity, and their cost grows much faster than in other kinds of industries (Baumol Reference Baumol1993: 624; Baumol and Blackman Reference Baumol and Blackman1995: 3). Many economists subsequently named the theory “Baumol's disease,” a term that he embraced while affirming that the theory originated with William Bowen as well as himself (Alsalam Reference Alsalam1995: 19n11; Baumol Reference Baumol2012: xii, 3, 112; Frank Reference Frank2012; Gordon Reference Gordon2016, 13: 190; Triplett and Bosworth Reference Triplett and Bosworth2003).
It was William Bowen who famously applied cost disease theory to higher education in a study published by the Carnegie Commission on Higher Education in 1968. His work “documented the seemingly inexorable tendency for institutional cost per student . . . to rise faster than costs in general over the long term” (3). He maintained, “[I]f the salary of the typical faculty member does increase at an annual rate of 4 percent, so that his living standard improves along with the living standard of the auto maker, but if output per man-hour in the education industry remains constant, it follows that the labor cost per unit of educational output must also rise 4 percent per year. And there is nothing in the nature of this situation to prevent educational cost per unit of product from rising indefinitely at a compound rate of this sort” (1968: 15; emphasis in original). Though he studied only “major private research universities,” William Bowen inferred that “much of the analysis” applies “to public as well as private institutions, and to colleges as well as universities” (1968: 1). In subsequent decades, Bowen was the scholar primarily associated with cost disease theory in higher education, although Baumol endorsed the view as well and other economists credited either or both of them (Baumol Reference Baumol2012; Baumol and Blackman Reference Baumol and Blackman1995; Bowen Reference Bowen2012. See Alsalam Reference Alsalam1995: 14; Archibald and Feldman Reference Archibald and Feldman2008; Baum et al. Reference Baum, Kurose and McPherson2013: 32–33; Ehrenberg Reference Ehrenberg2000: 5–6; Frank Reference Frank2012; Getz and Siegfried Reference Getz, Siegfried, Clotfelter, Ehrenberg, Getz and Siegfried1991: 263–67; Massy Reference Massy1989, Reference Massy1991a, Reference Massy1991b; O'Neill Reference O'Neill1971: 53; Swensen Reference Swensen2009: 34–35).
Meanwhile, Baumol emphasized that the cost disease plagued all personal-services industries. He also addressed the discomfiting projection of cost disease theory that personal services will consume an ever-increasing fraction of the gross domestic product (GDP) per capita. He projected that health-care costs, alone, will rise from 15 percent of the average person's total income in 2005 to 62 percent in 2105 (Baumol Reference Baumol2012: xviii, 22; Baumol and Blackman Reference Baumol and Blackman1995: 2, 6. See Baumol and Blackman Reference Baumol and Blackman1983: 182–83; Baumol and Marcus Reference Baumol and Marcus1973: 52–54). But this outcome will not be detrimental, according to Baumol, because the economic pie will grow more rapidly due to productivity gains in the manufacturing sector of the economy. As a result, he expects that the absolute amount of non-health-care GDP in 2105 will exceed that in 2005 even though the fraction of non-health-care GDP in 2105 will be smaller than that in 2005. The same optimistic analysis applies to the higher education slice of GDP (Baumol Reference Baumol2012: 43–58; Baumol and Blackman Reference Baumol and Blackman1995: 6; Massy Reference Massy2003: 140).
In the five decades since the seminal works on cost disease theory appeared in the late 1960s, studies have affirmed the validity of the theory. The succession of these studies, invoking their predecessors, conferred great authority on the theory. In 1993, Baumol wrote, “[I]t is almost a quarter century since William Bowen and I . . . first reported our analysis of what is now called ‘the cost disease of the personal services’. . . . I remind the reader of this not to gloat over the accuracy of our depiction of the future (though I cannot deny that it is a source of some uneasy satisfaction)” (623–24). Two decades later, Baumol stated that their predictions “for the future costs of health-care and other labor-intensive services were fully borne out.” In fact, “[I]n the half century since our analysis first emerged, our predictions have achieved what is surely a special status: they may well be the longest valid forecast ever to emerge from economic analysis” (Baumol Reference Baumol2012: xix).
William Bowen was less effusive, but endorsed the authority of his 1968 study, which concluded that the cost disease beset “major private research universities” (MPRUs) from 1905 to 1966 (Bowen Reference Bowen1968: 14–16). During the next 50 years, scholars repeatedly invoked the cost disease when discussing cost escalation in higher education (Archibald and Feldman Reference Archibald and Feldman2008: 268–95; Ehrenberg Reference Ehrenberg2000: 5–6; Geiger Reference Geiger1993: 243; Reference Geiger2004: 56–57; Getz and Siegfried Reference Getz, Siegfried, Clotfelter, Ehrenberg, Getz and Siegfried1991: 261, 300; O'Neill Reference O'Neill1971: 53). In 2012, lecturing at Stanford University, Bowen maintained that his 1968 study remained conclusive. Hence, “there is no need to burden this talk with more data about trends in institutional costs” (Bowen Reference Bowen2012: 4). Further, he stated that “the underlying pattern . . . has been found to hold for public as well as private universities, and for colleges too,” although he did not cite any studies in support (ibid.: 3).
The affirmations of validity are particularly important because cost disease theory is exculpatory. Personal-service industries cannot help themselves, according to the theory. Their lower productivity and growing relative consumption of national income stem from an intrinsic technical aspect of their nature. “Though it is always tempting to seek some villain to explain such cumulative cost increases, there is no guilty party here . . . the cost increases are not caused by criminal neglect, incompetence, or greed, but rather . . . the essentially irreducible quantity of labor entailed,” according to Baumol, Bowen, and others (Archibald and Feldman Reference Archibald and Feldman2010b; Baumol Reference Baumol1993: 623, 626–27; Reference Baumol2012: 26, 92; Baumol and Blackman Reference Baumol and Blackman1995: 4; Baumol and Bowen Reference Baumol and Bowen1966: 162–65; Bowen Reference Bowen2012; Breneman Reference Breneman2001: 14; Johnstone Reference Johnstone2001: 29; O'Neill Reference O'Neill1971: 52–53). This exculpation magnifies the obligation to scrutinize the efforts to validate this explanation.
Validation Efforts and Their Problems, 1968–2012
The logic of cost disease theory implies certain basic steps in testing it. First, identify an industry that fits the personal services attributes. Then, show that the industry is “stagnant,” meaning that its cost grows much faster than the cost of goods-producing industries or the national income (Baumol Reference Baumol1993: 624; Baumol and Blackman Reference Baumol and Blackman1995: 3–5). Next, demonstrate that compensation in this industry rises faster than its overall cost. Finally, show that compensation predominates in the total cost of the industry.
In their compelling study of performing arts in 1966, Baumol and Bowen completed these steps. But subsequent notable attempts to validate cost disease theory, particularly in higher education, fell short, despite affirmations of success. The repetition of such affirmations in the cost disease literature over nearly 50 years has obscured four fundamental problems in the attempts at validation, while exaggerating the authority of the theory.
One problem is reductionism. Both Baumol and Bowen narrow the issue to fit their explanation and data. Baumol does so by rejecting quality-adjusted measures of cost. He maintains that personal services industries do not increase their productivity even given technological advances, including computing. In response, scholars have argued that technology, particularly information technology, has improved services. For example, even if professors still have 25 students in a classroom, as they did a century ago, the quality of instruction is enhanced in many ways by digital resources and communications. Similarly, medical diagnosis is improved by new electronic medical records systems, which increase the quality and quantity of information that physicians have available. This increased quality amounts to increased productivity, which could account for rising costs without positing a cost disease (Jones Reference Jones, Heaton, Rudin and Schneider2012; Triplett and Bosworth Reference Triplett and Bosworth2003).
In rebuttal, Baumol dismisses quality. The only salient issue is “cost, not product quality,” he states, “cost disease analysis deals with the rising costs of some services and does not concern itself with evolution of the benefits that those services provide” (Baumol Reference Baumol2012: 84). For example, Baumol and Blackman studied whether computerization alleviated the labor-intensive costs in the operation of libraries. They concluded that productivity did not increase faster than costs largely due to the increasing expense of software, thus confirming the cost disease theory. But they did not consider that patrons receive better services due to computerization, such as faster and broader access to materials among networked libraries (see Baumol and Blackman Reference Baumol and Blackman1983; Baumol and Marcus 1976). To the converse point that cost gains in the goods-producing sector do count better quality, as in automobiles, Baumol again sidesteps quality by maintaining that “monetary costs in manufacturing clearly are declining, no matter what output measure we use” (Baumol Reference Baumol2012: 92).
Dismissing quality-adjusted measures discounts productivity and thereby helps to validate the theory. But the dismissal means that the theory does not distinguish qualitatively between, for example, peritoneal dialysis, which is performed three or four times per day, and hemodialysis, which is performed three times weekly. Either procedure is still dialysis, according to the theory, and it is impossible to put a monetary value on qualitative improvements “despite their importance for the general welfare” (Baumol Reference Baumol2012: 91). Yet, this position saves the theory by neglecting a fundamental purpose of economic productivity—improving the quality of life—and thus by narrowing the question of economic productivity. In contrast, economic historian Robert Gordon argues forcefully that economic measures of the standard of living have erroneously overlooked qualitative improvement (Gordon Reference Gordon2016: 13, 323).Footnote 4
In regard to higher education, the reductionism problem appears in William Bowen's analysis. As discussed above, college and university costs “are notoriously hard to interpret . . . because they often involve aggregations of various kinds” (Bowen Reference Bowen2012: 4). Given these aggregations, economists focus upon “educational and general expenditures,” which Howard Bowen computed to be 59 percent of aggregate institution expenses (Bowen Reference Bowen1980: 6–10. See Clotfelter Reference Clotfelter1996: 51; Getz and Siegfried Reference Getz, Siegfried, Clotfelter, Ehrenberg, Getz and Siegfried1991: 286–87; McPherson and Shapiro Reference McPherson and Shapiro2001: 75). William Bowen's definition of higher education costs appears to be narrower than the conventional measures of “educational and general expenditures.” Without specifying the categories, he apparently excludes certain overhead costs in order to analyze “direct expenditures on instruction and departmental research.” These direct expenditures consist “mainly of faculty salaries charged to the regular departmental budgets” (Bowen Reference Bowen1968: 6n. See Bowen Reference Bowen1968: 6–10, 17n, 32). Similarly, Baumol maintains that faculty salaries drive the costs in higher education (Baumol and Blackman Reference Baumol and Blackman1995: 4).
This focus on faculty salaries buttresses the cost disease theory by equating institutional cost with the personal services variable that the theory posits to explain institutional cost. The argument becomes circular. Hence, critics have argued that cost disease theory “can account for only a small fraction of the current increases in higher education” and “that the rest of an institution's costs are subject to normal productivity gains” (Archibald and Feldman Reference Archibald and Feldman2008: 276–77. See Geiger Reference Geiger2004: 59; Massy Reference Massy2003: 39–40; Olson Reference Olson1997). Indeed, economist Gordon Winston has proposed that higher education costs should be figured more capaciously than the conventional “educational and general expenditures” (Winston Reference Winston1998; Reference Winston2001: 125).
Apart from reductionism, a second problem in efforts to validate cost disease theory concerns the use of historical data. This problem arose particularly in William Bowen's canonical study of 1968, which followed the first two steps to test and validate the theory in higher education. Only recently have scholars scrutinized Bowen's method, which is described piecemeal at different points in his monograph (Kimball and Luke Reference Kimball and Luke2016).
To address the period 1905–66, Bowen begins with the decade 1955–66. Drawing on surveys and data sets of the US Office of Education, he compiles “direct expenditures on instruction and departmental research,” accounts for inflation by converting nominal dollars to constant dollars, and then computes the cost per student after 1955. Bowen next attempts to extend “the Historical Record of Cost per Student” for MPRUs from 1955 back to 1905 (Bowen Reference Bowen1968: 5, 16–21).
This extension begins by identifying three “representative” MPRUs—Chicago, Princeton, and Vanderbilt universities—and validating that set as “typical” for all MPRUs during the period 1955–66. Bowen then indexes the direct cost per student of each of the three universities to a standard base of 1904–5. He next averages those institutional indexes to calculate an “overall index” of the direct cost per student in constant dollars of Chicago, Princeton, and Vanderbilt extending back to 1905. This approach gives each university equal weight in determining the overall index of the three institutions, despite their different size and absolute costs. He then plots and compares the “Chicago-Princeton-Vanderbilt Average Direct Costs per Student” and an “Economy-Wide Cost Index” (ibid.: 2, 7–10, 16–21, 63–4).
Bowen concludes that, cumulatively, “between 1905 and 1966, our index of educational cost per student increased 20-fold, whereas our economy-wide cost index increased between 3- and 4-fold.” The compound annual growth rate (CAGR) over that period in “Direct Costs per Student at Chicago-Princeton-Vanderbilt” was 5.2 percent, whereas the “Economy-wide Cost Index” grew at the rate of 2.1 percent. Therefore, significant cost escalation in higher education occurred in the representative set of MPRUs between 1905 and 1966 (ibid.: 17–19, 63–64).
This extension of the historical record back to 1905 is seriously flawed, however. First, the institutions were not typical. After showing that Princeton, Vanderbilt, and Chicago were “representative” universities in the period 1955–65, Bowen assumes that they were “typical” during the prior 50 years (ibid.: 2, 9–17). But Princeton and Vanderbilt differed significantly from MPRUs prior to 1945. Princeton emphasized collegiate norms prior to 1945, and Vanderbilt did not emphasize research and graduate education. The Association of American Universities did not admit Vanderbilt until 1950, and the leading history of research universities between 1900 and 1940 does not include Vanderbilt in its analysis (Geiger Reference Geiger1986: 200–3). Only Chicago was representative of MPRUs prior to 1945. Second, Bowen's only data for his starting point of 1905 comes from Princeton, while his data for Vanderbilt begin in 1910 and for Chicago in 1948. The two unrepresentative universities supply all the data prior to 1948 (Bowen Reference Bowen1968: 2, 17n, 64).Footnote 5
Bowen's attempt to compensate for these lacunae lead to the third and most significant error. He sets the later averaged indexes equal to that of the earlier institutions. The “Chicago-Princeton-Vanderbilt Average Direct Costs per Student” therefore counts data only from Princeton for the period 1905–10 and only from the average of Princeton and Vanderbilt for 1910–48. To incorporate the Chicago data, Bowen sets “the value of the Chicago index [of cost per student] in 1948–49 . . . equal to the average of the Princeton-Vanderbilt indexes in that year.” This approach assumes that the growth rate of Chicago prior to 1948 equaled the average of Princeton and Vanderbilt prior to 1948 and that the growth rate of Chicago and Vanderbilt equaled Princeton's prior to 1910. But the assumed average of the “representative” three is precisely what the study tries to determine. Hence, Bowen does not compute, but presupposes his result: the value of the “Chicago-Princeton-Vanderbilt Average Direct Costs per Student” (ibid.: 17n, 18, 63–64).
These errors of unrepresentative institutions, missing data, and presuming values to fill significant gaps are serious, notwithstanding that William Bowen's study generally follows the first two necessary steps to test and validate. If not for flaws in handling historical data, his effort would have been sound, apart from the reductionism problem.
Subsequent efforts to test and validate cost disease theory in higher education manifest two more fundamental problems. The third occurs when studies implicitly or explicitly define all service industries as stagnant industries, and all stagnant industries as service industries. This a priori premise bypasses the steps of identifying service industries and showing that they are stagnant. The fourth arises when studies neglect the issue of compensation, thereby ignoring the fundamental causal mechanism posited by cost disease theory. These third and fourth problems generally appear in economic studies drawing on large data sets. The basic reasoning in these studies, though involving complex equations and computations, amounts to defining service industries as stagnant a priori, identifying stagnant industries, calling them service industries, and concluding that the cost disease theory is valid.
Both problems appear in Baumol's primary study of higher education, which addressed the period 1949–91 and drew on an earlier study of the costs of schooling and health care. This discussion addresses both articles. The opening lines of the brief essay on higher education discuss “cost disease” and cost escalation interchangeably, essentially equating the two and assuming that the theory explains the latter. He also states, without evidence here or elsewhere, that the nine or ten exemplary personal service industries are all “stagnant services” (Baumol Reference Baumol1993: 624; Baumol and Blackman Reference Baumol and Blackman1995: 1, 3). Both moves amount to defining personal service industries as stagnant industries rather than demonstrating that they are stagnant by reference to cost data.
Baumol then identifies other stagnant industries, such as automobile repair and maintenance, and “insurance carriers and insurance agents.” He maintains that all these stagnant industries “are precisely those that the cost disease analysis would lead us to expect to behave in this manner,” meaning that they are also personal service industries. Here he reasons in the opposite direction. He begins with stagnant industries, names them personal service industries, calibrates their degree of personal service by reference to their cost growth, and finally concludes that cost disease theory is demonstrated (Baumol Reference Baumol1993: 624, 627–30; Baumol and Blackman Reference Baumol and Blackman1995: 3). But this calibrating is ex post facto and case by case. No guidelines are presented to define and measure personal service, apart from their degree of economic stagnation. This circular argument evinces the third problem. Industries are not identified by their personal service attributes, and then tested for stagnant growth.
This circularity is demonstrated by a shift in describing the theory's fundamental distinction. In 1967, Baumol founded the theory by distinguishing between the role of labor in goods-producing industries and personal services industries. In 1993, he presented a different founding distinction: “Let us imagine an economy divided into two sectors: one, the progressive sector, in which productivity is rising, and another, the stagnant sector, in which productivity is constant. Suppose the first economic sector produces automobiles, and the second, performances of Mozart quartets.” Here the starting point is the distinction between “progressive” and “stagnant” industries. Baumol did not acknowledge this shift and continued to write ambiguously as though the role of labor in personal services were the defining factor (Baumol Reference Baumol1967: 416; Reference Baumol1993: 625. See Baumol Reference Baumol2012). The circularity is also shown by the fact that Baumol never examines or identifies an exception: a stagnant industry that is not a personal services industry. Doing so would greatly strengthen the argument.
The fourth problem of ignoring the fundamental causal mechanism posited by cost disease theory also appears in Baumol's article on higher education. He states that faculty salaries drive the cost of higher education without providing evidence that salaries have risen faster than overall institutional expense or that they predominate in that expense (Baumol and Blackman Reference Baumol and Blackman1995: 4). Overall, Baumol's two articles on education take for granted the cost disease theory, presenting language, charts, and figures as though they were proving the theory.
Two Prominent Attempts at Validation, 2008
Apart from Baumol and Bowen, the two most prominent efforts to test cost disease theory in relation to higher education appeared in 2008: one by Robert Archibald and David Feldman, the other by William Nordhaus. According to Baumol in 2012, the latter study demonstrated that the predictions of himself and William Bowen “for the future costs of . . . labor-intensive services were fully borne out.” Indeed, this study proved that “our predictions . . . may well be the longest valid forecast ever to emerge from economic analysis” (Baumol Reference Baumol2012: xix).
But Nordhaus's macroeconomic study of aggregate financial data from 67 different industries over the period 1948–2001 addresses primarily not the cost disease, but “Baumol's growth disease.” This is a pessimistic corollary of cost disease theory that many economists have studied since the mid-1960s. The corollary holds that “stagnant” industries (having less productivity growth than other industries) detract from the overall productivity growth of the economy. Nordhaus proves this corollary, although Baumol and Bowen have never subscribed to it. In fact, Baumol wrote to Nordhaus personally in 2004 to disavow this corollary, saying that he “views his disease as a cost disease, not a growth disease” (Nordhaus Reference Nordhaus2008: 18n9, 1–2, 17–20). Thus, Baumol paradoxically invokes the support of Nordhaus, who primarily validates a thesis that Baumol disavowed (Baumol Reference Baumol2012: xix).
Beyond that paradox, Baumol's attributing validation to Nordhaus's article entails the third and fourth problems. Nordhaus studies not personal service industries, but “stagnant industries” with low productivity growth for any reason. Indeed, Nordhaus virtually sets aside service industries. He addresses them only by observing that service industries belong to the group of “strange outliers” in the economic data whose outputs are difficult to measure. In fact, “this shortcoming is particularly serious in . . . health, education, and personal services, for which output measures are in reality measures of inputs” (Nordhaus Reference Nordhaus2008: 16, 21).
Consequently, Nordhaus effectively marginalizes the personal services industries, including higher education, addressed by cost disease theory. By invoking Nordhaus as validation, Baumol implicitly defines services industries as stagnant industries. Furthermore, Nordhaus does not examine the fundamental causal mechanism of cost disease theory because he does not address whether the cost of compensation in personal service industries rises faster than their overall cost or whether the cost of compensation predominates in their overall cost.
Finally, when Nordhaus attends briefly to Baumol's “cost disease,” he shifts from “cost” to “price” in his analysis. Nordhaus sees no problem in this shift whereby “price is assumed to be a markup over cost” (ibid.: 4, 21). But this assumption does not fit higher education, in which price is almost always below cost, as discussed at the outset. Contrary to Baumol's invocation, Nordhaus provides little or no support for cost disease theory as it applies to personal services generally or higher education particularly.
The third problem of circularity and the fourth problem of neglecting compensation also appear in the other prominent study published in 2008 claiming to validate cost disease theory. Economists Archibald and Feldman sought to test the two competing explanations for cost escalation in higher education: cost disease theory and Howard Bowen's revenue theory of cost. Although the article was summarized in Change magazine, incorporated into a book published by Oxford University Press, and cited about 40 times by 2012, neither Baumol nor Bowen took notice of it in their summative statements in 2012 (Archibald and Feldman Reference Archibald and Feldman2008: 268–69; Reference Archibald and Feldman2010a; Reference Archibald and Feldman2010b; Baumol Reference Baumol2012; Bowen Reference Bowen2012).
Archibald and Feldman base their test on the premise that revenue theory identifies explanatory factors unique to higher education, while cost disease theory explains all personal service industries, including higher education. From this presumed distinction, they infer that revenue theory predicts that costs in higher education “follow an idiosyncratic time path,” whereas, according to cost disease theory, these costs follow those of all service industries. They then test the two possibilities by comparing the cost trends in higher education from 1949 to 1995 to those in a broad range of 69 industries: 13 that produce durable goods, 17 nondurable goods, and 39 services (Archibald and Feldman Reference Archibald and Feldman2008: 270, 281).
They find that 20 industries followed closely “the behavior of costs per student in higher education” over the period. Of those, 18 were service industries. This strong correlation leads them “to reject the hypothesis that . . . costs in higher education” move “randomly” or idiosyncratically. Hence, they reject revenue theory because “higher education behaves much the same way as other personal service industries. . .. The data are clearly telling us that the cost disease phenomenon is the dominant reason that higher education costs have risen in such a sustained manner over the past 80 years” (ibid.: 283, 287).
One weakness in this analysis is that the data demonstrates correlations, not any causality or “dominant reason.” More significantly, Archibald and Feldman unjustifiably impute the premise of idiosyncrasy to revenue theory. Howard Bowen did not assert that revenue theory applies only to higher education or that no other industries follow its behavior. Perhaps, even probably, cost in health care is also driven by the availability of revenue. Nor did Howard Bowen state that the cost trends posited by revenue theory would be idiosyncratic, random, or independent of other economic trends (Bowen Reference Bowen1980).
An additional weakness is the fourth problem of ignoring the specific causality posited by cost disease theory. Archibald and Feldman cannot infer that cost disease is a “dominant reason” because, apart from passing references, they do not analyze its causal mechanism: that compensation in the service industries rises faster than their overall cost and that compensation predominates in their cost (Archibald and Feldman Reference Archibald and Feldman2008: 279).
Even more serious is the third problem of circularly identifying personal service industries. Their classification of goods-producing industries and service industries comes from the US Bureau of Economic Analysis (BEA). “As a result, the classification of some product categories may seem strange. For example, the product category gas is classified as a service because the final purchaser is paying for the service of having natural gas delivered to his or her home.” By the same token, “airline,” “railway,” and “electricity” are classified as service industries (ibid.: 281. See Bureau of Economic Analysis 2015).
Beyond being “strange,” these classifications do not fit the attributes of personal service posited by cost disease theory: that the labor is “the end product” or a “handicraft—or in-person” (Baumol Reference Baumol1967: 416; Reference Baumol2012: 22). These attributes do not apply to natural gas, airline, railway, and electricity industries. Confirming the point, Baumol's lists do not include such industries. Conversely, the BEA classifies certain industries (“purchased meals and beverages”) as goods producing that Baumol considers exemplary service industries (restaurant meals). In fact, by 2015 BEA reclassified “purchased meals and beverages” as a service industry (Archibald and Feldman Reference Archibald and Feldman2008: 284; Bureau of Economic Analysis 2015).
This inconsistency between the BEA classification and the cost disease attributes of personal service seriously weakens Archibald and Feldman's correlation between higher education and the 18 service industries. Those 18 include these nine: handling life insurance and pension plans, user-operated transportation, hospitals and nursing homes (apart from health-care professionals’ services), water and other sanitary services, mass transit systems, rent of tenant-occupied nonfarm dwellings, rent of owner-occupied nonfarm dwellings, other recreation, and hotels, motels, and dormitories (Archibald and Feldman Reference Archibald and Feldman2008: 284–85, 292). Most of these do not clearly meet the cost disease attributes of service, so the correlation between higher education and service industries is much weaker than Archibald and Feldman calculate.
In fact, Archibald and Feldman explicitly recognize the inconsistency between cost disease theory and the BEA classification of service industries underlying their test. They state that their “statistical test simply used the [BEA] distinction between goods and services,” although “the cost disease explanation is based on characteristics of personal services, not simply services.” Further, “[B]ecause there is no clear cut way to define the exact set of product categories with the desired characteristics, we cannot offer a statistical test” (ibid.: 283).Footnote 6
This statement concedes that their study finds a correlation between higher education and a somewhat idiosyncratic set of stagnant industries, many of which do not fit the cost disease definition of personal service industries. Contrary to the bold proclamation of what “the data are clearly telling us,” the reasoning here evinces the third problem of circularly defining personal service industries as stagnant industries. Their correlation is largely irrelevant to testing and validating cost disease theory in higher education.
Cost Trends during the Formative Period, 1875–1930
In sum, the cost disease literature over the past 50 years provides little validation that the theory explains cost escalation in higher education during the twentieth century, notwithstanding the repeated claims in the literature to test and prove the theory. To provide that validation, the best example to follow is William Bowen's 1968 study while avoiding the methodological flaws of that work. Our historical research on cost escalation in higher education between 1875 and 1930 has benefitted from Bowen's work, but arrived at a different and arresting conclusion. Our method and findings are described more fully elsewhere (Kimball and Luke Reference Kimball and Luke2016).
This research addresses the formative period in US higher education extending from 1875 to 1930. During this period, comprehending the Gilded Age and Progressive Era, full-fledged universities and junior colleges arose for the first time in the United States, fundamentally reshaping the mores and organization of higher education (Veysey Reference Veysey1965). Furthermore, during this formative period, the US economy expanded faster than in any other era due to immense productivity gains in manufacturing industries resulting from technological advances wrought by the Industrial Revolution. Given this development, cost disease theory would predict that “health care, education, and other important services” experienced rapidly “rising costs” due to their low productivity growth. Moreover, Baumol maintains that “historical evidence confirms the . . . remarkable persistence of this pattern of differences” through today (Baumol Reference Baumol2012: 5, 22. See Gordon Reference Gordon2016). However, our research on cost trends of US higher education during its formative period disprove both the prediction and the claim of historical confirmation.
Economists and historians have not computed reliable cost trends in US higher education prior to 1930. Doing so requires systematic and detailed consultation of the annual reports and biennial surveys of the US Commissioner of Education, the most informative and comprehensive source during the period. Instead, some scholars have drawn summary data from a few of these reports (Goldin and Katz Reference Goldin and Katz1998, Reference Goldin and Katz1999, Reference Goldin and Katz2008). But the summary data is unreliable because the reports count inconsistent and incomplete sets of institutions, so the summaries in any individual report are snapshots of an essentially arbitrary swath of higher education. Even in 1932, the US Commissioner report observed that the data were neither uniform nor complete (US Bureau of Education 1932, v. 2: 321, 528). Nevertheless, these massive and intricate reports can be highly informative, if the data are collected at the level of individual institutions and carefully interpreted (Kimball and Luke Reference Kimball and Luke2016).
To study the cost trends of higher education during its formative period 1870–1930, we therefore devised the following approach, comprising five basic steps. First, assessing and compiling a consistent set of financial data and enrollments for a cross-section of individual colleges and universities during the period 1875–1930; second, computing the total capital and operating income (as a proxy for expense) of these institutions in nominal dollars; third, deflating the totals to constant dollars; fourth, calculating the growth of total and per student costs; and finally, comparing the growth of these cost indexes to economy-wide indexes. The intricacies and complications of these basic steps are explained elsewhere (ibid.).
Drawing upon the commissioner's reports—supplemented by institutional documents and archival sources—we gathered a consistent set of financial data in five-year intervals from 1875 to 1930 for 32 institutions. These constitute a cross-section by geography, type, and mission. This does not mean that they are representative. No sample of institutions during this period can be proven as representative because the commissioner's reports do not list a complete or even consistent universe of institutions or reliable information for all the ones that are listed. But a cross-section on salient dimensions can be identified. These 32 institutions comprise eight private universities, eight private liberal arts colleges, four southern public universities, eight midwestern public universities, and four western public universities.Footnote 7
We began by analyzing aggregate costs, and we considered cost in terms of the annual operating income (as a proxy for operating cost) and in terms of the invested capital, including endowment and all property.Footnote 8 For this aggregate analysis, we summed 29 institutions, omitting the three western universities that did not open until after 1875.Footnote 9 Adding their figures at later points would arbitrarily elevate the growth rate of aggregate cost by expanding the number of institutions over time.
After calculating measures of growth in operating income and capital, we compared them to an economy-wide index. To make this comparison, economists have typically computed the compound annual growth rate (CAGR), which is very informative in assessing a particular point or brief period in the past or in projecting into the future. But a measure of the cumulative increase is also informative, particularly over a long historical period. For example, Howard Bowen found that per capita aggregate expenses of higher education grew in constant dollars at a CAGR of 1.4 percent between 1930 and 1976. Then he added, “[A]t this rate real cost per student would double every fifty years” (Bowen Reference Bowen1980: 34, 45). In addition to CAGR, we therefore calculated cumulative growth in percentages.
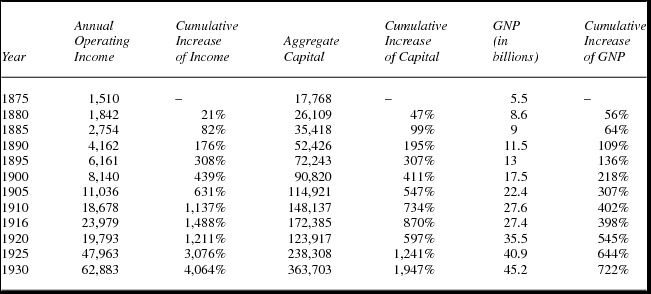
For the economy-wide index, we used the GNP, which measures the total value of production and services by the citizens of a given country, inside or outside the borders, over the course of a year. It is often reported in aggregate terms and is well suited to aggregate comparisons (Sutch 2006). We therefore calculated the percentages of cumulative growth of the deflated totals of operating income and capital and compared them to GNP. The results are presented in table 1.
Cumulative percentage increase of aggregate cost indexes for 29 colleges and universities compared to GNP, 1875–1930 (in 1,000s of constant dollars; 1860 = 1)

Source: Data is drawn from Kimball and Luke Reference Kimball and Luke2016, table 2, in which the data for individual institutions is presented.
Note: To deflate the nominal dollars, we employed the historical commodity price index devised by McCusker Reference McCusker2001. Throughout the tables, the data are reported for 1916, rather than 1915, because the statistical report for 1915 was never completed (US Commissioner of Education 1917, vol. 1: xiii).
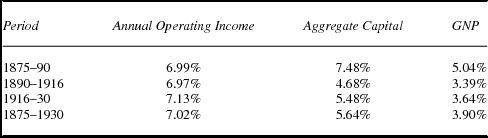
Over the entire period, the aggregate capital of the colleges and universities rose nearly 2,000 percent, the aggregate annual income more than 4,000 percent, and GNP only 722 percent. The corresponding CAGRs were 5.64 percent for total capital, 7.02 percent for total income, and 3.9 percent for GNP, as seen in table 2. By either measure, the increase of aggregate capital and annual operating income of higher education significantly exceeded that of GNP. This increase is remarkable given that US economic growth during this period was “unique in human history” (Gordon Reference Gordon2016: 285). The aggregate cost of the expanding higher education rose much faster than the national income.
Compound annual growth rates of aggregate income and capital for 29 colleges and universities compared to GNP, 1875–1930 (in constant dollars; 1860 = 1)
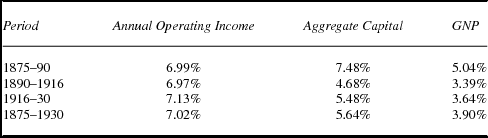
Note: Figures computed from table 1, employing the formula of R = (Y/A)(1/X) – 1, where R = compound annual growth rate; Y = ending value of the variable after X periods; A = initial value of the variable; X = number of periods or years. See Kimball and Luke Reference Kimball and Luke2016, table 5.
A still more critical determination is per unit cost, which addresses the efficiency of higher education by accounting for rising enrollment. As Howard Bowen stated, “[T]he total annual dollar cost of operating a college or university . . . even when adjusted for changes in the value of the dollar . . . is not meaningful for comparisons over time or among institutions unless it is related to the number of units of service rendered” (Bowen Reference Bowen1980: 3). In per capita calculations, we counted all 32 institutions, including the four western universities.Footnote 10
After dividing the deflated totals by the enrollment, we calculated the total cost per student by adding the per student operating income and the per student capital cost. Economists studying cost escalation have generally not included the cost of capital. But this is a real cost for colleges and universities. For example, O'Neill in her detailed study in 1971 combined capital costs and operating costs (O'Neill Reference O'Neill1971: 28, 37, 86, 97). More recently, Winston, a long-standing member of the Williams College Project on the Economics of Higher Education, has argued for including capital costs, comprising equipment, maintenance, supplies, depreciation, and opportunity cost. Winston estimates that capital costs increase the cost of higher education by about 25 percent (Winston Reference Winston1998; Reference Winston2001: 125). O'Neill's figures show that, in 1929–30, the capital costs amounted to about 32 percent of operating costs (O'Neill Reference O'Neill1971: 90–91).
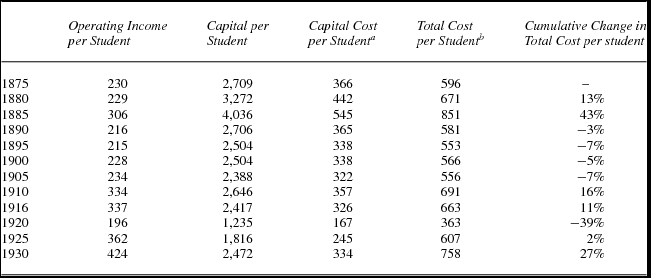
This fraction of 25 to 32 percent seems quite low for the period 1875–1930 because one-third of the per student operating income (cost) during this period amounts to a cost of only 3 to 4 percent of the per student capital, as seen in table 3. Capital cost should be figured much higher than 3 to 4 percent of capital, particularly given the enormous material investment in new institutions during the formative period. By comparison, Winston observes about capital cost that “depreciation is on the order of 2.5 percent of re-placement value while opportunity cost is, conservatively, 8 percent or more” (Reference Winston2001: 126). This “conservative” total of 10.5 percent does not consider equipment and maintenance, and O'Neill calculated the capital cost for 1929–30, the first year in her study, to be 7.8 percent of the total capital of land, buildings, and equipment (O'Neill Reference O'Neill1971: 32, 91). But she did not consider the opportunity cost of capital, which, in Winston's view, would raise the capital cost close to 18 percent (ibid.: 28–35). In light of these figures, we estimate the per student capital cost to be 15 percent of the per student value of capital during the period 1875–1930. But we also estimate that, across all 32 institutions, about 10 percent of the capital is endowment. Because the income, or cost, of endowment is already represented in the operating income, we discounted the per student capital by 10 percent and calculated 15 percent of the remainder to arrive at per student capital cost. This discount makes our rate of capital cost 13.5 percent.
Cumulative change of total cost per student for 32 colleges and universities, 1875–1930 (in constant dollars; 1860 = 1)

Source: Data for operating income and capital cost is drawn from Kimball and Luke Reference Kimball and Luke2016, table 4.
a Capital cost per student is calculated as 15 percent of 90 percent of the per student capital, as discussed in the text. This equals 13.5 percent of total capital.
b Total cost is the sum of operating income and capital cost, as discussed in the text.
The per student capital cost was then added to the per student operating income to arrive at the total cost per student. We also calculated the cumulative percentage change of the per student total cost over time, as seen in table 3.
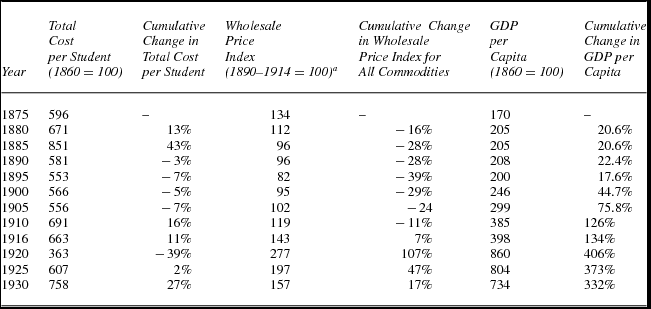
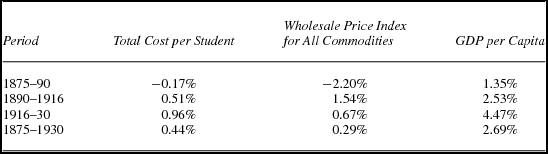
In absolute terms, the per student cost rose very slowly in constant dollars: only 27 percent over 55 years, including a sharp spike between 1925 and 1930. But cost escalation is a relative assessment, based on comparing per student cost to other costs or to per capita income, as described in the section “Cost Escalation and Two Predominant Explanations.” Hence, we next compared the changes in per student cost to a wholesale price index of all commodities and to per capita GDP.Footnote 11 The results appear in table 4.
Cumulative change of total cost per student for 32 colleges and universities compared to GDP per capita and wholesale price index of all commodities in constant dollars, 1875–1930

Source: Data are drawn from table 3; Hanes Reference Hanes and Carter2006; Sutch Reference Sutch and Carter2006.
Note: The difference between the baseline of the wholesale price index of all commodities and that of the other indexes does not matter here, because we are comparing not their absolute amounts, but their rate of change over time. That rate does not change with the baseline year.
a The wholesale price index of all commodities is virtually equal to the wholesale price index of nonfarm commodities during this period.
Over the 55-year period, the cumulative growth of 27 percent in per student cost is close to the 17 percent increase in the commodity prices.Footnote 12 Meanwhile, per capita GDP grew more than 12 times as fast, driven heavily by the industrial production during World War I. The corresponding CAGRs are 0.44 percent for per student cost, 0.29 percent for the price of all commodities, and 2.69 percent for GDP, as seen in table 5. By either measure, the per capita GDP grew much faster than did the per student cost or the commodity prices during the period from 1875 to 1930.
Compound annual growth rates of total cost per student of 32 colleges and universities, wholesale price index for all commodities, and GDP per capita, 1875–1930

Source: Amounts computed from data in table 4.
Tables 1 and 2 reveal that cost escalation in aggregate expenses of higher education occurred consistently between 1875 and 1930. Both national wealth and higher education cost expanded enormously over this period. But the latter grew faster, as evident in this cross-section of 29 institutions. In aggregate terms, higher education consumed an increasing fraction of national income, largely due to the astonishing expansion of higher education. Between 1875 and 1930, the number of colleges and universities more than doubled from 591 to 1,432, and the number of their “regular” students enrolled during the academic year rose twelve-fold from about 90,100 to about 1,086,000 (US Bureau of Education 1932, v. 2: 6, 10; US Commissioner of Education 1875: xxv). Furthermore, this cost escalation occurred in every major subperiod, as seen in table 2.
Even more striking and significant is the conclusion demonstrated by table 4: that cost escalation did not occur in the more telling per capita terms. The cost per student grew very slowly and only slightly more than the price of all commodities. Higher education became scarcely more expensive relative to all commodities, and became much cheaper relative to national income, because the growth of per capita GDP grew more than 12 times as fast. And this happened in each major subperiod, as seen in table 5. In a word, the college and universities were spending feverishly in the aggregate, but their spending did not keep pace with the rising number of students.
The aim and scope of this article does not permit extensive historical analysis of these findings, which will be published elsewhere. The subject here is the historical claims and validation of cost disease theory. Tables 4 and 5 present findings that are not consistent with the explanation and prediction about cost escalation presented by cost disease theory. The cost of higher education, a personal services industry, did not rise sharply, or even much at all, in this 55-year period of rising economic productivity compared to other goods-producing industries or to the national income.
Conclusion
In 1966, economists William Baumol and William Bowen introduced cost disease theory to explain cost escalation in the performing arts, and in 1968 the latter applied the theory to explain worrisome cost escalation in higher education. Over the next 50 years, Baumol, Bowen, and other highly respected economists asserted that the theory had been convincingly tested and validated. This claim is particularly important because cost disease theory is exculpatory, and the exculpation increases the obligation to scrutinize the efforts to validate this explanation.
The logic of the theory implies the basic steps in testing it. Identify industries that fit the personal services attributes. Show that these industries are “stagnant,” meaning that their cost grows much faster than their productivity as compared to other industries or the national income. Demonstrate that compensation in these personal service industries rises faster than their overall cost. Finally, show that compensation predominates in the total cost of these industries.
William Bowen followed the first two steps in his 1968 study, but his handling of historical data was flawed. Since that time, the cost disease literature has invoked Bowen's study and others regarding higher education as successful validations of cost disease theory. But the cost disease studies, over those nearly 50 years, have fundamental problems of reductionism, circular reasoning, and neglecting the causal mechanism proposed by the theory. Hence, they provide scant validation that the theory explains cost escalation in higher education.
Recent research on cost trends in higher education from 1875 to 1930 provides a more salient test of the theory. This era was the formative period of US higher education and the period of greatest national economic growth, which has been called “unique in human history” (Gordon Reference Gordon2016: 285). In this era, then, above all others, the cost disease theory predicts that “health care, education, and other important services” would experience “rising costs” due to lower productivity growth, as compared to other manufacturing industries and to the national economy (Baumol Reference Baumol2012: 5).
However, according to this new research, cost disease theory does not survive even the first two steps of validation. Between 1875 and 1930, higher education experienced significant cost escalation in aggregate terms, which resulted from the extraordinary expansion of higher education. But, in the per capita terms that are salient to its productivity, the per capita cost of higher education grew very slowly over this period, scarcely faster than the price of all commodities, and much more slowly than per capita income. This finding is inconsistent with the cost disease view that costs in higher education, a service industry, should rise faster than costs generally and the national income during periods of rising productivity. Given this finding and the analysis of cost disease studies on higher education over the past 50 years, little validation exists that cost disease theory explains cost trends in higher education from the 1870s to 2010s.
This conclusion does not challenge the validity of cost disease theory as it applies to other industries, such as performing arts or heath care. Nor does it preclude cost disease theory explaining cost escalation in more limited and more recent periods after 1968, as between 1982 and 1995. Even in the latter regard, however, two substantive counterpoints in recent decades challenge the import of cost disease theory. If the theory explained recent cost escalation in higher education, then faculty salaries should be rising faster than the cost of higher education and should predominate in that cost. But faculty salaries since 1990 have not been increasing as the cost disease theory predicts, particularly in comparison to the growth of administration (Erwin and Wood Reference Erwin and Wood2014; Geiger Reference Geiger2004: 59; Olson Reference Olson1997: 228). Cost disease theorists have not addressed this significant counterpoint.
Furthermore, the growing number of “contingent” or “adjunct” faculty in higher education over the past 30 years suggests that the theory cannot explain recent cost escalation. The proportion of faculty on part-time or temporary contracts has grown from 43 percent in 1975 to 69 percent in 2007, and the percentage is higher today. This development has certainly reduced overall faculty compensation because adjunct faculty are paid much less than regular faculty. The development has prompted widespread discontent, and a movement to unionize adjunct faculty is sweeping higher education (Bradley Reference Bradley2004; Donoghue Reference Donoghue2008: 24, 34; Fredrickson Reference Fredrickson2015; Lewin Reference Lewin2013; Schrecker Reference Schrecker2010: 202; Thompson Reference Thompson1994).
The growing number of “contingent” or “adjunct” faculty has direct implications for cost disease theory, because it changes the “productivity ratio” in higher education. As William Bowen observes, “[P]roductivity improvements can be either ‘output enhancing’ (raise the numerator) or ‘input-conserving’ (lower the denominator)” (Bowen Reference Bowen2012: 6). Both Baumol and Bowen have explored whether information technology can enhance productivity in libraries and higher education (Baumol and Blackman Reference Baumol and Blackman1983; Bowen Reference Bowen2012). This approach is “output enhancing.” William Bowen has argued that “we need to improve productivity through determined efforts to reduce costs . . . lowering the denominator of the productivity ratio” (Bowen Reference Bowen2012: 6). Among others, Archibald and Feldman maintain that improving productivity “is indeed the only way to break the grip of cost disease” (Archibald and Feldman Reference Archibald and Feldman2008: 277).
In effect, a massive movement to do exactly that has been underway for four decades: “the silent but steady casualization of the college and university teaching work force” (Donoghue Reference Donoghue2008: 67). Even if the salaries of regular faculty were rising, the adjunctification of the faculty has served to increase the productivity ratio of higher education. Remarkably, economists analyzing the development of cost disease have been silent on this development (Archibald and Feldman Reference Archibald and Feldman2008; Baumol Reference Baumol2012; Bowen Reference Bowen2012; Massy Reference Massy2003). Adjunctification is politically sensitive, and a significant counterpoint to cost disease theory in higher education, whose cornerstone is the growth of faculty compensation. Given the lack of historical validation, as well these two counterpoints, we must look elsewhere to explain broad historical trends in cost escalation in US higher education.