Nomenclature
- CC
-
clean cavity
- CC D
-
clean cavity with door
- CFD
-
computational fluid dynamics
- CFL
-
Courant-Friedrichs-Lewy
- CTS
-
captive trajectory system
- DES
-
detached eddy simulations
- LES
-
large eddy simulations
- L/D
-
length-to-depth
- L/W
-
length-to-width
- OASPL
-
overall sound pressure level
- S CC D
-
store in the clean cavity with door
- SST
-
shear-stress transport
- 6-DOF
-
six-degrees-of-freedom
1.0 Introduction
The deployment of weapons in modern military aircraft, whether internally or externally, significantly influences operational stealth, aerodynamic performance and combat effectiveness. The growing emphasis on internal weapons carriage systems stems from the need to reduce radar cross-sections and improve aerodynamic efficiency. Different aircraft, such as large bombers and fighter jets, utilise internal weapon bays, with the design of these storage cavities playing a critical role in the overall performance of the aircraft. For example, large bombers often employ high length-to-diameter (L/D) ratio cavities, or closed-type cavities, enabling the simultaneous release of multiple stores for area bombardment. On the other hand, fighter jets, which require more precise and rapid payload delivery, feature smaller cavities, requiring advanced smart stores to ensure effective separation and safe operation.
Previous research has shown that transitioning from closed-type to open-type cavity flow, achieved by reducing the L/D ratio, can improve store separation dynamics [Reference Stallings1]. However, this design change introduces challenges, particularly the emergence of unsteady shear layers within the cavities, which can complicate safe store release. A comprehensive understanding of the turbulent flow within the cavity and the influence of external factors is essential for ensuring the safe and effective separation of stores. Achieving safety clearance for store separation is a time-consuming and expensive process, often involving extensive wind tunnel testing and computational fluid dynamics (CFD) simulations to predict the forces and moments acting on the stores during release [Reference Olejnik, Dziubinski and Kiszkowaik2, Reference Rainey3].
Early foundational work on store separation began in the 1950s with wind tunnel studies by Rainey (1954), who investigated bomb release at high Mach numbers [Reference Rainey3]. This research provided insights into how altitude and cavity geometry affect store separation behaviour. Building on this, Stallings Jr. [Reference Stallings1] explored the influence of depth-to-length (D/L) ratios on store trajectory, demonstrating that cavities with a D/L ratio of 0.225 produced more favorable separation outcomes compared to smaller ratios. These early studies laid the groundwork for subsequent research in the field, particularly concerning the role of cavity geometry and flow dynamics.
The advent of advanced numerical methods and high-performance computing since the 2000s has significantly expanded the scope of store separation research. Shipman et al. [Reference Shipman, Stanek, Beran and Ahmed4] introduced a six-degrees-of-freedom (6-DOF) CFD model to investigate store separation in the presence of multiple rectangular cavities. Their findings emphasised the importance of active flow control methods in reducing alternating forces and moments, which facilitated safer store separation at lower speeds. Kim et al. [Reference Kim, Choi and Kwon5] further contributed to this field with simulations of unsteady flow inside a weapons bay using detached eddy simulation (DES) and the k–ω SST turbulence model. They found that flow unsteadiness, primarily caused by oscillating shear layers at the cavity edge, significantly affected store trajectory and attitude during separation. Furthermore, steady blowing from the front wall of the cavity was demonstrated to mitigate pressure fluctuations and stabilise store separation by reducing dependency on the release timing.
Acoustic effects arising from cavity flow oscillations remain a significant challenge in store separation. Sound levels within the cavity can range between 160 and 180dB, posing a risk to both the equipment and the store itself. This issue is further compounded by the store’s trajectory being highly sensitive to the timing of its release, as unsteady shear layers induce complex force and moment variations. Research by Cenko et al. [Reference Cenko, Deslandes, Dillenius and Stanek6] highlighted how these unsteady aerodynamic forces, rather than release timing alone, could lead to trajectory deviations in stores released from weapons bays. Additionally, Johnson et al. [Reference Johnson, Stanek and Grove7] explored how unsteady flow dynamics in internal weapons bays could cause deviations in store separation trajectories, further complicating safety clearances.
Recent investigations have continued to focus on the complex interplay between aerodynamic forces and control methods in store separation. Song et al. [Reference Song, Ai, Zhao, Jiang and Lu8] examined the effect of control devices on store separation from open cavities, showing that such devices can significantly improve the aerodynamic characteristics of the separation process. In later studies, Song and Ai [Reference Song and Ai9] developed an aircraft-store compatibility evaluation model, which emphasised the critical role of aerodynamic interactions in determining the success of internal store separation. Their findings were extended in 2022, where Song et al. [Reference Song, Dong, Lu and Jiang10] identified adverse pressure gradients near the cavity, leading to nose-up pitching moments that increased the risk of store collisions with the aircraft.
This study aims to investigate the complex aerodynamic interactions involved in internal store separation, particularly focusing on the effects of release timing and turbulent flow dynamics on store trajectory deviations. While previous research has provided valuable insights into the factors affecting store separation, the unpredictability of unsteady aerodynamic forces remains a significant challenge. By integrating insights from early foundational studies and recent computational advancements, this research seeks to improve safety protocols and enhance operational effectiveness in military aviation.
2.0 Solution of the six degrees of freedom equations of motion
The validation process is essential to ensure the accuracy and reliability of the numerical solutions. In this study, validation is conducted using non-real-time experimental data known as the captive trajectory system (CTS) test, which simulates the release of a generic store under the wing, commonly referred to as the Eglin test in the literature.
In the CTS method, pressure values are measured using sensors to capture the effects of the airflow on the scaled store placed in the wind tunnel. Subsequently, the new position of the store is determined by calculating forces and moments with the aid of computers and applying the necessary time steps. Notably, the experimental setup used for the CTS test is a 1/20 scale model of the actual store, which allows for detailed analysis of the scaled system.
Figure 1 illustrates the geometric details of the model employed in the CTS experiment, as described by Fox [Reference Fox11].
1/20 scaled geometry of the wind tunnel experiment (a) store geometry, (b) CTS structure, c) wing, pylon and store geometry (dimensions in a and c are in cm, dimensions in b are in inches) [Reference Fox11].

Pressure and temperature conditions: The study assumes standard atmospheric conditions at an altitude of 20,000 feet, featuring a pressure of 35,990 pascals and a temperature of 236.65K.
Computational domain: The computational domain encompasses a 10-chord-length distance from the front, bottom and top boundaries, while the rear boundary extends 20 times the chord length.
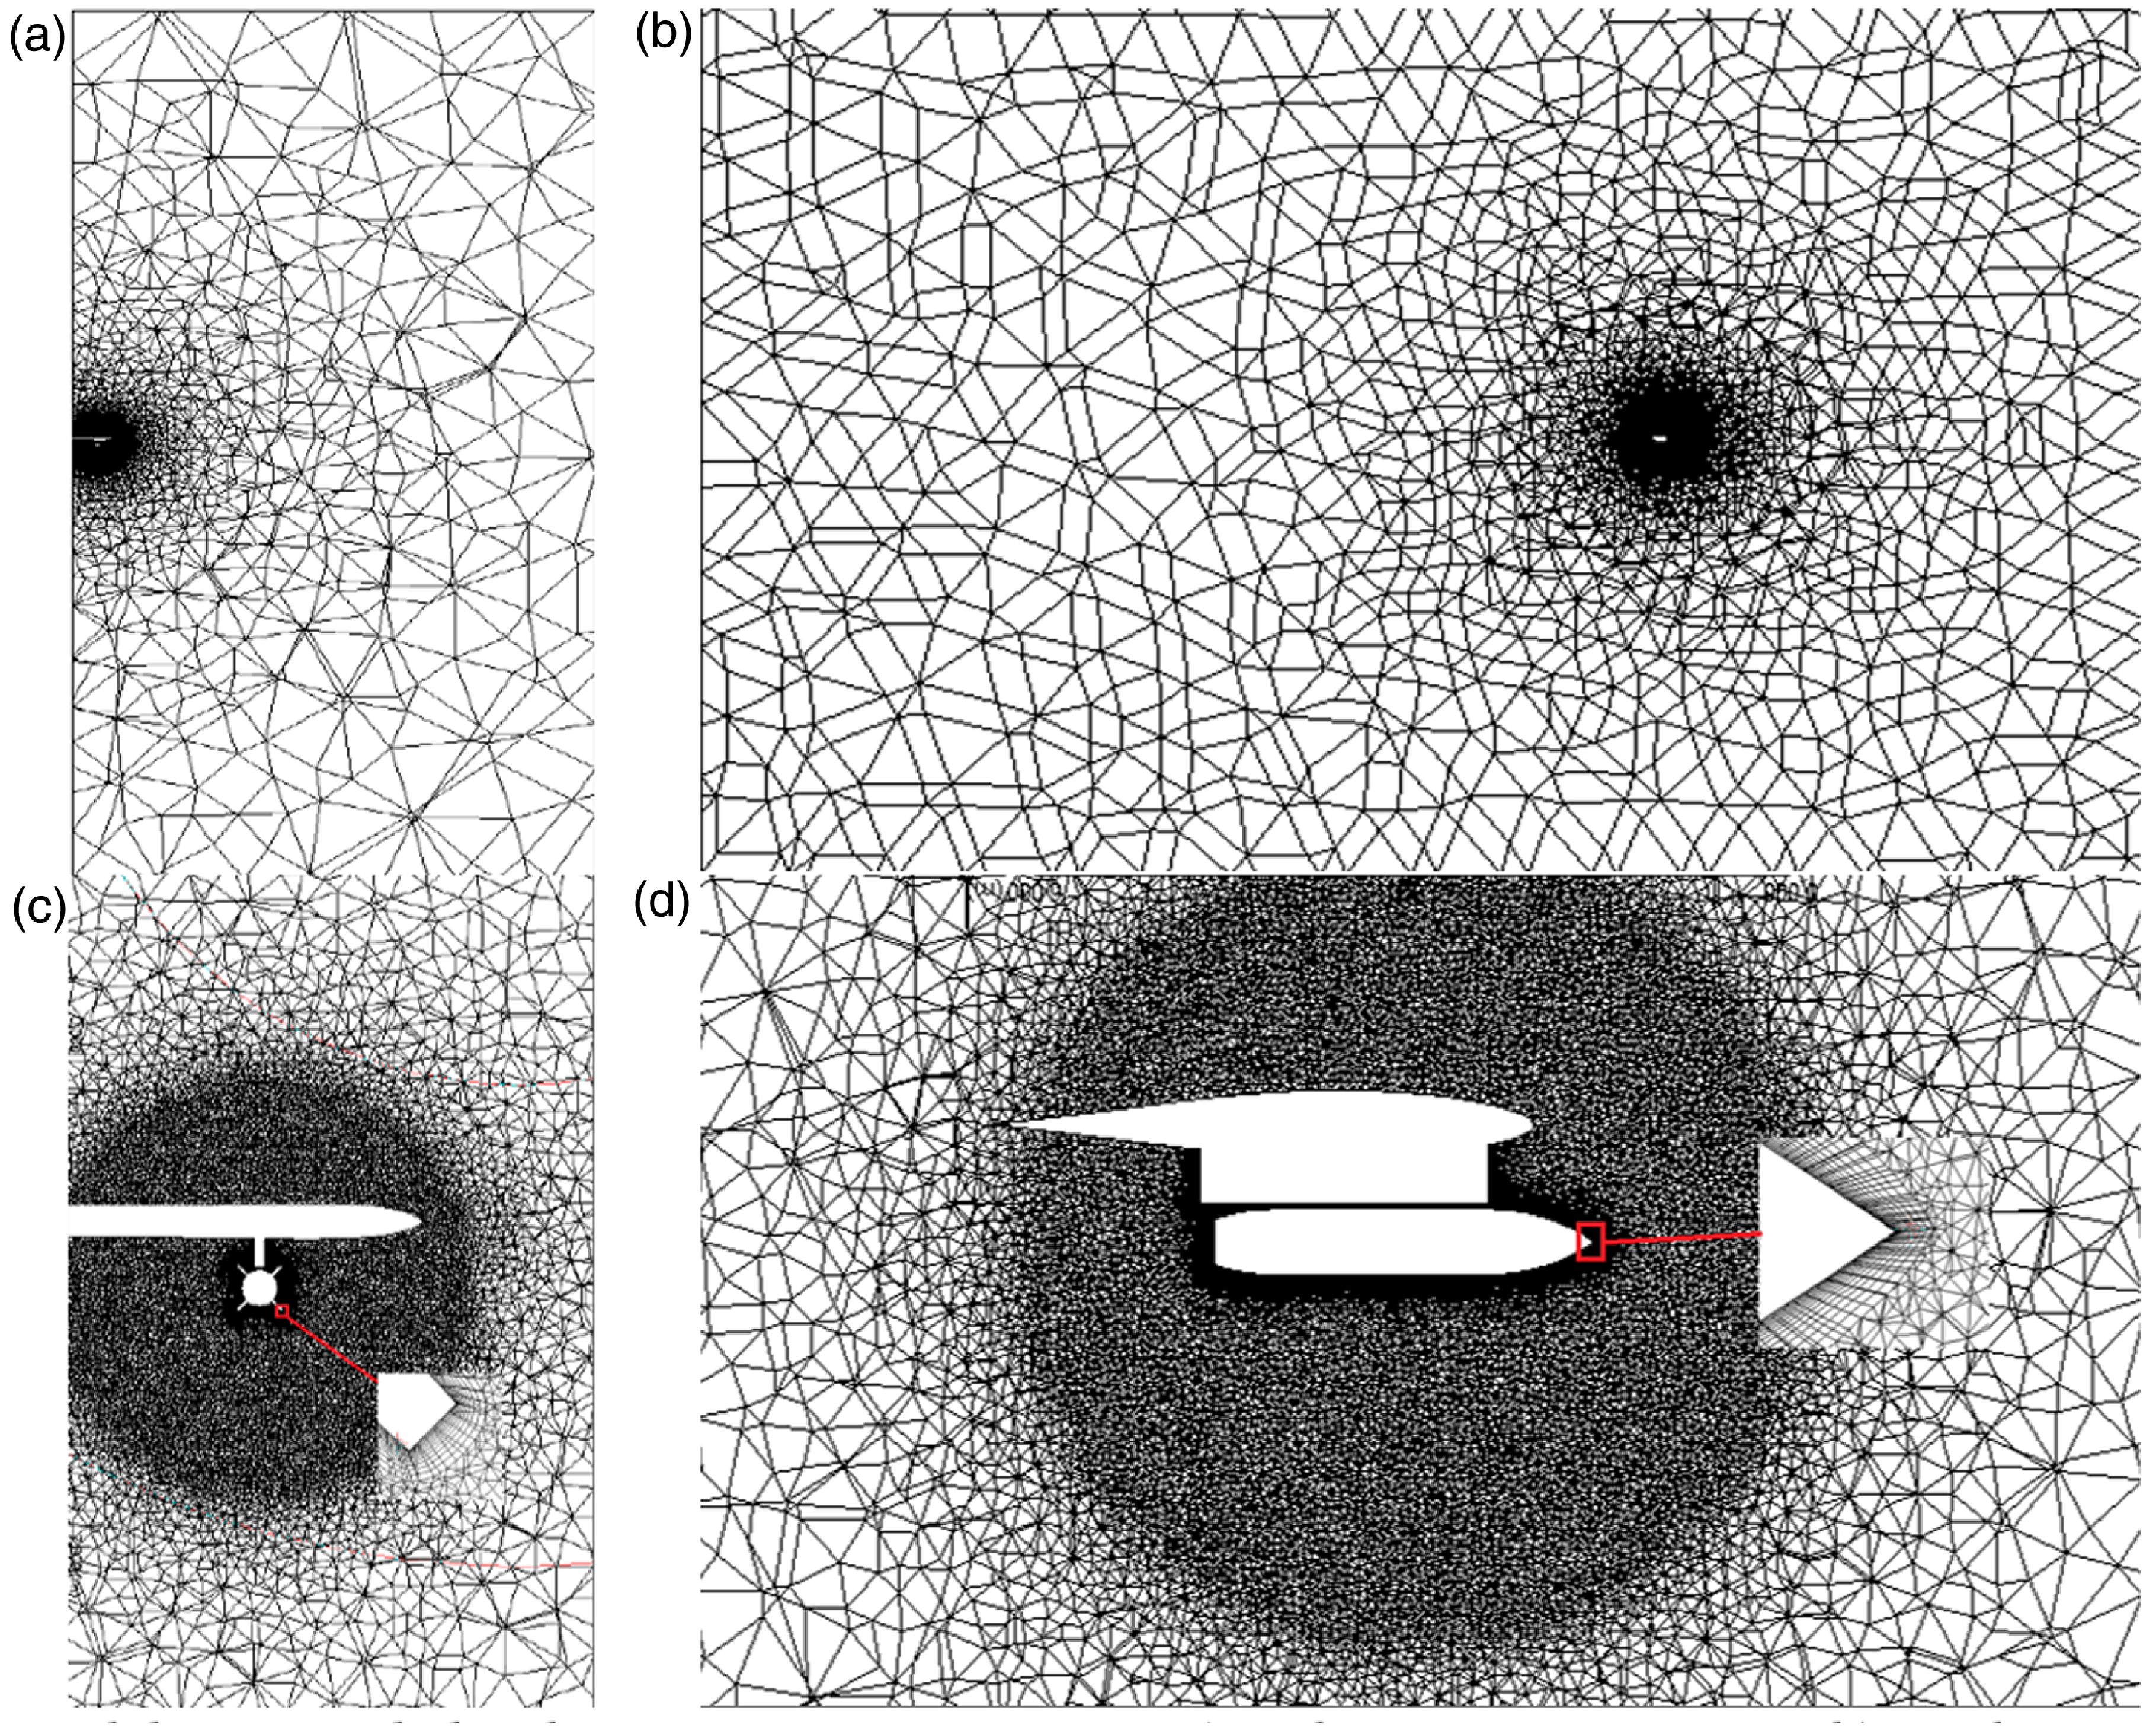
Grid and shear layer refinement: For this domain, a grid with a shear layer refinement was meticulously created and shown in Fig. 2. This grid comprises 5.8 m cells and adheres to stringent quality criteria, including a minimum orthogonality of 0.16, a maximum skewness value below 0.8, and a y+ value below 50. It is strategically concentrated around the store.
Grid structure view of EGLIN numerical solution (a) front view of the entire mesh, (b) side view of the entire mesh, (c) close-up frontal view, (d) close-up side view.

Boundary conditions: Table 1 provides a succinct summary of the boundary conditions applied to the solution domain.
Boundary conditions of Eglin computational domain

Turbulence model and solver: For the pressure-based solver, the study employs the SST k-ω turbulence model. Second-order discretisation schemes are applied to both the momentum and turbulent transport equations.
Simulation process: The research unfolds in two main phases:
-
Commencing with a steady flow solution,
-
Transitioning to a transient six degrees of freedom dynamic solution.
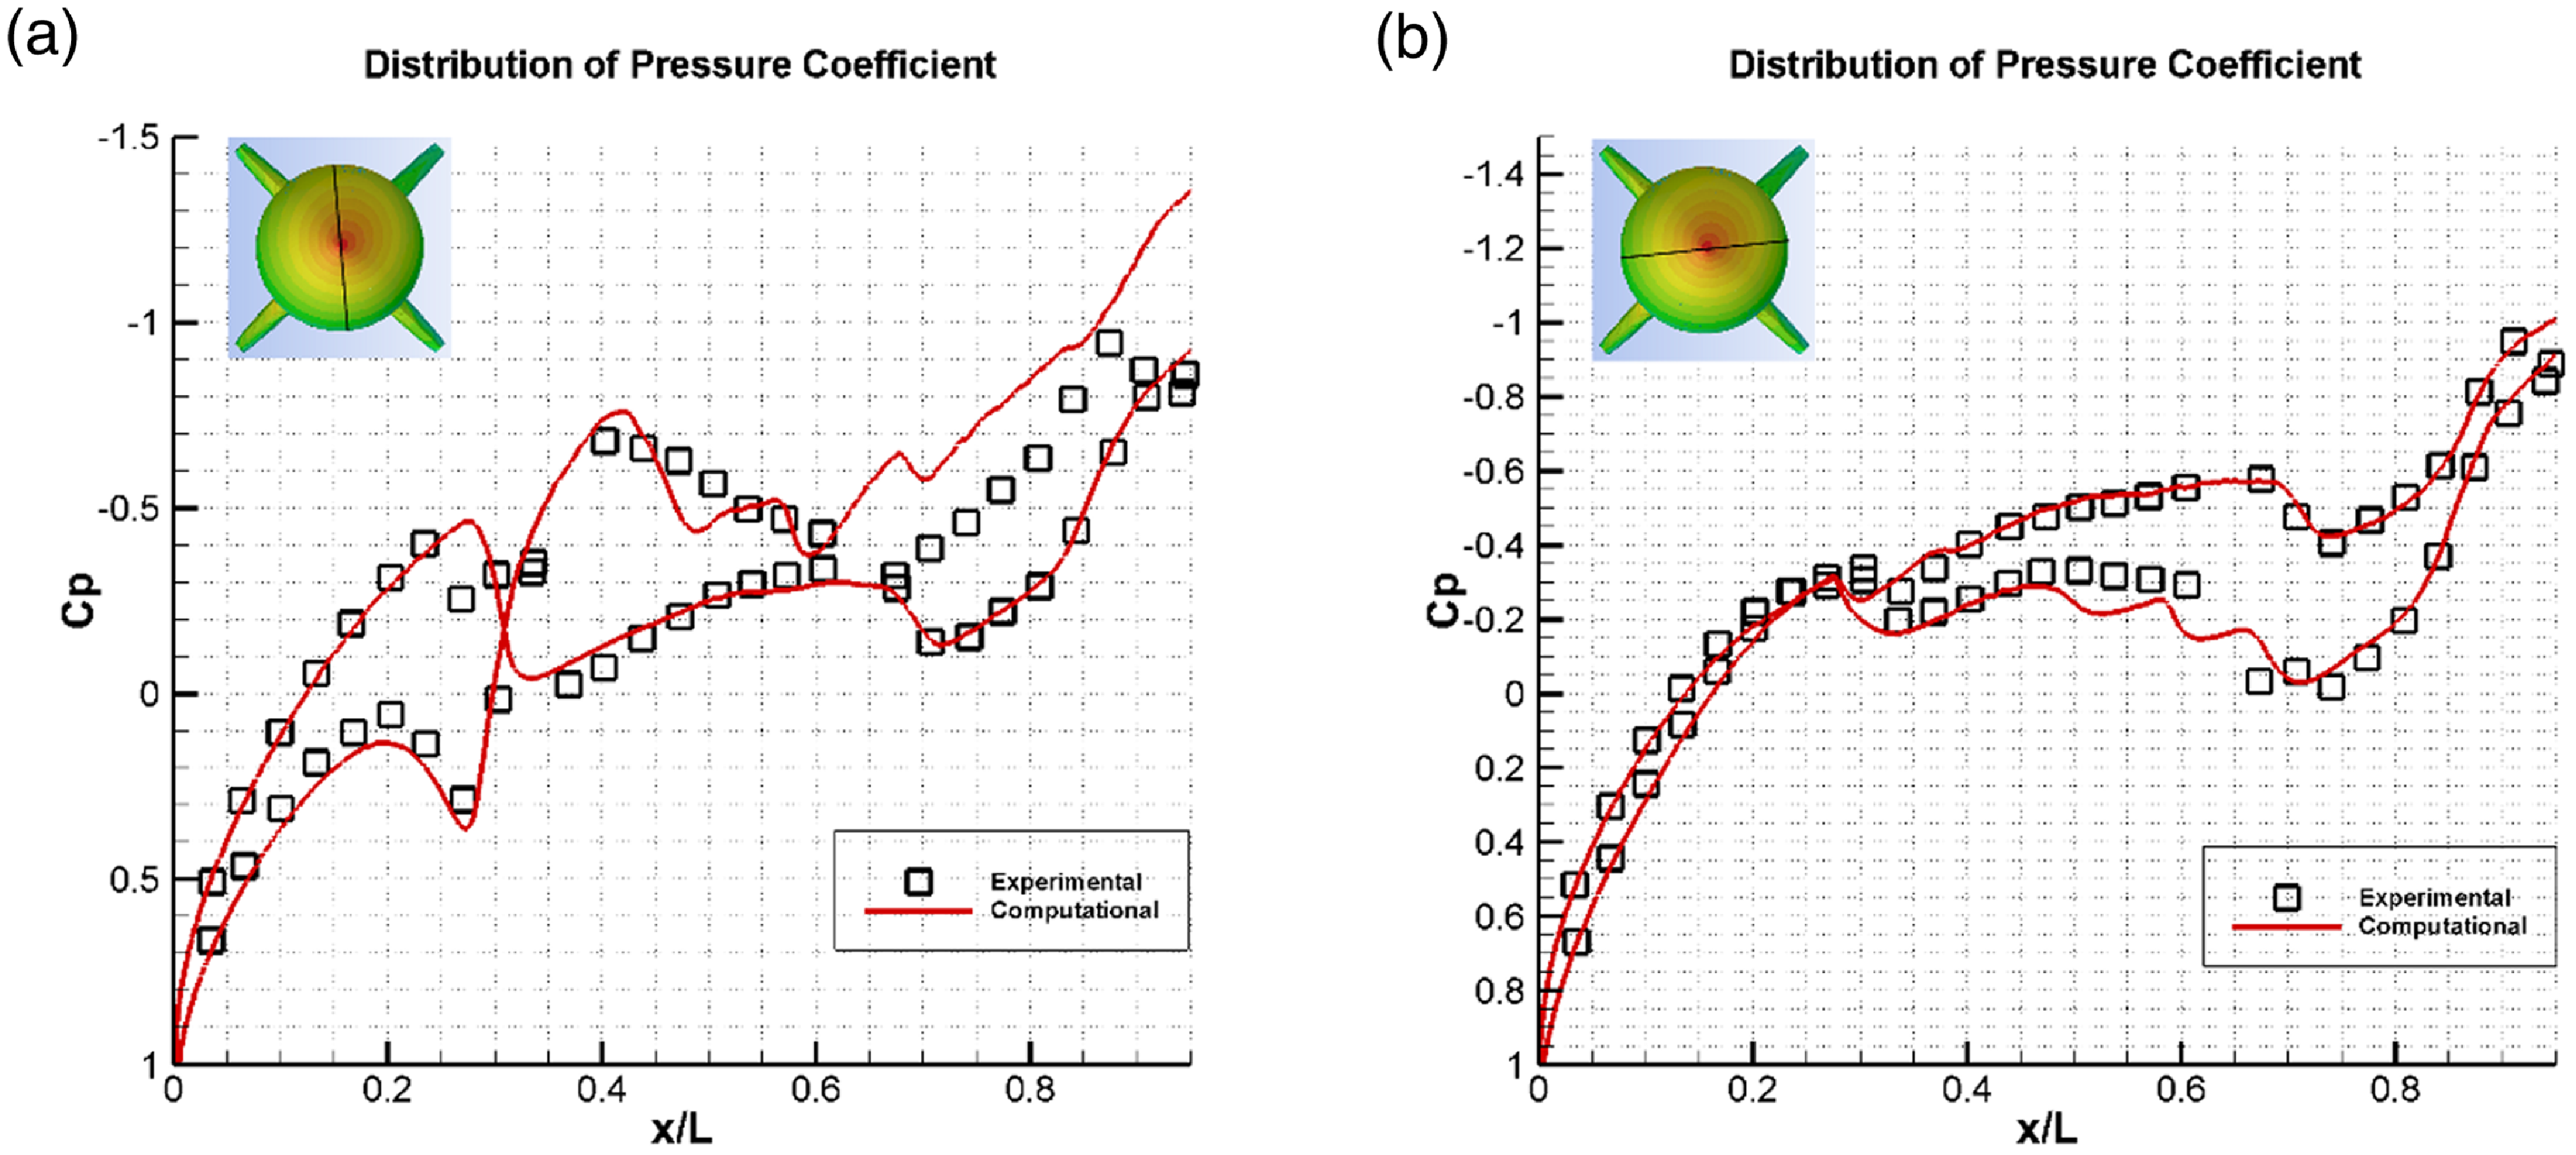
Pressure coefficient and experimental comparison: The results of the steady solution are contrasted with experimental data to evaluate the pressure coefficient distribution. This comparison is graphically illustrated in Fig. 3.
Pressure coefficient distribution (a) 5–185 degrees, (b) 95–275 degrees.

Pressure coefficients along the longitudinal direction of the store are compared at four distinct tangential locations: 5–185 degrees in Fig. 3(a) and 95–275 degrees in Fig. 3(b). Both figures clearly illustrate a strong agreement between the experimental and numerical data. Notably, as we progress towards the rear of the store, particularly around the region between the store and the pylon, there is a slight overprediction of the pressure coefficient. However, this minor discrepancy does not appear to significantly impact the translation and rotation of the store. This observation can be attributed to the dominant influence of the ejection force over the aerodynamic forces, especially during the initial moments of store separation (0–1 second).
The predicted translational and rotational values are meticulously compared with the experimental data, as showcased in Fig. 4.
EGLIN numerical solution (a) translational values, (b) rotational values.

Translational behaviour (Fig. 4a): The translational behaviour of the store, illustrated in Fig. 4(a), reveals a perfect alignment between the numerical and experimental data. The agreement is striking and underscores the accuracy of the numerical predictions.
Rotational values (Fig. 4b): Examining the rotational values, specifically the yaw angle (z-axis), the numerical model captures the behaviour with remarkable precision. In terms of inclination, which pertains to the pitch angle (y-axis), there is a notable concordance with the experimental data. The maximum experimental value of 5.3 degrees aligns closely with the numerical solution’s result of 4.8 degrees. Similarly, the roll angle (x-axis) inclination is accurately predicted, with a minimal difference of less than 0.5 degrees between the data.
It’s worth noting that the small differences observed are primarily attributed to the disparity in the adopted methods. The wind tunnel experiment employs the CTS method, calculating forces on the store at each time step within a time-independent steady flow, while the actual store separation scenario is inherently time-dependent. In the numerical analysis, a time-dependent approach is applied to faithfully capture the dynamics of the real problem.
3.0 Transonic cavity flow
In this section, the adopted numerical solution is validated through a comparison with the M219 experimental cavity study documented in the literature. The M219 study involved the use of a clean cavity and the testing of passive control methods at a Mach number of 0.85, where the cavity exhibited an L/D and L/W ratio of 5 (as described in Ref. (Reference Nightingale, Ross and Foster12)). Figure 5 provides a schematic representation of the cavity geometry.
Experimental M219 clean cavity geometry [Reference Nightingale, Ross and Foster12].

Cavity flow is typically characterised by an unsteady shear layer formed when the steady boundary layer interacts with the cavity. The stable boundary layer separates from the leading edge of the cavity with minor oscillations, progressing through the mid-cavity. Subsequently, the shear layer transitions into turbulent eddies that impinge upon the trailing edge or the back corner of the cavity, generating sound pressure waves that propagate upstream. This complexity of cavity flow pertains to both the physics and acoustics involved.
In this context, the results obtained from DES were compared with available experimental and large eddy simulation (LES) data for the M219 cavity. The comparisons were conducted for both scenarios: with the cavity door (clean cavity) and without the door.
To distinguish between different cases of cavity flow, abbreviations are utilised in this section. Specifically, CC denotes the clean cavity, D represents the cavity door, and S stands for the store, as illustrated in Fig. 6. The letter A appended to these names indicates simulations conducted at 10,000 feet altitude.
Representation of the cavity cases by abbreviations.

Scaling the clean cavity geometry: The simplified clean cavity geometry, as depicted in Fig. 5, was scaled up by a factor of 8 to accommodate the Eglin Air Force Base study’s generic store within the cavity.
Mesh quality and density: To enhance mesh quality and density around the cavity, the solution domain was narrowed, following recommendations in the literature. Lawson and Barakos demonstrated that achieving a numerical solution for M219 cavity flow requires specific far field distances of 2L from the front, back and sides, and approximately 5L from the top [Reference Lawson and Barakos13]. The solution domain, created according to these parameters, is illustrated in Fig. 7.
M219 clean cavity numerical solution domain.

Boundary conditions: The boundary conditions applied within this solution domain mirror those detailed in Table 1, except the freestream flow rate, which was adjusted to 0.85 Mach to align with the M219 experiment.
Experimental ambient conditions: The experiments were conducted under specific ambient conditions, featuring a pressure of 101,325Pa and a temperature of 288.15K.
Solution domain and mesh characteristics: Within this solution domain, a mesh consisting of 5.3 m tetrahedron cells was carefully constructed to meet specific criteria. The mesh achieved a minimum orthogonality of 0.1, a maximum skewness of 0.87, and maintained y+ values below 100. Visual representations of this mesh structure can be found in Fig. 8.
M219 clean cavity numerical solution domain’s mesh (a) front view of the mesh, (b) side view of the entire mesh, (c) close-up frontal view, (d) close-up side view.

Temporal resolution: The time step was set at 5×10⁻⁶ seconds, ensuring that the Courant-Friedrichs-Lewy (CFL) value remained below 5.
Numerical methods: To address the various aspects of the simulation, specific numerical methods were employed, including:
-
PRESTO for pressure
-
Second-order bounded central differencing for momentum
-
Third-order Monotonic Upstream-centered Scheme for Conservation Laws (MUSCL) discretisation scheme for density, turbulence and energy equations.
For the discretisation of the time derivative, the bounded second order implicit scheme was preferred.
Given the absence of experimental data within the cavity, we turned to a comparison of velocity, turbulence kinetic energy, and Reynolds’s stress profiles derived from our DES solution with a reference LES study [Reference Larcheveque, Sagaut, Le and Comte14]. This comparison is presented in Fig. 9. Notably, the numerical results from our study demonstrate an exceptional level of agreement with the LES results, reinforcing the credibility and accuracy of our findings.
Comparison of M219 clean cavity DES numerical solution with reference LES study (a) longitudinal velocity profile, (b) vertical velocity profile, (c) turbulent kinetic energy profile, (d) Reynolds’s stress profile.

In this numerical analysis, we compare the overall sound pressure levels (OASPL) obtained from the cavity floor to the available experimental data [Reference Barakos, Lawson, Steijl and Nayyar15], as illustrated in Fig. 10. The results reveal that these OASPL values are approximately 5dB higher than the experimental data for the clean cavity floor without a door, and 3dB higher than the clean cavity with a door. It’s worth noting that this trend of overprediction in sound pressure levels compared to experimental data is consistent with many clean cavity numerical studies conducted previously in the literature, including works by Refs ( Reference Lawson and Barakos13, Reference Barakos, Lawson, Steijl and Nayyar15–Reference Güleren, Türk, Demircan and Demir18).
OASPL comparison of M219 clean cavity with and without doors.

The notable agreement seen in both Figs 9 and 10 underscores the suitability and reliability of our numerical method for in-cavity validation studies.
4.0 Internal store separation
Following validation, studies were conducted to investigate internal store separation from the cavity. The analysis process included a preliminary stationary solution for the unreleased store, followed by a dynamic mesh solution for the released store.
Altitude conditions: Based on earlier findings in the literature [Reference Rainey3], altitude conditions of 10,000 feet, corresponding to a pressure of 69,681.66Pa and a temperature of 268.3K, were chosen as the reference altitude conditions for store separation from the cavity. The DES turbulence model was employed for numerical analyses.
Temporal parameters: Consistent with previous cavity studies, a time step of 5×10⁻⁶ s was utilised to maintain the CFL value below 5. Discretisation methods of second and third order were employed.
Initial ejection forces: In the numerical solutions for internal store separation, equal forces of 40kN were simultaneously applied to the store, distributed equidistantly from its center of gravity. This approach eliminated any initial moment and ensured that the trajectory of store separation remained independent of the initial conditions. These initial ejection forces were applied over 0.05 seconds, mirroring the approach taken in external store separation. Initial ejection forces in numerical solutions for internal store separation, as shown in Fig. 11.
Ejection forces applied in internal store separation.

Computational resources: The use of high mesh densities and small time steps made these analyses resource-intensive. For instance, the computational time for a solution involving 8 m mesh cells to cover both unreleased and released store scenarios required 15 days and utilised 5 machines with 40 cores each, equivalent to approximately 72,000 CPU hours.
Stationary numerical solution (unreleased store): For the stationary numerical solution involving the unreleased store, the geometry and mesh were established following the same approach as in the previous cavity validation study.
Method comparison: The stationary solution was conducted using the identical numerical method, and the results were compared with the solution obtained without the store. To facilitate this comparison, the stationary numerical solution was initially executed under M219 ambient conditions, mirroring the conditions without the store. Subsequently, the analysis was repeated under the specific altitude conditions relevant to store separation.
Distribution of OASPL values in the store: To assess the distribution of OASPL values in the store, measurements were obtained from four distinct sections. Figure 12 provides a visual representation of the sections from which OASPL values were extracted.
Sections where OASPL values are taken on store.

Figure 13 presents a graphical representation of OASPL values measured at various angles across the store. The highest OASPL values were consistently observed on the flap situated behind the store, corresponding to a cross-section angle of 225 degrees. In the M219 experimental environment, the maximum OASPL value on the store was recorded at 179.379dB. However, at 10,000 feet, this value reduced to 176.351dB. While the increase in altitude contributed to a slight decrease in sound pressure level, the resultant 170dB level remains relatively high. The elevated sound level could potentially have adverse effects on electronic sensors located on the flaps, particularly those utilised for guiding smart bombs. As shown in Fig. 13, there is a noticeable inverse relationship between altitude and sound level on the store.
Store OASPL values for S CC D and S CC D A numerical solutions.

Figure 14 illustrates the comparison of OASPL values obtained from the cavity floor. Notably, an increase in altitude has a diminishing effect not only on the sound level recorded in the store but also on the cavity floor. In the experiment conducted in the M219 environment, the maximum OASPL value on the cavity walls reached 177.6032dB. However, this value decreased to 174.367dB at 10,000 feet. This observation highlights that elevating the altitude results in a reduction of both the maximum OASPL on the cavity walls and the overall OASPL distribution across the cavity floor.
OASPL comparison of cavity floor belonging to numerical solutions.

Figure 15 schematically represents the forces and moments acting on the store, providing a visual overview of these critical parameters. In Fig. 16, the force and moment coefficients for the stationary solution are presented. These coefficients offer insights into the dynamic behaviour of the flow within the cavity. The release process was executed from points where the normal force acting on the store reached both its maximum and minimum values.
Representation of the forces and moments acting on store.

The force and moment coefficients acting on the store belonging to S CC D A numerical solution (a) the force coefficient acting along the y-axis and the moment coefficient acting around the x-axis (b) the force coefficient acting along the z-axis and the moment coefficient acting around the y axis (c) The force coefficient acting along the x-axis and the moment coefficient acting around the z-axis (d) all coefficients.

In Figs 17 and 18, the trajectory followed by the store upon its release when the force in the z direction is at extreme conditions (maximum and minimum) is depicted from the front and the side. The colour contours show changes in pressure coefficients across the store, cavity and doors along the trajectory.
Store movement representation for Fz min belonging to dynamic numerical solution for S CC D A (a) front view, (b) side view.

Store movement representation for Fz max belonging to dynamic numerical solution for S CC D A (a) front view, (b) side view.

Normal forces and moment coefficients: Fig. 19 illustrates the variation of normal forces and moment coefficients in the x, y and z directions acting on the store during its movement. Two numerical solutions were released when the normal force in the z direction was at its maximum and minimum. The force and moment values are plotted against the store’s path in the z-axis, divided by the store’s diameter. Despite the consistent flow physics, there are differences in instantaneous values due to the time-dependent nature of the problem. These variations in force and moment coefficients translate into quantitative, if not qualitative, differences in translational and rotational values.
The change of force and moment coefficients acting on the store for Fz min and Fz max belonging to the dynamic numerical solution for S CC D A (a) the force coefficient acting along the x-axis, (b) the moment coefficient acting around the z-axis, (c) force coefficient acting along the y axis, (d) moment coefficient acting around the x-axis, (e) force coefficient acting along the z-axis, (f) moment coefficient acting around the y-axis.

Linear and angular velocities: In Figs 20 and 21, linear and angular velocities, as well as translational and rotational values, are presented for two different release times of a store subjected to the same launch force. The analysis reveals that both linear and angular velocities are minimally affected by the release time. There’s a slight difference regarding translational values, with 5mm less displacement on the y-axis and equal displacement on the x and z-axes when the store is released at the maximum normal force state. For rotational values, a similar trend is observed, with slightly more rotation in pitch and yaw when the store is released at the maximum normal force state.
Store velocities for Fz min and Fz max of S CC D A dynamic numerical solution (a) x-axis linear velocity component, (b) z-axis angular velocity component, (c) y-axis linear velocity component, (d) x-axis angular velocity component, (e) z axis linear velocity component, (f) y-axis angular velocity component.

Store movement values for Fz min and Fz max belonging to the S CC D A dynamic numerical solution (a) displacement along the x-axis, (b) rotation around the z-axis, (c) displacement along the y-axis, (d) rotation around the x-axis, (e) displacement along the z-axis, (f) rotation about the y-axis.

Notably, the store, regardless of release time, essentially follows the same trajectory, suggesting that the time when the normal force in the z direction is at its maximum or minimum does not significantly impact the outcome, as observed in the literature.
5.0 Conclusions
This study explored the relationship between release timing and store trajectory during internal store separation in a clean cavity with a length-to-depth (L/D) ratio of 5. A generic store, similar to the one used in the Eglin Air Force Base experimental study, was released at two distinct moments, when the gravitational force axis was subject to maximum and minimum forces. While the store’s trajectory showed quantitative differences between these two release times, qualitatively they followed a similar path, leading to the store’s flap contacting the cavity door during exit. This suggests that optimal release timing alone may not fully prevent collision risks, and further investigation into additional influencing factors is necessary.
OASPL: The study found that the maximum OASPL values at the store’s rear flaps exceeded 170dB. These findings reinforce the inherent risks of releasing a store from a cavity with suboptimal design, as high sound pressure levels can damage the store and surrounding structures, regardless of the release time. The findings from this study further corroborate existing knowledge that larger stores, occupying a significant volume within the cavity, tend to dampen acoustic energy. This characteristic underscores the importance of considering the acoustic dynamics of various store types in future research. Moreover, exploring modern munitions, such as the small diameter bomb (SDB), may offer valuable insights into unique aerodynamic challenges, particularly due to their stowed control surfaces, which could result in pronounced roll moments during separation. Investigating these advanced stores will be essential for enhancing our understanding of internal store dynamics and improving separation reliability.
Dynamic nature of cavity flow: The study underscored the transient, time-dependent nature of cavity flow, which has a significant impact on the forces and moments acting on the store during separation. Given this unsteadiness, static force measurements – particularly along the z-axis, which drives separation – are insufficient to determine the optimal release time. The transient behaviour also explains some of the discrepancies in trajectory observed during the validation process, as the flow inside a cavity at transonic conditions is inherently unsteady. This unsteadiness makes cavity flow a statistical problem, requiring a large number of simulations across varied release conditions to develop a comprehensive understanding of store behaviour.
Flow control methods: The findings further highlight the importance of active and passive flow control techniques in managing cavity flow during internal store separation. These methods are critical not only for achieving reliable store trajectories but also for mitigating sound pressure levels.
Future directions: Although this study represents a step toward understanding the complex dynamics of store release from cavities, with its focus on the effect of release timing, it acknowledges limitations in scope. Given the evolving design of modern weapon bays, which increasingly house slender, long missiles that experience unique aerodynamic challenges such as adverse pitching moments, future research should extend beyond the current study’s scope. Investigating a broader range of stores, including those with distinct aerodynamic characteristics like larger roll moments, will provide a more comprehensive understanding of store separation dynamics. Such an approach, combined with varying cavity configurations, will contribute to more robust and generalised solutions for ensuring safe and reliable separation in modern military applications.
In conclusion, while this research provides valuable insights into internal store separation, the results indicate that despite releasing the store at two different times – when the force acting in the z-direction was at its maximum and minimum – the store followed a similar trajectory. This suggests that release timing may not be as critical as previously thought. Instead, ensuring a safe separation trajectory requires the implementation of effective flow control mechanisms to manage the unsteady dynamics within the cavity. The complex interplay of aerodynamic forces, sound pressure levels, and the transient nature of cavity flow requires more extensive simulations and experimental validations to ensure safe and effective store separation in modern military applications.
Acknowledgement
Numerical analyses in this study were run on the National Center for High Speed Computing UHEM (http://en.uhem.itu.edu.tr/).