Implications
Evolution of livestock farming systems in mountain and other less-favoured areas is not homogeneous and depends on multiple specific factors: technical, economical, environmental and social. However, there are also general driving forces that are affecting both the process of abandonment of farming in these areas and the changes that occur in the remaining farms. We need to know how and why farming systems evolve if we want to design better-targeted agro-environmental and rural development policies in these sensitive areas.
Introduction
Grazing livestock systems play a central role in rural development and in conservation of natural resources in mountain areas in Europe (McDonald et al., Reference McDonald, Cabtree, Wiesinger, Dax, Stamou, Fleury, Gutierrez and Gibon2000; Casasús et al., Reference Casasús, Bernués, Sanz, Villalba, Riedel and Revilla2007). These areas have great relevance in environmental and social terms, holding large ecological, landscape and cultural diversity; moreover, agricultural policies currently recognise their multiple functions: productive, environmental and societal (Laurent et al., Reference Laurent, Maxime, Mazé and Tichit2003; Gibon, Reference Gibon2005). But important changes have occurred since 1950, when modernisation of agriculture and the new economic and commercial relationships established between mountain and more favoured areas caused depopulation and a continuous reduction of livestock farming. Significant changes in land use were observed (Lasanta-Martínez et al., Reference Lasanta-Martínez, Vicente-Serrano and Cuadrat-Prats2005) with large implications for the sustainability of grazing agro-ecosystems (Bernués et al., Reference Bernués, Riedel, Asensio, Blanco, Sanz, Revilla and Casasús2005).
An important feature of current livestock farming systems in mountain and other less-favoured areas is their great diversity (Ruben and Pender, Reference Ruben and Pender2004). Farming systems are not only diverse, but also very dynamic and, therefore, agricultural land use is constantly changing in response to biophysical and socio-economic drivers (Mottet et al., Reference Mottet, Ladet, Coqué and Gibon2006). In general terms, the diversity of farming systems and the changes observed in time can be interpreted as attempts of farmers to adapt to three groups of factors (Manrique et al., Reference Manrique, Olaizola, Bernués, Maza and Saez1999; Veysset et al., Reference Veysset, Bebin and Lherm2005a): (i) the general socio-economic environment, predominantly influenced by agricultural policies; (ii) specific local/regional factors relative to farm location, which determine production potential, access to inputs and outputs markets, etc.; and (iii) internal characteristics of the household, including structural, economic and sociological (Bryden, Reference Bryden1994).
In terms of the general socio-economic context that surrounds ruminant livestock faming in Europe, the Common Agricultural Policy (CAP) plays a central role. CAP 1992 (expanded by the Agenda 2000) implemented compensation payments and extensification policies that have caused enlargement of herd sizes and great dependency on subsidies (Veysset et al., Reference Veysset, Lherm and Bebin2005b); production objectives declined and, to a large extent, farmers’ gains were based on maximising the capture of premiums. The mid-term review of the CAP implied decoupling of subsides from production and a progressive regression of economic support, which might result in changes in the observed trends as a consequence of new adaptation strategies of farmers. Other general socio-economic factors derived from the bovine spongiform encephalopathy crisis or the evolution of input and output prices can also be mentioned.
A second group of factors determining farming systems evolution depend on a regional/local scale. Specific location determines the farm agro-ecological potential, market access for inputs and outputs and also the value of the land (Geoghegan et al., Reference Geoghegan, Wainger and Bockstael1997). In the Pyrenees, the price of land is largely determined by the existence of other economic activities such as tourism development and urbanisation. Although tourism development is pointed out as a complementary economic activity for agricultural households in mountain areas (Flamant et al., Reference Flamant, Béranger and Gibon1999; Riedel et al., Reference Riedel, Casasús and Bernués2007), this is not always the case; for example, Teruel et al. (Reference Teruel, Bernués and Caudevilla1995) and Marin-Yaseli and Lasanta-Martínez (Reference Marin-Yaseli and Lasanta-Martínez2003) described a process of competition rather than mutual benefit between tourism and farming activities in the Spanish Pyrenees. Moreover, tourism and urbanisation compete not only for land but also for labour, both contracted and family labour (Bernués et al., Reference Bernués, Riedel, Asensio, Blanco, Sanz, Revilla and Casasús2005).
Finally, a third group of factors that modulates the evolution of mountain agriculture refer to the internal structure and economics of the farm and, increasingly important, the social context and sociological features of the farmer and his/her family. One fundamental aspect that explains the permanent disappearance of farming and subsequent abandonment of large pastoral areas in the Pyrenees is the lack of continuity of agricultural households (Bernués et al., Reference Bernués, Riedel, Asensio, Blanco, Sanz, Revilla and Casasús2005; Riedel et al., Reference Riedel, Casasús and Bernués2007). Lack of continuity is directly related to the presence and number of descendants in the household, but other aspects are also involved. One of the most relevant ones is the high opportunity cost of household labour, especially for the younger family members.
Within this complex context, system dynamic studies become essential, not only to understand the changes that occurred in the past and identify what were the main drivers but also to forecast the changes that might happen in the future. If we can anticipate the evolution of farming systems, we might as well be able to support the design of more effective policies.
The objectives of the study were as follows: (i) to analyse the main changes that occurred in cattle farming systems in the Pyrenees in the period 1990 to 2004; (ii) to typify diverse trajectories of evolution of these farming systems; and (iii) finally, to identify drivers of change, i.e. relationships between the specific trajectories of evolution and a number of variables referring the farmer’s family, internal farm factors and its socio-economic environment.
Material and methods
Area of study and data collection
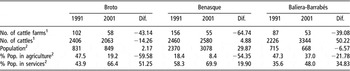
Three valleys of the Spanish Central Pyrenees were considered in this study (Broto, Benasque and Baliera-Barrabés valleys). These valleys group 12 municipalities (2, 7 and 3, respectively) located in Huesca (Aragón Region), with an area of 104600 ha, ranging from 900 to 1450 m a.s.l. The current situation and recent evolution of agriculture, population and importance of economic sectors is different across valleys (Table 1). In Broto valley, the number of cattle farms and population working in agriculture decreased drastically between 1991 and 2001 (with a corresponding increase of population working in the services sector). The number of cattle decreased but human population was stationary. In Benasque valley, which in 1991 had already a clear orientation towards tourism, agriculture further reduced its importance. However, population increased significantly. Baliera-Barrabés valley retained a predominant orientation towards agriculture (smaller decrease of cattle farms and population working in agriculture, large expansion of cattle numbers), but population decreased in the period considered.
Agriculture and socio-economic data of Broto, Benasque and Baliera-Barrabés valleys (1991 and 2001)

Dif. = difference; Pop. = population.
1Own data. Final date is 2004 instead of 2001.
2Source from the Instituto Aragonés de Estadística, Aragón, Spain (www.aragon.es).
Data were obtained by means of direct interviews with farmers. The questionnaire was fully structured and gathered detailed information on farm structure, family composition and labour, management and economic performance, referring to 1-year production cycle.
The sample was designed according to previous studies in the same areas (Olaizola, 1991; Bernués, 1994), so that the information would be available in the same farms in two dates: 1990 and 2004. Initial sampling was non-probabilistic by quotas (stratified by farm location and herd size) and represented 31.4%, 21.2% and 41.4% of total cattle farms in Broto, Benasque and Baliera-Barrabés valleys, respectively. From the initial sample of 101 farms, 30 disappeared within the time interval of the study, so the final size of the sample in 2004 was 71 farms (representing 37.9%, 38.2% and 52.8% of the total cattle farms in Broto, Benasque and Baliera-Barrabés valleys, respectively).
Secondary information on socio-economic indicators, such as human population, economic activity by sectors, farm and animal census, etc., was collected at the municipal level from official statistics.
Data analysis
Analysis of farm evolution
General changes that occurred in the constant sample of farms during the period of study were analysed with a paired t test to compare differences between dates. Differences in 1990 between later on disappeared farms and active farms were analysed with a Student’s t test. For qualitative variables, χ 2 analysis was carried out in both cases.
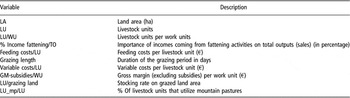
Once the general evolution of farming systems was described, ten variables referring to farm structure, orientation of production and economic indicators were selected to make an in-depth analysis of farming systems’ evolution (Table 2).
Variables considered in the study of farm evolution

LA = land area; LU = livestock unit; WU = work unit; TO = total output; GM = gross margin.
The analysis of the evolution of farms in time is complex because observed changes can be due to individual intrinsic factors, linked to the specific structural characteristics of the farm, and to common factors, linked to the socio-economic environment, which varies in time. To be able to distinguish between internal (farm structure) and external (environment) farm factors, a methodology proposed in ecological sciences by Dolédec and Chessel (Reference Dolédec and Chessel1987), and later modified by Gibon et al. (Reference Gibon, Balent, Olaizola and Di Pietro1999) to analyse the evolution of demography and agricultural activity in mountain municipalities, was utilised in this study.
Dolédec and Chessel (Reference Dolédec and Chessel1987) proposed the elaboration of a data table Z composed of p variables, s observations and t dates (n = st). In our case p = 10 variables; s = 71 farms; t = 2 dates (1990 and 2004). The principle of this method is as follows:
Table Zijk indicates the normalised value of the variable k, in the date i and the farm j; variable xijk is defined as the value of the variable k, in the date i and the farm j. xi.k and x.jk are the averages per date and per farm of the k variables, respectively. With this method, it is possible to obtain six tables resulting from the decomposition of the total variance of table Zijk in three orthogonal axes: the farms, the dates and their interaction:

Y1 does not account for the effect of time in the comparison of farms; it therefore represents intra-farm trajectories but the effect of time is not separated; Y2 allows analysing differences per farm once the general common trend of evolution, time dependent, is eliminated; therefore it represents inter-farm trajectories. According to the objectives of our research, the Y2 table was analysed.
Principal components analysis (PCA) with varimax rotationFootnote 1 was performed on table Y2 to reduce its size and obtain the main factors (eigenvalues >1) that summarised the changes observed. A hierarchical cluster analysis (CA) (with squared Euclidean distance and Ward’s aggregation method) was carried out on the main factors of the PCA to establish a typology of farms according to their pattern of evolution. These methodologies have been used extensively in farming systems research (Landais, Reference Landais1996; Köbrich et al., Reference Köbrich, Rehman and Khan2003).
Analysis of drivers of change
The relationships between the farms’ patterns of evolution (dependent variable) and other explanatory variables were analysed using discriminant analysis. The pattern of evolution was used instead of the specific trajectories because some had insufficient number of observations, which invalidates the method. The objective of this method in our study was descriptive (Hair et al., Reference Hair, Black, Babin, Anderson and Tatham2006); the discriminant function analysis was used to determine which variables discriminated between types of farms, i.e. to identify drivers of farm evolution. Similar approaches have been used to analyse land-use changes as a consequence of evolution of agricultural activities (Rasul et al., Reference Rasul, Thapa and Zoebisch2004; Lasanta-Martínez et al., Reference Lasanta-Martínez, Vicente-Serrano and Cuadrat-Prats2005).
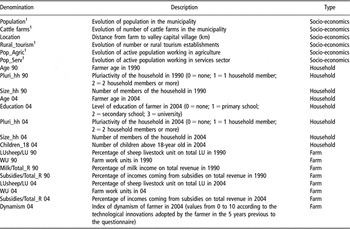
A key issue in discriminant analysis is the selection of independent explanatory variables, which need to be normally distributed and their means and variances not correlated (Hair et al., Reference Hair, Black, Babin, Anderson and Tatham2006). Twenty-two variables that had not been utilised in the previous analysis of patterns of evolution were initially selected according to the type of information: (i) characteristics of the socio-economic environment; (ii) of the farm structure and orientation; and (iii) of the household (Table A1, Appendix A).
To reduce the number of explanatory variables, facilitate the interpretation of discriminant functions and ensure the requirements of normality and reduce the multicolinearity among the independent variables, a PCA on these variables was performed.
A forward stepwise discriminant analysis was carried out on the new variables (factors) resulting from the PCA. This method involves entering the independent variables into the discriminant function one at a time on the basis of their discriminant power, determining the optimal combination of variables so that the first function provides the most overall discrimination between groups, the second provides the second most, and so on (Hair et al., Reference Hair, Black, Babin, Anderson and Tatham2006).
Results
General evolution of cattle farming systems
Farm abandonment
As mentioned in the methodology section, 29.7% of the initial sample under study abandoned farming activities. According to information provided by farmers associations and veterinary officers in the areas of study, the main causes were as follows: retirement of farmers (12 farms); substitution with other economic activities (10 farms), of which the most important one was tourism; seven farms sold the animals to other farms but no further specifications could be obtained; and finally, two farms merged into one. Abandonment was more intense in Benasque (36.4% of initial sample), followed by Broto (31.3%) and Baliera-Barrabés (21.6%).
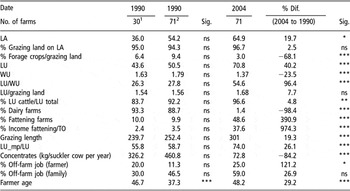
Few dissimilarities were observed in 1990 between farms that disappeared later on and active farms in 1990 (Tables 3 and 4). Farms that disappeared during the time interval of the study presented significant older farmers’ age (P < 0.001) and higher importance of subsidies on the farm gross margin (GM) (P < 0.05). Other variables presented slight differences that were not significant.
Evolution of farm structure, labour, productive orientation and management (1990 to 2004)

Sig. = significance; Dif. = difference; LA = land area; LU = livestock unit; WU = work unit; TO = total output; ns = non-significant.
1Farms disappeared in 2004.
2Active farms in 2004.
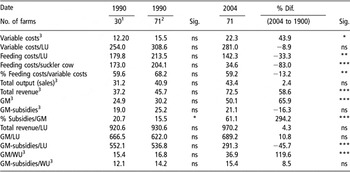
Evolution of costs, economic performance and productivity (1990 to 2004)

Sig. = significance; Dif. = difference; LU = livestock unit; GM = gross margin; WU = work unit; ns = non-significant.
1Farms disappeared in 2004.
2Active farms in 2004.
3(000€).
*P < 0.05; **P < 0.01; ***P < 0.001. Figures in constant monetary value 2004 (€).
Evolution of farm structure, labour, productive orientation and management
Structure of farms, orientation of production and management of cattle farming systems changed considerably in the period of study (Table 3).
Land area (LA) increased in general in all farms (grassland, meadows and forage crops). Agricultural crops were negligible and forage crops (mostly alfalfa, vetch and forage oats) decreased (P < 0.001). Herd size increased markedly in all areas. The importance of sheep and goat decreased (P < 0.01), so we can consider the beef farming systems as fully specialized.
All households had a family character with null or very little salaried labour. Labour input (work unit (WU))Footnote 2 decreased notably in the period of study (P < 0.001); this reduction constituted a significant structural change of farms as the number of animals handled by a WU increased an average of 27 livestock unit (LU). Off-farm activities of both the farmer (P < 0.05) and other members of the household increased. Age of farmers increased significantly, suggesting little succession of younger farmers (P < 0.001).
Orientation of production suffered a drastic change in this period. Mixed beef (weaned calves)-dairy farms, which constituted around 90% of the initial sample, have completely disappeared. At the same time, many farmers expanded their production cycle to produce young bulls and heifers (10- to 12-months old). On-farm fattening activities, either individually or in a cooperative way, took place in nearly 50% of the farms in 2004.
In agreement with the change of productive orientation, farm management also changed significantly in the period of study. One of the main factors of change was the extension of the grazing season, so winter housing period decreased to 2 months on average. The proportion of animals that use supraforestal mountain pastures increased in all areas. External inputs decreased acutely in importance; the use of off-farm concentrates to feed suckler cows dropped 388 kg/cow per year in average (P < 0.001). In economic theory, intensification means the maximisation of productivity of the scarcest factor, which normally means an increase of consumption of the other factors (Tirel, Reference Tirel1991), so the reduction in the use of external inputs constitutes another indication of extensification.
Evolution of costs, economic performance and productivity
Average variable costs increased due to the bigger size of farms (Table 4). Nevertheless, when expressed on a per-head basis, this indicator decreased slightly (ns). In agreement with what was described above, feeding costs diminished; this was specially the case when only the costs assigned to suckler cows (excluding fattening feedstuffs) were considered (from 204 to 35 € cow/year) (P < 0.001).
In relation to the structure of variable costs, off-farm feedstuffs continued to be the largest component, although in declining relative importance (around 60% of total variable costs). As could be expected, average economic size increased, partially related to the physical size (land and herd) of the farms. Both total output (sales of agricultural products) and total revenue (total output + subsidiesFootnote 3) increased, although differences were not significant when subsidies were not considered. In a similar way, GM (GM = total revenue – variable costs) increased significantly (P < 0.001). However, when subsidies were removed from the calculation, GM decreased slightly (ns). Subsidies represented 61% of GM in 2004 and only 15% in 1990.
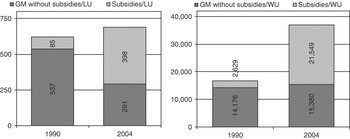
Herd productivity (GM/LU) increased, but only due to the weight of premiums (Figure 1) (P = 0.14); when subsidies were removed from the calculation of GM, animal productivity decreased 46% (P < 0.001). Labour productivity (GM/WU) improved substantially (P < 0.001; 120% in average); however, when subsidies were removed, labour productivity only increased slightly (ns).
Evolution of animal (LU) and labour (WU) productivity (1990–2004). Figures in constant monetary value 2004 (€).

Patterns and trajectories of evolution
Once changes were described globally, the next step was to identify the specific patterns and trajectories of evolution shown by active farms in 2004 through the PCA on the Y2 table and cluster analysis.
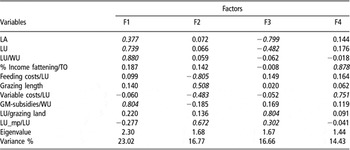
Four factors with eigenvalue above 1 were obtained that explained more than 70% of the total variance (Table A2, Appendix A). These factors could be identified as ‘directions of change’ and defined as follows:
Factor 1 (size) indicated changes in size of operation and labour productivity. Increments in herd size, and to a lesser extent land size, were related to a greater number of LU handled and GM before subsidies per WU.
Factor 2 (extensification) was defined by changes in the utilisation of natural resources and off-farm inputs. Increments on the grazing periods were linked to a larger proportion of LU that used mountain pastures; these were inversely related to variable costs per LU (lower use of off-farm feedstuffs).
Factor 3 (stocking rate) expressed changes of stocking rate on farm grazing land. Higher stocking rates (and to a lesser extent greater use of mountain pastures) were related to lower increments of LA and also herd size.
Factor 4 (fattening) expressed the change in orientation towards on-farm fattening of calves, which was linked to higher variable costs.
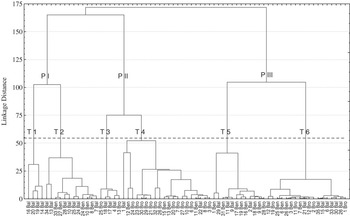
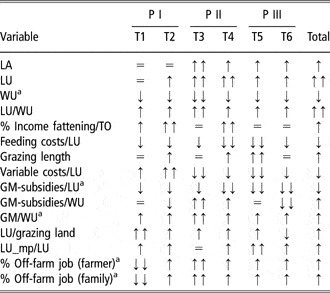
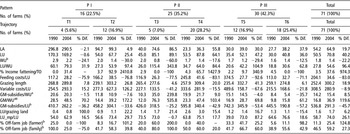
The graphical output of the cluster analysis, considering the scores of farms on the factors above, is represented in Figure 2. It could be observed that three large groups of farms followed what we called ‘patterns of evolution’ (P), which could be sub-divided in smaller groups characterized by specific ‘trajectories of evolution’ (T). The main changes that implied these patterns and trajectories of evolution are summarised in Table 5. The number of farms and quantitative changes per pattern and trajectory are detailed in Table A3 (Appendix A).
Cluster of patterns and trajectories of change. P = patterns, T = trajectories. Squared Euclidean distance and Ward’s aggregation method.

Trends observed in patterns and trajectories of evolution

LA = land area; LU = livestock unit; WU = work unit; TO = total output; GM = gross margin.
aSupplementary variable (not included in principal components analysis).
Pattern of evolution PI (T1 and T2) observed in 22.5% of farms was characterized by a situation of relative stability in terms of farm structure (LA and herd size). Therefore, PI could be named as ‘structural equilibrium’.
Trajectory T1 (5.6% of farms) was observed in the four largest farms that showed no changes of land and herd size. Due to the reduction of labour, the number of heads managed per WU increased. It is the only T where unitary variable costs have increased slightly, despite the reduction of feeding costs of the suckler cows. Stocking rate increased proportionally more than in other T, but still was the lowest. Pluriactivity of both the farmer and household decreased strongly in the period of study. It could be named as ‘large size with no changes of structure and management’.
Trajectory T2 (16.9% of farms) also grouped big farms with stable LA and relatively small increase of herd size. This T is defined by the strongest change of orientation towards fattening, with a large increment of variable costs per LU. Despite the reduction of labour, this is the only T where a reduction of labour productivity (GM/WU) before premiums was observed. The grazing period increased significantly and also the percentage of animals that use mountain pastures. As in the general sample, pluriactivity of farmer and family increased. T2 could be named as ‘medium-large size with no structural changes and fattening orientation’.
Pattern of evolution PII (T3 and T4) observed in 35.2% of farms was characterized by a large increment of physical size, both in land and in herd. It can therefore be named as ‘large structural growth’.
Trajectory T3 (7% of farms) was observed in medium-size farms that experienced the largest increment of land and herd, which doubled in the period of study. The increment of herd, together with a drastic reduction of labour, causes the largest capital intensification of all groups (LU/WU = 115). Unitary feeding and variable costs, already very low in 1990, decreased till the lowest figures of all groups in 2004. Labour productivity, both including and excluding subsidies, was the largest of all groups. Also this T was characterized by the largest increase of farmer and household off-farm activities. T3 could be named as ‘large growth, labour reduction and no fattening orientation’.
Trajectory T4 (28.2% of farms) grouped small farms that experienced a moderate increase of land and, likewise T3, large increase in animal numbers. Stocking rate therefore was the highest of all groups and number of animals per working unit increased significantly. There was a strong specialisation towards fattening activities and unitary variable costs decreased to a lower extent than in other groups. This T meant also a significant enlargement of the grazing period and the use of mountain pastures by suckler cows. Labour productivity was high in 1990, and remained so in 2005. T4 could be named as ‘large herd growth and fattening orientation’.
Pattern of evolution PIII (T5 and T6) observed in 42.3% of farms was also characterized by an increment of physical size, although much less important than in PII. This pattern was observed in farms whose herds were comparatively small at both the initial and final time of the study. Non-relevant orientation towards fattening activities could be observed in PIII. It can therefore be named as ‘moderate structural growth’.
Trajectory T5 (16.9% of farms) was observed in farms that experienced moderate increases of land and herd and at the same time showed a reduction of labour; therefore, the number of animals managed by WU doubled. This T was characterized by an intense process of economic (large decrease of unitary feeding costs and total variable costs) and grazing management extensification (large increment of grazing period and use of mountain pastures). The decrease of animal productivity was very sharp, but labour productivity (before premiums) could be maintained. As in T3, off-farm activities increased considerably, but in this case the levels of pluriactivity were already high at the beginning of the study. T5 could be named as ‘moderate growth and great extensification’.
Trajectory T6 (25.4% of farms) grouped the smaller farms, both at the beginning and at the final year of study, which also experienced moderate increases of land and herd. Reduction of labour was proportionally smaller than in other T, which resulted in the lowest number of animals managed per WU. Despite increases in grazing period and use of mountain pastures, these changes were of less importance than in other T. Feeding costs and total variable cost per LU were the lowest in 1990 and decreased further along the period of study; nevertheless, this decrement was less intense than in other T. Both animal and labour productivity decreased intensely to the lowest levels. Off-farm jobs were very infrequent in farmers. T6 could be named as ‘small growth and decrease of productivity’.
Drivers of change
The analysis of drivers of farm evolution was carried out using discriminant analysis. The independent variables were obtained from a PCA carried out on 22 variables, as explained in the methodology section. Eight factors explaining 73.8% of the total variance and eigenvalue >1 were obtained (Table 6).
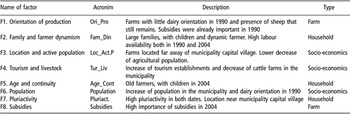
Definition of factors (drivers of change) derived from the principal components analysis

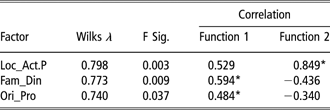
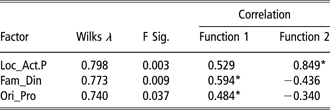
The stepwise process resulted in the incorporation of three factors (location and active population, family and farmer dynamism and orientation of production) that showed significant differences between patterns (P < 0.05) and therefore had discriminatory power (Table 7).
Test statistics of discriminant analysis and correlation coefficients of factors on discriminant functions
Sig. = significance.
Step 3. F to enter 0.05; F to remove 0.06; Test Box’s M 26.273; sig. 0.018.
*Highest absolute correlation of factors.
Loc_Act.P: farms located far away of municipality capital village. Lower decrease of agricultural population.
Fam_Din: large families, with children and dynamic farmer. High labour availability both in 1990 and in 2004.
Ori_Pro: farms with little dairy orientation in 1990 and presence of sheep that still remains. Subsidies were already important in 1990.
Two discriminant functions were obtained in the analysis (n patterns of evolution – 1) that explained 100% of variability. The first function explained 69.9% of variance and the second function 30.1%. The relationship between discriminant functions and original factors is explained through correlation coefficients (Table 7). All factors were positively correlated to function 1, but factors referring to the family and dynamism of the farmer (Fam_Din) and orientation of production (Ori_Pro) presented the highest absolute values. Factor referring to location and percentage of active population in agriculture (Loc_Act.P) was highly correlated with discriminant function 2, although values of the other two factors were also significant.
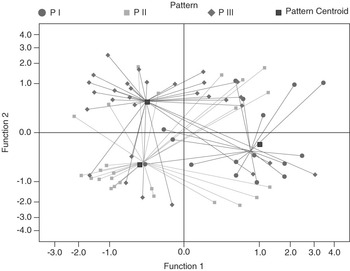
Figure 3 shows that the three patterns of evolution were distinct; their centroids (group means) and the discriminant Z scores were separated but there was overlap of individual cases. The first discriminant function separated the PI structural equilibrium from the other two. The second discriminant function separated PII and PIII (large from moderate structural growth).
Scatter plot of pattern centroids and farms.

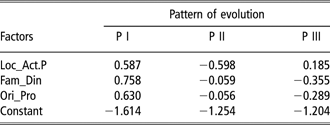
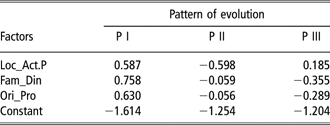
Finally, the classification function coefficients presented in Table 8 showed the relationships between explanatory variables (drivers of change) and the patterns of evolution as defined in the previous section.
Relationship between drivers of change and patterns of evolution
Loc_Act.P: farms located far away of municipality capital village. Lower decrease of agricultural population.
Fam_Din: large families, with children and dynamic farmer. High labour availability in both 1990 and 2004.
Ori_Pro: farms with little dairy orientation in 1990 and presence of sheep that still remains. Subsidies were already important in 1990.
Pattern of evolution PI (T1 and T2) of structural equilibrium was mainly related to Fam_Din and Ori_Pro. In other words, large cattle farms that remained stationary in terms of size in the period of study presented larger families with high availability of family labour and a high index of farmer dynamism. Also, these were farms that already in 1990 had mixed beef-sheep orientation but no dairy, were located far away from the municipality capital and showed a high level of farmer’s education.
Pattern of evolution PII (T3 and T4) of large structural growth was related negatively with Loc_Act.P; i.e. farms that showed the greater changes in the period of study were located close to capital municipality villages, where the population working in agriculture decreased more than in other areas (higher increase of the tertiary sector).
Pattern of evolution PIII (T5 and T6) of moderate structural growth was inversely related to Fam_Din and Ori_Pro and positively related to Loc_Act.P, although absolute values were low. Farms that showed this pattern of evolution presented smaller families with lower availability of labour and degree of farmer dynamism. They tended to be located far away from capital municipality villages where the percentage of population working in agriculture decreased less than in other areas and their orientation in 1990 was mainly dairy.
Discussion
Evolution of cattle farming systems
Abandonment of farming had two main causes: farmer’s retirement and substitution of agriculture with other activities related to tourism. Apart from the farmer’s age, differences encountered in 1990 between farms that were abandoned later on and active farms were not so large and might be rather assigned to specific characteristics of farms in the process of disappearance, i.e. in the final stages of their life-cycle. It is therefore reasonable to assume that structural and economic features of farms that moved into the tourism sector did not differ significantly from those of households that kept farming business as the main or secondary activity. As Bryden (Reference Bryden1994) stated, understanding the farm household adaptation over time requires an analysis of the interrelationships between the farm, the farmer, the family and its context.
In farms that remained active, the introduction of the EC milk quotas in 1984 coupled with specific national programmes to discourage milk production was a major factor in the total disappearance of dairy activities (Olaizola et al., Reference Olaizola, Manrique, Bernués and Maza1996). This modification of productive orientation, accompanied by the partial substitution of type of product (weaned v. fattened calves), helps explain many of the general changes observed in cattle production systems in the area of study.
A clear process of extensification could be observed, in terms of both greater use of natural resources and lesser use of off-farm inputs (mainly feedstuffs). Nevertheless, the concepts of intensification and extensification are relative and dynamic, referring rather to a trend than to a stationary situation (Tirel, Reference Tirel1991). As we have seen, intensification means the maximisation of productivity of the scarcest factor, which traditionally was the land, but in the last decades labour force has become the most difficult factor to pay back in Europe (Strijker, Reference Strijker2005).
The extensification of land use (enlargement of the grazing period; higher use of mountain pastures, increment of grazing areas and decrement of forage crops) meant a substitution of purchased inputs with on-farm resources; consequently, unitary variable costs per LU and ha of LA decreased, which constitutes a clear indicator of economic extensification (low-input systems). However, differences were not significant in the global sample due to the importance of fattening activities in 50% of the farms. A dual production system, with diverging trends of extensification in the suckler herd (linked to land resources) on the one hand, and intensification of the fattening herd (landless) on the other hand, could be observed.
Then again, the significant increase of land and especially animals managed per WU could be interpreted as a process of capital intensification. The sharp decrease of sales outputs per animal, mainly due to the abandonment of dairy, forced farmers to increase the number of animals per farm to compensate for the loss of unitary income. This was largely determined by the CAP premiums paid on the per-head basis. In this way, labour productivity (GM/WU), which constitutes a crucial indicator of the chances of reproducibility of the farm and therefore its social sustainability, could be maintained (12% increment before premiums; 124% increment including premiums). This process meant a strong structural adjustment, also reported in other mountainous areas in Spain (Serrano et al., Reference Serrano, Giráldez, Lavín, Bernués and Ruiz-Mantecón2004) and other countries (Veysset et al., Reference Veysset, Lherm and Bebin2005b). According to the last authors, after CAP 1992, the size of the farm in ha and animals was not determined by the outputs they could generate, but by the subsidies the farmer received.
The significant decrease of labour dedicated to farming (from 1.8 to 1.4 WU on average) also contributed decisively to the maintenance of labour productivity (before premiums) described above. Reduction of family labour force dedicated to farming and substitution with off-farm activities, in this area mostly related with tourism, were clearly observed for both the farmer and the whole household (60% of farms). Some authors mention that the coexistence of several economic activities complements the family income and, therefore, helps maintain farming population in rural areas (Safilios-Rothschild, Reference Safilios-Rothschild2003; Riedel et al., Reference Riedel, Casasús and Bernués2007). However, Teruel et al. (Reference Teruel, Bernués and Caudevilla1995) described a process of competence of tourism in the neighbouring valleys of the Pyrenees. This is caused by the high opportunity cost of family labour (Bernués et al., Reference Bernués, Riedel, Asensio, Blanco, Sanz, Revilla and Casasús2005), partly explained by the relative low prices of agricultural commodities (Strijker, Reference Strijker2005), and the high opportunity cost of land for urbanisation (Olaizola, 1991). In the time interval of our study, at least in 30% of disappeared farms, farmers substituted completely agriculture with tourism activities; relationships between agriculture and other economic activities of the household will be further discussed in the following section.
Despite the general trends described above, very much influenced by agricultural policies and general socio-economic context, farm evolution can vary widely as our typology shows, depending on specific internal or local/regional factors.
Drivers of change
The three variables defining discriminant functions in the DA belonged to factors that can influence farmer adaptation strategies described in the introduction: (i) local/regional factors such as location of the farm and evolution of active population; (ii) characteristics of the household such as family size, presence of children and dynamism of the farm operator; and (iii) internal characteristics of the farm such as initial orientation of production.
Family size, presence of children and dynamism of the farm operator was the variable that most contributed to the first discriminant function in DA. Pattern of evolution with structural equilibrium (PI: big farms with high levels of labour productivity) showed a high positive correlation with this function, whereas pattern of moderate structural growth (PIII: small farms with low levels of labour productivity and continuity jeopardised in T6) showed a negative correlation. As other authors have shown before, size of the holding and particular characteristics of the farm operator have a strong influence on how successful intergenerational transfer is carried out (Aldanondo et al., Reference Aldanondo, Casanovas and Almansa2007) and therefore play a central role in farming continuity and evolution. In general, innovative farmers with higher levels of education entail greater farm profitability that renders farming more attractive for prospective successors (Corsi, 2006).
The initial situation of the farm, both in economic size and in orientation of production, was, as could be expected, determinant in the specific pathway of evolution, as signalled previously in other studies (Veysset et al., Reference Veysset, Lherm and Bebin2005b; Mottet et al., Reference Mottet, Ladet, Coqué and Gibon2006). Farms of PI showed an initial situation in 1990 of large size and beef orientation, and therefore little changes were observed. In opposition, farms of PII and PIII, with smaller sizes and greater dairy orientation in 1990, were forced to adapt their production system and structures under the CAP measures implemented in 1992, presenting different strategies. The change of orientation towards fattening in T2 and T4 did not imply an improvement of labour productivity before premiums and therefore could indicate an opportunistic behaviour of these farmers, trying to maximise the capture of subsidies (Veysset et al., Reference Veysset, Lherm and Bebin2005b).
Location of the farm close to the municipality capital was related to farms with large structural growth (PII). These farms also showed the largest increase of off-farm employment in the period of study and implemented important structural changes. Off-farm job opportunities would mean, for these farms, better chances of continuity (Aldanondo et al., Reference Aldanondo, Casanovas and Almansa2007). An opposite trend was observed in the pattern of moderate structural growth (PIII) where farms tended to be located far away from the capital village. Some of these farms (trajectory 6) showed lower levels of pluriactivity and continuity of farming was in doubt in the medium term due to the low labour productivity obtained. Large farms with structural equilibrium (PI) were also located far away from the capital village, but farm structure and family characteristics were very different from PIII.
Relationships between the operator’s off-farm work choice and succession are complex. As stated by Corsi (2006), there is no monotonic pattern between the degree of part-time farming and the probability of succession. In our case, distance of the farm in relation to the centres of economic development had a dual effect: development of part-time agriculture can finally cause a displacement if the opportunity cost of family labour is very high, as we have seen in some of the disappeared farms; but on the other hand, for some households, it can mean new opportunities for income generation, as we have seen in some trajectories. The border between complementarity and displacement is vague and the final output depends not only on the opportunity costs of family labour but also on possibilities to harmonise on- and off-farm activities (McDonald et al., Reference McDonald, Cabtree, Wiesinger, Dax, Stamou, Fleury, Gutierrez and Gibon2000) and the objectives and aspirations of household members (Gasson and Errington, Reference Gasson and Errington1993).
In relation to abandonment of farming, this process was more intense in the two study areas with greater development of the tourism sector, especially in Benasque, where Lasanta-Martínez et al. (Reference Lasanta-Martínez, Laguna and Vicente-Serrano2007) described how tourism-based ski resorts in this valley contributed to increase the population but displaced agricultural activities. Similar findings were described by Gellrich et al. (Reference Gellrich, Baur, Koch and Zimmermann2007) in the Swiss Alps, where relationships between land abandonment and increases of immigrant population and part-time agriculture were observed.
Despite drivers of agricultural and land-use change being described in the literature as general processes, the consideration of individual/local responses to changing economic conditions and markets, mediated by institutional factors, offers a better framework to understand farming evolution (Lambin et al., Reference Lambin, Turner, Geist, Agbola, Angelsen, Bruce, Coomes, Dirzo, Fischer, Folke, George, Homewood, Imbernon, Leemans, Li, Moran, Mortimore, Ramakrishnan, Richards, Skånes, Steffen, Stone, Svedin, Veldkamp, Vogel and Xu2001). In the area of study, agricultural policies in the last few years have certainly shaped the way mountain farming systems evolved in general, but specific relationships between the household and the immediate socio-economic environment must be considered to understand specific trajectories of evolution.
Part-time farming is directly related to opportunities for off-farm jobs, which depend largely on tourism development, and therefore related to farm location discussed above. But relationships between agriculture and tourism, more specifically between part-time farming and continuity prospects, are not unidirectional. The coexistence of both activities seems to depend largely on the effective integration of tourism, rural development and agri-environmental policies, as in some of the areas under study a process of competition between tourism and agriculture sectors and subsequent marginalization of primary activities is observed (Lasanta-Martínez et al., Reference Lasanta-Martínez, Laguna and Vicente-Serrano2007).
Opportunity cost of agricultural labour and working conditions will remain decisive in the future. Public or private initiatives towards increasing value to mountain products through quality schemes can improve profitability in pasture-based livestock systems (Bernués et al., Reference Bernués, Olaizola and Corcoran2003). Also, technologies aiming at reducing costs and labour requirements should be stimulated by regional policy makers (for example, granting access to communal pastures and promoting grazing facilities). For these policies to be better targeted, the specific characteristics and evolution patterns of farming systems, together with the local socio-economic context, should be taken into account.
Nevertheless, these measures alone do not seem to be able to stop the decline in mountain agriculture. Policy schemes directed to pay for non-marketable environmental services provided by mountain livestock (e.g. landscape management and biodiversity) should be implemented, but for these to be equitable and socially accepted, objective indicators need to be identified, measured and priced.
Finally, we can mention that the methodological framework proposed in this research can be useful in simulation and prospective analysis of mountain agriculture evolution, as the changes expected in the future will be connected to those observed in the past in different types of farming systems identified.
Conclusions
From the empirical evidence described above, we can derive the following conclusions.
There has been a huge structural adjustment coupled with a drastic change of productive orientation in the mountain cattle farming systems in the period of study. Agricultural policies were determinant in this process.
Generally speaking, a process of extensification was observed, from the point of view of both the land use (increased grazing periods and greater use of mountain pastures) and the farm economics (substitution of off-farm feedstuffs with internal resources and reduction of unitary variable costs). This process was in agreement with the CAP objectives of extensification. Nevertheless, a dual trend could be observed, as intensive fattening activities were encouraged by certain premiums of the CAP, although farms with fattening activities did not obtain the highest labour productivity.
The general increase of herd size and the reduction of labour dedicated to farming allowed the maintenance of labour productivity (before premiums), compensating for the drastic loss of animal productivity. The premiums obtained increased by more than two, the labour productivity in constant economic terms during the time interval of the study.
Different patterns and trajectories of evolution were observed, depending on the initial situation of the farm, extent of the structural changes, changes in the use of natural resources and the diverse degree of orientation towards fattening. Farm labour reduction was common to all trajectories.
To understand the evolution of farming systems in mountain areas it is crucial to consider the household composition: household size, presence of successors and family labour opportunity costs; all these in close interaction with the immediate socio-economic environment of the farm. Specific location and evolution of other sectors of the economy, in particular tourism, will be decisive in the future.
Relationships between tourism and livestock, and more specifically between part-time farming and continuity of agricultural activities in the household, are not unidirectional and, due to their importance to determine mountain farming in the future, deserve further research.
Acknowledgement
This study was funded by INIA (Spanish Ministry for Education and Science) – FEDER, Ref. RTA03-029-C2. The first author acknowledges the financial support of CONACYT-Mexico and Fundación Carolina.
Appendix A
Tables A1–A3 mentioned in the text are provided here.
Variables considered in the study of drivers of change

LU = livestock unit.
1Calculated as (2001 to 1991)/1991 × 100.
Contribution of variables to main principal components analysis factors obtained from Y2 table

LA = land area; LU = livestock unit; WU = work unit; TO = total output; GM = gross margin.
Rotation: Varimax normalized. Kaiser–Meyer–Olkin = 0.553. Bartlett χ 2 = 426.206 (P < 0.000).
Quantitative changes of Patterns and Trajectories of evolution

Dif. = difference; LA = land area; LU = livestock unit; WU = work unit; TO = total output.
aFigures in constant monetary value 2004 (000€).
bSupplementary variable (not included in principal components analysis).