


1. Introduction
Recent developments in the design of synthetic microswimmers open new opportunities for engineering and biomedical applications (Nelson, Kaliakatsos & Abbott Reference Nelson, Kaliakatsos and Abbott2010). Popular designs closely follow locomotion strategies observed in nature, such as beating flexible appendages (Dreyfus et al. Reference Dreyfus, Baudry, Roper, Fermigier, Stone and Bibette2005) or rotating chiral filaments (Magdanz et al. Reference Magdanz2020), breaking time reversibility to ensure for the propulsion of such small-scale swimmers in viscous environments (Purcell Reference Purcell1977; Lauga & Powers Reference Lauga and Powers2009). But in contrast to their biological counterparts, these synthetic bio-mimetic swimmers essentially behave as marionettes (Brooks & Strano Reference Brooks and Strano2020), relying on some external tether for both energy supply and motion control, such as magnetic, optic or acoustic fields (Rao et al. Reference Rao, Li, Meng, Zheng, Cai and Wang2015; Bunea & Glückstad Reference Bunea and Glückstad2019; Koleoso et al. Reference Koleoso, Feng, Xue, Li, Munshi and Chen2020). Still, practical difficulties, such as miniaturisation and manufacturing of their moving parts, have so far hindered their use for practical applications.
Active colloids stem from a fundamentally different paradigm, featuring no moving parts (Moran & Posner Reference Moran and Posner2019). Just like bacteria or other swimming cells (Berg Reference Berg1993) they are instead able to extract and convert into motion energy tapped directly from their immediate environment (e.g. non-uniform distribution of physico-chemical properties) in a mechanism known as phoresis (Anderson Reference Anderson1989). Beyond technological applications, active colloids have been central to the recent developments in the study of so-called active matter, in an effort to understand and characterise the collective dynamics and self-organisation among large suspensions of microscopic self-propelled systems (Marchetti et al. Reference Marchetti, Joanny, Ramaswamy, Liverpool, Prost, Rao and Simha2013; Bechinger et al. Reference Bechinger, Leonardo, Löwen, Reichhardt, Volpe and Volpe2016).
Surface activity of the colloid is the most popular approach to the generation of the local physico-chemical (e.g. solute) gradients required for propulsion, and can take the form of reactions catalysed by a surface coating (Howse et al. Reference Howse, Jones, Ryan, Gough, Vafabakhsh and Golestanian2007), encapsulated in a droplet (Thutupalli, Seemann & Herminghaus Reference Thutupalli, Seemann and Herminghaus2011) or rely on micellar dissolution (Izri et al. Reference Izri, van der Linden, Michelin and Dauchot2014; Moerman et al. Reference Moerman, Moyses, van der Wee, Grier, van Blaaderen, Kegel, Groenewold and Brujic2017). Combined with a mobility, namely the ability to convert local gradients along the surface into fluid motion or fluid stresses, this opens the way for the self-diffusiophoretic motion of chemically active swimmers that are able to generate themselves the local gradients into which they subsequently propel (Golestanian, Liverpool & Ajdari Reference Golestanian, Liverpool and Ajdari2007; Maass et al. Reference Maass, Krüger, Herminghaus and Bahr2016; Moran & Posner Reference Moran and Posner2017).
The fundamental propulsion features are critically impacted by the transport of chemical solutes involved in phoresis within the fluid, or more specifically, by the ratio of convective transport and molecular diffusion, measured by the Péclet number,  ${Pe}$. Based on that measure, two different classes of active colloids can be distinguished. When
 ${Pe}\ll 1$, solute transport is dominated by diffusion and is thus independent from the fluid (and colloid's) motion: this is specifically the case of classic autophoretic particles, such as the canonical Au-Pt Janus colloids (Paxton et al. Reference Paxton, Kistler, Olmeda, Sen, Angelo, Cao, Mallouk, Lammert and Crespi2004), that are typically micron scale and use small and rapidly diffusing solutes (e.g. dissolved gases, Moran & Posner Reference Moran and Posner2017). In that case, generating gradients requires embedding some asymmetry in the design of the swimmer through inhomogeneous surface activity (Paxton et al. Reference Paxton, Kistler, Olmeda, Sen, Angelo, Cao, Mallouk, Lammert and Crespi2004; Howse et al. Reference Howse, Jones, Ryan, Gough, Vafabakhsh and Golestanian2007) or an anisotropic geometry (Kümmel et al. Reference Kümmel, ten Hagen, Wittkowski, Buttinoni, Eichhorn, Volpe, Löwen and Bechinger2013; Michelin & Lauga Reference Michelin and Lauga2015). This can also be achieved through asymmetric assembly of isotropic colloids (Varma, Montenegro-Johnson & Michelin Reference Varma, Montenegro-Johnson and Michelin2018; Yu et al. Reference Yu, Chuphal, Thakur, Reigh, Singh and Fischer2018).
In contrast, chemically active droplets are relatively large (typically  $10$–
 $100\,\mathrm {\mu }$m in diameter) and their activity is based on their micellar dissolution into the outer fluid phase (Maass et al. Reference Maass, Krüger, Herminghaus and Bahr2016; Morozov Reference Morozov2020). The solutes exchanged at the droplet's surface and responsible for its propulsion are large molecular structures (surfactant, micelles,
 $\ldots$) and, thus, diffuse slowly in the fluid: advective effects are here non-negligible and
 ${{{Pe}=O(1)-O(100)}}$ (Hokmabad et al. Reference Hokmabad, Dey, Jalaal, Mohanty, Almukambetova, Baldwin, Lohse and Maass2021). Symmetry breaking is achieved through an instability resulting from the nonlinear convective transport of the solute species by the fluid flows generated from phoretic and Marangoni effects at the droplet surface (Izri et al. Reference Izri, van der Linden, Michelin and Dauchot2014; Morozov & Michelin Reference Morozov and Michelin2019b). In contrast with autophoretic particles with
 ${Pe}\ll 1$, this nonlinear hydrochemical coupling provides the droplet with complex and tunable individual behaviour (Suga et al. Reference Suga, Suda, Ichikawa and Kimura2018; Hokmabad et al. Reference Hokmabad, Dey, Jalaal, Mohanty, Almukambetova, Baldwin, Lohse and Maass2021), and can even lead to the emergence of chaotic dynamics (Hu et al. Reference Hu, Lin, Rafai and Misbah2019; Morozov & Michelin Reference Morozov and Michelin2019a).
The mechanism at the heart of the droplet's self-propulsion, i.e. the nonlinear feedback coupling between the flow and chemical fields, is mathematically and physically relevant regardless of whether the mobility stems from phoretic slip flows or Marangoni stresses, both emerging from tangential gradients in solute concentration (Michelin, Lauga & Bartolo Reference Michelin, Lauga and Bartolo2013; Izri et al. Reference Izri, van der Linden, Michelin and Dauchot2014; Morozov & Michelin Reference Morozov and Michelin2019a). In fact, both mechanisms most likely co-exist in active droplets, whose surface is densely covered by surfactant species due to the saturation of the suspending fluid. Also, in experiments, active droplets remain spherical (the relevant capillary numbers are small) except when their radius is larger than the capillary or chamber size (see, e.g. de Blois et al. Reference de Blois, Bertin, Suda, Ichikawa, Reyssat and Dauchot2021). As a result, isotropic phoretic particles can be considered in a first approximation as the limit case of swimming droplets with large internal viscosity.
Despite their systematic presence in experimental settings, due to the droplets’ non-neutral buoyancy (Krüger et al. Reference Krüger, Bahr, Herminghaus and Maass2016; Cheon et al. Reference Cheon, Silva, Khair and Zarzar2021) or as a requirement for accurate quantitative measurements (e.g. confocal microscopy Hokmabad et al. Reference Hokmabad, Dey, Jalaal, Mohanty, Almukambetova, Baldwin, Lohse and Maass2021), theoretical models most often ignore the presence of confining boundaries and focus on droplets in unbounded fluid domains, leaving unexplored their role on the emergence and persistence of self-propulsion. Recent experimental measurements have shown significant modifications of the flow field around the droplet when placed close to or between rigid walls (de Blois et al. Reference de Blois, Reyssat, Michelin and Dauchot2019), and theoretical modelling unveiled the non-trivial alterations of the hydrochemical coupling induced by confinement (Lippera et al. Reference Lippera, Morozov, Benzaquen and Michelin2020b). Beyond the influence of a single flat wall, recent experiments have also shown that self-sustained motion can also occur in strongly confined settings, such as small capillary tubes (Illien et al. Reference Illien, de Blois, Liu, van der Linden and Dauchot2020; de Blois et al. Reference de Blois, Bertin, Suda, Ichikawa, Reyssat and Dauchot2021).
Although few quantitative measurements or estimates can be found, active droplets are likely to evolve very close to their confining boundaries (Cheon et al. Reference Cheon, Silva, Khair and Zarzar2021), in a regime where classical work on lubricating flows or model microswimmers demonstrate that hydrodynamic drag (Kim & Karrila Reference Kim and Karrila1991) and self-propulsion velocities (Zhu, Lauga & Brandt Reference Zhu, Lauga and Brandt2013) are significantly modified in comparison with their characteristics in unbounded fluid domains. Significant changes in the self-propulsion of active droplets would therefore not be surprising.
The central goal of the present work is to provide a much needed insight on the sustained self-propulsion of such isotropic active particles or droplets in strongly confined settings, i.e. inside a capillary tube. In the case of diffusion-dominated diffusiophoretic swimmers  $({Pe} \rightarrow 0)$, the hydrodynamic and solute evolutions reduce to sequential linear Laplace and Stokes problems, for which a number of different numerical techniques are available, such as boundary element methods (Montenegro-Johnson, Michelin & Lauga Reference Montenegro-Johnson, Michelin and Lauga2015) or two recent extensions of hydrodynamic solvers for the diffusive problem, based on Stokesian dynamics (Yan & Brady Reference Yan and Brady2016) or the force coupling method (Rojas-Pérez, Delmotte & Michelin Reference Rojas-Pérez, Delmotte and Michelin2021).
In contrast, the numerical simulation of instability-driven, isotropic autophoretic swimmers at non-zero  ${Pe}$ poses new and specific challenges due to the inherent nonlinearity of the problem in addition to the presence of moving boundaries where chemical and hydrodynamic forcings are applied. Up to date, most simulations considering the full nonlinear hydrochemical coupling of active droplets rely on some truncated spectral expansion, mapped either onto cylindrical (Hu et al. Reference Hu, Lin, Rafai and Misbah2019), spherical (Michelin et al. Reference Michelin, Lauga and Bartolo2013) or bi-spherical coordinates (Lippera, Benzaquen & Michelin Reference Lippera, Benzaquen and Michelin2020a; Lippera et al. Reference Lippera, Morozov, Benzaquen and Michelin2020b). This approach is well suited for simple geometric configurations (e.g. unbounded flows, two-sphere interactions), but precludes the study of the dynamics of such swimmers placed under generic spatial confinement or even in a cylindrical pipe.
To overcome this hurdle, we present here a generic method to obtain the nonlinear hydrochemical dynamics of a single isotropic autophoretic particle under complex confinement using a novel approach based on embedded boundaries (Johansen & Colella Reference Johansen and Colella1998; Schwartz et al. Reference Schwartz, Barad, Colella and Ligocki2006) and developed on top of the adaptive quadtree-octree flow solver Basilisk (Popinet Reference Popinet2015). Our approach, based on a finite-volume framework, does not require any a priori assumption on the form of the hydrodynamic or chemical fields, nor on the number or shape of the solid boundaries, thus making it suitable for the study of complex confinement geometries and/or collective particle/droplet dynamics.
The paper is organised as follows. Section 2 introduces the physical problem considered, namely that of a single isotropic autophoretic particle swimming along the axis of a round capillary tube. The numerical technique used to solve the problem is then presented in § 3 together with several numerical validations. The impact of spatial confinement, i.e. the relative radius of the capillary and particle, is then analysed in detail in § 4 using this numerical method. Using global conservation arguments and lubrication analysis, § 5 then confirms theoretically the qualitative and quantitative evolution of the propulsion characteristics in the strong-confinement limit (i.e. tightly fitting sphere). Finally, we summarise our findings and outline some perspectives on this work in § 6.
2. Phoretic self-propulsion in a capillary
We consider the dynamics of a single spherical phoretic particle of radius  $a$, immersed in a Newtonian fluid of viscosity
 $\eta$ and density
 $\rho$, inside a circular capillary of radius
 $R$ and axis
 $\boldsymbol {e}_z$. The particle is chemically active and releases or absorbs a solute of concentration
 $c^*$ and molecular diffusivity
 $D$ into its fluid environment with a constant and isotropic flux
 $\mathcal {A}$ (activity), so that along the particle's boundary
 $\varGamma _p$,
 \begin{equation} \left.{D}\boldsymbol{n}\boldsymbol{\cdot}\boldsymbol{\nabla} {c^*}\right|_{\varGamma_p}={-}\mathcal{A}, \end{equation}
with  $\boldsymbol {n}$ the unit outward normal. The short-ranged interaction of solute molecules with the particle surface within a thin interaction layer of thickness
 $\lambda \ll a$ introduces an effective hydrodynamic slip
 $\tilde {\boldsymbol{u}}^*$ along the particle surface in response to local tangential solute gradients (Anderson Reference Anderson1989)
 \begin{equation} {\boldsymbol{\tilde{u}}^*} = \mathcal{M} \boldsymbol{\nabla}_s {c^*}, \end{equation}
with  $\mathcal {M} \approx k_B T \lambda ^2/\eta$ the phoretic mobility of the particle, with
 $k_B T$ the thermal energy and
 $\boldsymbol {\nabla }_s=(\boldsymbol {I}-\boldsymbol {n}\boldsymbol {n})\boldsymbol {\cdot }\boldsymbol {\nabla }$ the tangential gradient operator projected onto the particle surface. Note that taking
 $\mathcal {M}$ as a constant characteristic property of the particle surface is valid for neutral solutes, but can also be valid when concentration contrasts are small enough (Anderson Reference Anderson1989).
The activity  $\mathcal {A}$ and mobility
 $\mathcal {M}$ coefficients characterise the physico-chemical properties of the particle surface and can be positive or negative; from these, a characteristic phoretic velocity scale can be defined as
 $\mathcal {V}=|\mathcal {AM}|/D$. Given the characteristic size and velocities of confined phoretic microswimmers (de Blois et al. Reference de Blois, Reyssat, Michelin and Dauchot2019; Lippera et al. Reference Lippera, Morozov, Benzaquen and Michelin2020b; Hokmabad et al. Reference Hokmabad, Dey, Jalaal, Mohanty, Almukambetova, Baldwin, Lohse and Maass2021), the fluid and colloid inertia can be neglected, i.e. the Reynolds number
 ${Re}=\rho \mathcal {V}a/\eta$ is negligible, so that the motion of the particle can be described using the steady Stokes equations.
In the following, all quantities of interest are made dimensionless using  $a, \mathcal {V}, a/\mathcal {V}$ and
 $a|\mathcal {A}|/\mathcal {D}$ as characteristic length, velocity, time and concentration, respectively. The resulting dimensionless equations for the dimensionless flow velocity
 $\boldsymbol {u}$, pressure
 $p$ and concentration
 $c$ are
 $$\begin{gather} \nabla^2 \boldsymbol{u} = \boldsymbol{\nabla} p, \quad \boldsymbol{\nabla}\boldsymbol{\cdot}\boldsymbol{u} = 0, \end{gather}$$
 $$\begin{gather}\frac{\partial c}{\partial t} + \boldsymbol{u} \boldsymbol{\cdot}\boldsymbol{\nabla} c = \frac{1}{{Pe}} \nabla^2 c, \end{gather}$$
with  ${Pe} = |\mathcal {AM}|a/\mathcal {D}^2$, the Péclet number, which is a measure of the relative contribution of advection and diffusion to the transport of solute. The radius ratio,
 $\kappa =a/R\in [0, 1]$, is a measure of the confinement level and is the second key dimensionless parameter of the problem.
The relevant boundary conditions for the concentration field at the surface of the (active) particle  $\varGamma _p$ and (inert) confining wall
 ${\varGamma _d}$ are
 \begin{equation} \left.\partial c / \partial n \right|_{\varGamma_p}={-}A,\quad \left.\partial c / \partial n \right|_{{\varGamma_d}} = 0, \end{equation}
while, for the velocity field,
 \begin{equation} \left.\boldsymbol{u}\right|_{\varGamma_p} = \boldsymbol{\tilde{u}} + \boldsymbol{U} + \boldsymbol{\varOmega} \times (\boldsymbol{x}-\boldsymbol{X}),\quad \left.\boldsymbol{u} \right|_{{\varGamma_d}} = \boldsymbol{0}, \end{equation}
where  $\boldsymbol {U}$ and
 $\boldsymbol \varOmega$ are the translation and rotation velocities of the particle,
 $\tilde{\boldsymbol{u}}=M\boldsymbol {\nabla }_s c$ is the dimensionless phoretic slip velocity at a general point
 $\boldsymbol {x}$ on the particle surface and
 $\boldsymbol {X}$ is the position of the particle centre. The phoretic mobility of the wall is neglected here in front of that of the active particle/droplet, but could easily be accounted for within the same framework (see, e.g. Sherwood & Ghosal Reference Sherwood and Ghosal2018). Here,
 $A = \mathcal {A}/|\mathcal {A}|$ and
 $M=\mathcal {M}/|\mathcal {M}|$ denote the dimensionless activity and mobility. When
 $AM=-1$, no self-propulsion is observed for an isolated particle in unbounded flow (Michelin et al. Reference Michelin, Lauga and Bartolo2013); as our goal is to analyse the effect of confinement on self-propulsion, we consider in the following that
 $A=M=1$.
Finally, in the absence of any external force, the total hydrodynamic force and torque on the particle must vanish at all time,
 \begin{equation} \boldsymbol{F} =\int_{\varGamma_p}\boldsymbol\sigma\boldsymbol{\cdot}\boldsymbol{n}\mathrm{d} S=0,\quad \boldsymbol{T} =\int_{\varGamma_p}\boldsymbol(\boldsymbol{x}-\boldsymbol{X}) \times(\boldsymbol\sigma\boldsymbol{\cdot}\boldsymbol{n})\,\mathrm{d} S=0, \end{equation}
with  $\boldsymbol \sigma =-p\boldsymbol {I}+\boldsymbol {\nabla }\boldsymbol {u}+\boldsymbol {\nabla }\boldsymbol {u}^\textrm {T}$ the Newtonian stress tensor.
3. Numerical solution
3.1. Axisymmetric problem and co-moving frame
In the following, we will focus on the axial self-propulsion of the particle, for which the problem remains completely axisymmetric. In steady state, the concentration and velocity fields are time independent when measured in a reference frame moving with the particle. For convenience (e.g. to avoid any need for remeshing of the computational domain), we analyse the problem in that co-moving reference frame, where the particle is fixed, and the boundary conditions for the velocity field become
 \begin{equation} \left. \boldsymbol{u}\right|_{\varGamma_p} = \boldsymbol{\tilde{u}},\quad \left. \boldsymbol{u}\right|_{{\varGamma_d}} ={-}U_z {\boldsymbol{e}_z}, \end{equation}
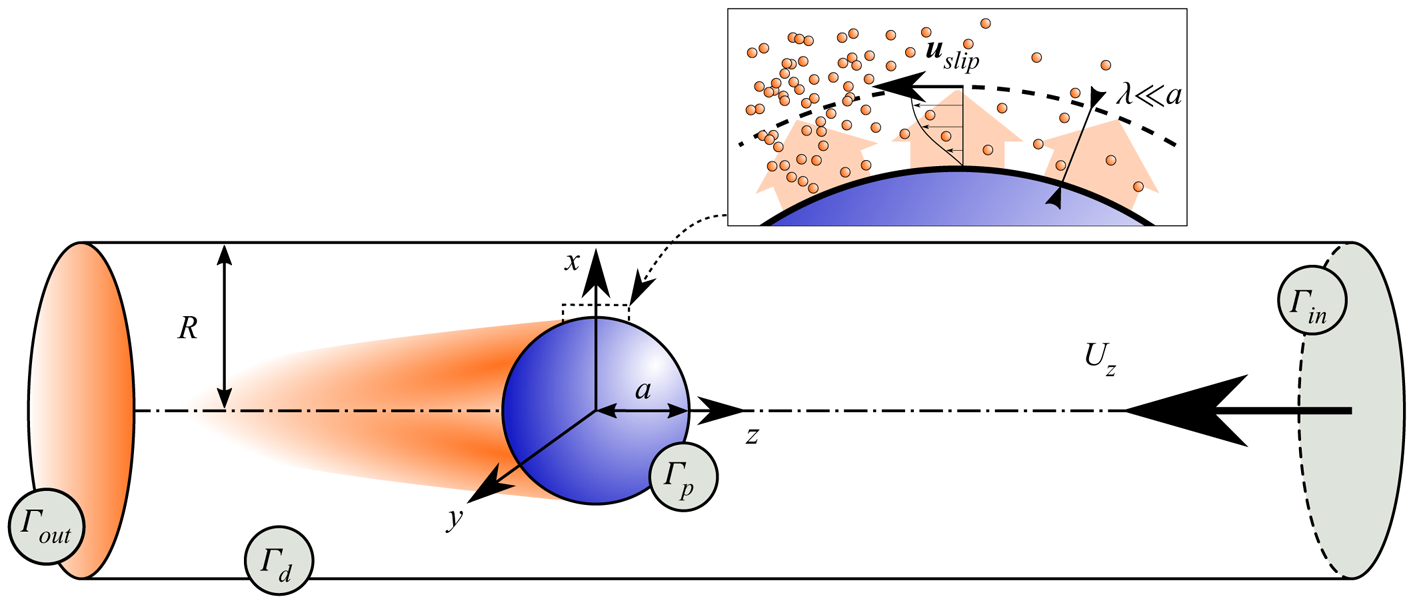
where  $U_z$ is the physical velocity of the particle relative to the wall in the laboratory frame, and completely determines the steady self-propulsion dynamics of the particle along the confining tube's axis (see figure 1).
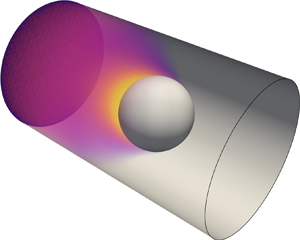
Self-propulsion of a single isotropic phoretic particle of radius  $a$ along the axis of a cylindrical pipe of radius
 $R$ (viewed here in the reference frame of the particle). The particle-to-pipe radius ratio,
 $\kappa =a/R$, is a measure of the level of confinement. The particle and pipe surfaces are noted
 $\varGamma _p$ and
 $\varGamma _d$, respectively. Here
 $\varGamma _{in}$ and
 $\varGamma _{out}$ denote cross-sections of the pipe far ahead and behind the particle, respectively. Inset: within a thin interaction layer of thickness
 $\lambda$, local surface gradients in the chemical solute (orange) released from the particle surface induce a net hydrodynamic slip.

It should be noted nevertheless that the numerical methodology presented in the following can be generalised to non-axisymmetric and unsteady configurations. Unsteady simulations of the particle's dynamics in the laboratory frame were also performed with non-axisymmetric initial conditions (i.e. particle position, direction and intensity of the particle velocity) and showed that this axisymmetric self-propulsion state is a stable attractor for the problem when  ${Pe}<15$, for all
 $\kappa$: when the particle is released initially away from the axis, it relaxes after a transient to either a stationary state on the axis or steady propulsion along the axis, establishing the physical relevance of the axisymmetric setting considered here.
3.2. Numerical method
Equations (2.3a,b), (2.4) and (2.7a,b), with boundary conditions, (2.5a,b) and (3.1a,b), form a fully coupled set of nonlinear partial differential equations problem. We solve these equations numerically in a cylindrical domain of length  $L\gg R$ with the particle located at its centre.
Boundary conditions must be prescribed for the solute and flow fields on the upstream and downstream cross-sections of the computational domain,  $\varGamma _{in}$ and
 $\varGamma _{out}$ located respectively at
 $z=\pm L/2$ from the centre of the particle. In the lab frame, the fluid is expected to be at rest with a homogeneous concentration of solute, far enough upstream and downstream of the particle, so that, in the reference frame co-moving with the particle,
 \begin{equation} \left.\boldsymbol{u}\right|_{\varGamma_{in},\varGamma_{out}}={-}U_z\boldsymbol{e}_z,\quad \left.\frac{\partial c}{\partial z}\right|_{\varGamma_{in},\varGamma_{out}}=0, \end{equation}
with  $U_z$ the a priori unknown particle velocity, which is determined as part of the solution by enforcing the force-free condition on the particle.
As for the inertial fluid–solid coupling in high Reynolds configurations (Selçuk et al. Reference Selçuk, Ghigo, Popinet and Wachs2021), the presence of the nonlinear advective coupling in the solute transport equations prevents the use of other popular numerical techniques such as multipole expansion (Sangani & Mo Reference Sangani and Mo1996), boundary elements methods (Pozrikidis Reference Pozrikidis1992; Montenegro-Johnson et al. Reference Montenegro-Johnson, Michelin and Lauga2015) or the force coupling method (Delmotte et al. Reference Delmotte, Keaveny, Plouraboué and Climent2015; Rojas-Pérez et al. Reference Rojas-Pérez, Delmotte and Michelin2021), which are particularly suitable for purely diffusive problems. In such a limit, a detailed knowledge of the flow and concentration fields in the domain bulk (i.e. away from the computational domain boundary  $\varGamma =\varGamma _p\cup {\varGamma _d}\cup \varGamma _{in}\cup \varGamma _{out}$) is unnecessary to obtain the particle dynamics. In contrast, when
 ${Pe}\neq 0$, the presence of the advective contribution to the solute transport,
 $\boldsymbol {u} \boldsymbol {\cdot }\boldsymbol {\nabla } c$, which is key to the understanding and capture of the spontaneous self-propulsion of isotropic phoretic particles and droplets (Michelin et al. Reference Michelin, Lauga and Bartolo2013; Izri et al. Reference Izri, van der Linden, Michelin and Dauchot2014), imposes a change in the resolution paradigm, by requiring to determine
 $\boldsymbol {u}$ and
 $c$ everywhere in the computational domain, and an accurate numerical treatment of this nonlinear term in the solute transport equation.
We present here a novel approach to solve for the diffusiophoretic propulsion based on Basilisk, a popular open source framework for computational fluid dynamics (Popinet Reference Popinet2015). Borrowing techniques developed for high- ${Re}$ flow simulations, the nonlinear diffusiophoretic problem is split into multiple sub-problems. The equations of evolution for the solute and flow fields are solved using finite volumes on hierarchically arranged, adaptive quadtree/octree grids (Popinet Reference Popinet2003). To adapt to the Basilisk framework most efficiently, the hydrodynamic problem is described by the unsteady Stokes equations with a small Reynolds number (
 ${Re}=0.05$). To reach the steady-state solutions, the hydrodynamic solver is called iteratively on a pseudo-time
 $\tilde {t}$, until the residuals between two pseudo-time steps reaches a convenient threshold, i.e.
 ${| \boldsymbol {u}(\tilde {t}+{\rm \Delta} \tilde {t}) - \boldsymbol {u}(\tilde {t}) | \lesssim 10^{-6} | \boldsymbol {u}(\tilde {t}) | }$, which generally takes
 $\mathcal {O}(10)$ successive calls. Note that this step represents the most time consuming part of the method. Stokes equations are solved using an operator-splitting method (Bell, Colella & Glaz Reference Bell, Colella and Glaz1989), with a viscous step (Poisson solver) followed by a projection onto a divergence-free space (Helmholtz solver). For the solute transport, (2.4), the diffusive Laplacian term is handled implicitly while the advective contribution is computed using the Bell–Colella–Glaz second-order upwind method (Bell et al. Reference Bell, Colella and Glaz1989).
The description of all solid–fluid interfaces that do not match a rectangular mesh is based on the method of embedded boundaries (Johansen & Colella Reference Johansen and Colella1998; Schwartz et al. Reference Schwartz, Barad, Colella and Ligocki2006), allowing for a second-order accurate computation of the additional fluxes to be included in the finite-volume balance in order to enforce a prescribed boundary condition within cells containing a fluid–solid interface  $\varGamma _p$ or
 ${\varGamma _d}$ (Schneiders et al. Reference Schneiders, Günther, Meinke and Schröder2016). Hydrodynamic forces are then computed a posteriori by numerical integration of the stress tensor on the particle surface.
At this point, we dispose of an efficient numerical framework for the computation of the flow velocity and solute concentration,  $(\boldsymbol {u},p, c)$, for boundaries of any shape, for a given particle velocity. The dynamics of the particle (here completely characterised by
 $U_z$, its axial velocity) is further determined through the instantaneous force-free constraint, which writes here simply as
 $F_z=0$. The Stokes problem is linear regardless of the confinement level
 $\kappa$; therefore, the axial force on the particle is an affine function of the solid body translation
 $U_z$, for a given slip velocity
 $\tilde{\boldsymbol{u}}$, i.e.
 \begin{equation} F_z(\boldsymbol{\tilde{u}},U_z) = \mathcal{R} U_z + \mathcal{Q}(\tilde{\boldsymbol{u}}), \end{equation}
with  $\mathcal {R}$ is the axial drag coefficient on a rigid sphere translating along the axis of the cylindrical pipe and
 $\mathcal {Q}$ is a scalar that is completely determined by the surface slip and the level of confinement. Both
 $\mathcal {Q}$ and
 $\mathcal {R}$ are independent of
 $U_z$ and solely depend on geometry (and on the slip velocity in the case of
 $\mathcal {Q}$), and are determined numerically as follows. At each time step, the Stokes problem is solved twice for the same slip velocity
 $\tilde {\boldsymbol {u}}$: (i) for the real problem, using a first guess of the swimming speed
 $U_z$ from the previous time step, and (ii) for an auxiliary problem with a different and arbitrary
 $U_z^{aux}$. For each, the corresponding axial force on the particle is computed and, using both solutions together with (3.3), provides
 $(\mathcal {Q},\mathcal {R})$ from which the correct swimming speed satisfying the force-free condition is obtained as
 $U_z(F_z=0)=-\mathcal {Q}/\mathcal {R}$.
A cubic domain of size  $L/a=128$ was used on an adaptive mesh refinement, with the finest spatial discretisation reaching
 $32$ computational cells per particle radius
 $a$, with
 ${\approx }2000$ cells describing the particle surface. The fluid domain (figure 1) is then cut out from this cubic volume employing the embedded boundaries approach (Bell et al. Reference Bell, Colella and Glaz1989) and the particle is set in the origin of the coordinate system, placed in the centre of the computational cuboid. Mesh is automatically adapted so as to ensure that maximum spatial refinement is always ensured on top of solid–liquid interfaces. Elsewhere, mesh is refined (respectively coarsened) whenever velocity or solute gradients is more (respectively less) than a prescribed threshold using an adaptive wavelet algorithm (see, e.g. van Hooft et al. Reference van Hooft, Popinet, van Heerwaarden, van der Linden, de Roode and van de Wiel2018). Using this approach and comparing the results for maximum spatial discretisations of 32 and 64 cells per unit length, we obtained a match in both swimming velocity and solute concentration fields, with a typical discrepancy on the swimming velocity lower than 0.1 % (
 ${Pe}=6$,
 $\kappa =0.5$) and reaching a maximum
 $2\,\%$ discrepancy for the most confined case considered (
 ${Pe}=6$,
 $\kappa =0.9$).
3.3. Validation
We now proceed with the validation of the proposed framework and algorithms by testing the main physical features against classical literature cases, namely (i) the self-propulsion of a model micro-organism using a prescribed surface slip (i.e. a so-called squirmer) in strong spatial confinement (Zhu et al. Reference Zhu, Lauga and Brandt2013), and (ii) the self-propulsion of isotropic particles due to nonlinear hydrochemical coupling (Michelin et al. Reference Michelin, Lauga and Bartolo2013). The first case, for which the hydrodynamic slip is imposed, allows for the validation of the hydrodynamic solver and the enforcement of the force-free constraint, while the second provides a validation of the coupled hydrochemical solver.
3.3.1. Squirmer in a pipe
The behaviour of a single squirmer inside a cylindrical pipe for different levels of confinement is considered, as studied in Zhu et al. (Reference Zhu, Lauga and Brandt2013) using a boundary element method. A steady slip velocity  $\tilde {\boldsymbol{u}}$ is imposed on the particle surface, which corresponds to a neutral squirmer, which would swim at a velocity
 $U_z^*\boldsymbol {e}_z$ in the absence of any confinement, namely
 \begin{equation} \tilde{\boldsymbol{u}}^{squirmer}={-}\frac{2U_z^{*}}{3} (\boldsymbol{I}-\boldsymbol{n}\boldsymbol{n})\boldsymbol{\cdot}\boldsymbol{e}_z. \end{equation}
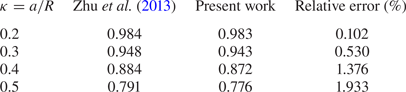
For an unconfined case, the algorithm recovers within  ${\pm }0.1\,\%$ the swimming velocity predicted by the reciprocal theorem (Stone & Samuel Reference Stone and Samuel1996), i.e. the average of the surface slip velocity (3.4) on the particle surface. For confined cases, with
 $0<\kappa \leq 0.5$, the maximum relative error between the present results and that of Zhu et al. (Reference Zhu, Lauga and Brandt2013) is less than
 $2\,\%$ (table 1).
Steady-state swimming speed of a squirmer along the axis of a capillary tube for varying confinement ratio  $\kappa$ and comparison with the results of Zhu et al. (Reference Zhu, Lauga and Brandt2013). The swimming velocity is normalised by that in unbounded fluid domains.

Physically, for the axisymmetric configurations tested here, the squirmer's swimming velocity is observed to decrease with increasing confinement.
3.3.2. Autophoretic propulsion in an unbounded domain
The second comparison allows for the validation of the hydrochemical solver in the absence of confinement ( $\kappa \ll 1$) and, in particular, of the treatment of the nonlinear advective coupling of the Stokes and chemical problems, which is the essential ingredient of the spontaneous autophoretic motion studied here. The results are then compared with those of Michelin et al. (Reference Michelin, Lauga and Bartolo2013) for strictly unbounded domains. Steady self-propulsion is observed beyond a critical
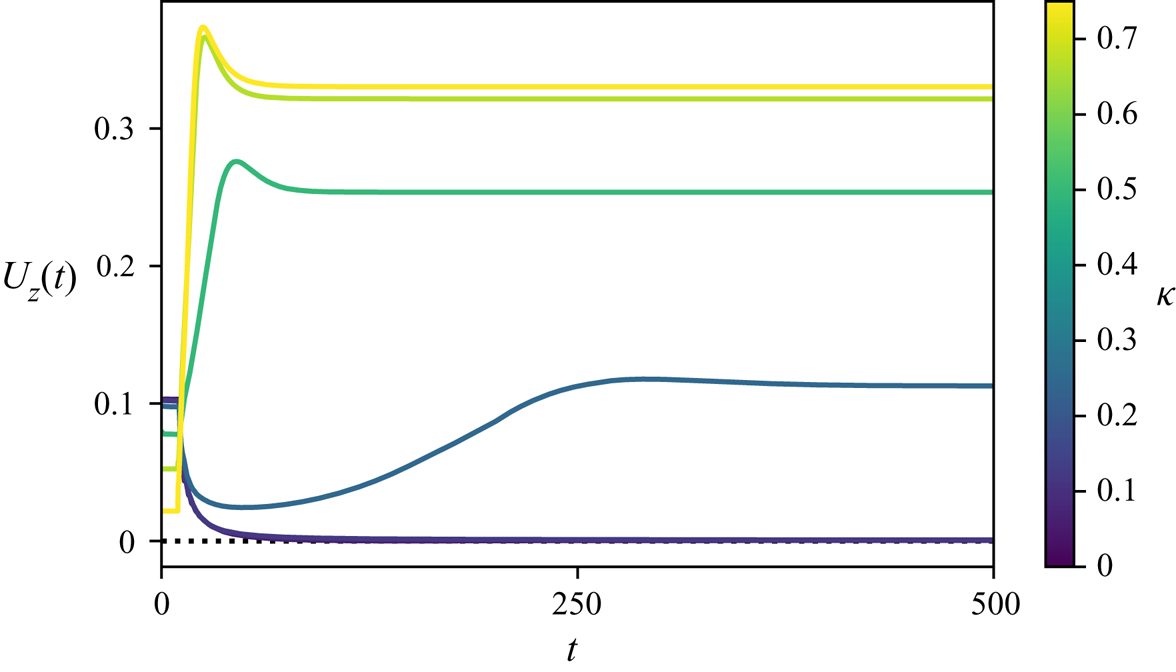
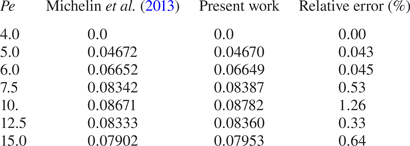
 ${Pe}$ after a transient, with a constant non-zero swimming speed as depicted in figure 2. A detailed comparison with the results of Michelin et al. (Reference Michelin, Lauga and Bartolo2013) shows that the present method is able to recover the correct swimming velocity with an error lower than
 ${\approx } 1\,\%$ for the resolution considered (table 2).
Unsteady axisymmetric propulsion velocity  $U_z(t)$ of an isotropic phoretic particle along the capillary's axis for increasing level of confinement
 $\kappa$ (colour) and
 ${Pe}=2.5$. The results are reported for
 $\kappa =1/16$,
 $1/8$,
 $1/4$,
 $1/2$,
 $2/3$ and
 $3/4$. During the initialisation phase (
 $t< t_{s}$ with
 $t_s=25$), the slip velocity on the particle surface is imposed (neutral squirmer), (3.4); for
 $t>t_{s}$, the phoretic slip velocity and particle dynamics are computed based on the actual surface concentration distribution of the solute, (2.2), and the force-free condition on the particle.

Steady-state swimming velocities as a function of  ${Pe}$, for an isotropic autophoretic particle in an unbounded domain, and comparison with the results of Michelin et al. (Reference Michelin, Lauga and Bartolo2013) for infinite domains.

4. Axisymmetric self-propulsion inside a capillary
4.1. Unsteady vs steady-state self-propulsion
In practice, the coupled equations for the solute concentration and fluid velocity are integrated numerically in time for fixed values of the Péclet number  ${Pe}$ and confinement ratio
 $\kappa$. For
 $0\leq {Pe}\leq 15$, at long time, the particle propels at a steady velocity along the capillary axis: an axisymmetric steady state is therefore reached in the reference frame of the particle for the solute concentration and flow fields, and we specifically focus here on the characterisation of such axisymmetric steady states.
The simulation is initialised by prescribing during a short initialisation phase ( $0\leq t\leq t_s$ with
 $t_s=25$ in non-dimensional units) a fixed axisymmetric slip velocity on the surface of the particle, corresponding to a neutral squirmer with intrinsic swimming velocity
 $U_z^*=0.1$. For
 $t\geq t_s$, the true phoretic slip is computed directly from the actual concentration distribution and imposed at the particle surface. Such a procedure allows us to perturb the system and break the left-right symmetry. The resulting evolution of the swimming velocity is shown in figure 2 for
 ${Pe}=2.5$ and for an increasing level of confinement. The self-propulsion of the particle during the initialisation (squirmer) phase decreases with
 $\kappa$, in agreement with the results of Zhu et al. (Reference Zhu, Lauga and Brandt2013); indeed, in figure 2 the velocity
 $U_z$ in the initialisation phase (
 $t\leq 25$) where the slip velocity is imposed, is observed to be lower for larger values of
 $\kappa$ (tighter confinement).
For  $t\geq t_{s}$, once the actual phoretic slip condition is enforced, the particle relaxes after a transient toward its steady-state dynamics. Unless indicated otherwise, we thus refer to
 $U_z$ as the steady-state self-propulsion velocity of the particle when
 $t\gg t_s$. Two fundamentally different types of steady-state dynamics are observed in figure 2 for
 ${Pe}=2.5$, depending on the level of lateral confinement
 $\kappa$ of the particle. For weak confinement (i.e. small
 $\kappa$), the particle slows down and eventually comes to a stop; this is consistent with
 ${Pe}=2.5$ being lower than the critical threshold for self-propulsion in unbounded domains (
 ${Pe}_c=4$ for
 $\kappa =0$) (Michelin et al. Reference Michelin, Lauga and Bartolo2013). Note that a steady state is reached for the particle velocity, flow field and concentration gradients, but not the average concentration which keeps increasing in time due to the fixed emission of solute at the particle surface and the confinement of the particle by chemically inert walls. In contrast, for
 $\kappa \geq 0.2$, the particle maintains a net velocity that increases with
 $\kappa$ and saturates for the strongest confinements considered (
 $\kappa \approx 0.8$). Note that changing the magnitude of the initialisation velocity or the duration of the initialisation phase only modified the transient regime past
 $t\geq t_s$, but did not alter the nature of the observed steady state (i.e. fixed or self-propelled particle).
4.2. Self-propulsion velocity and critical threshold
In the following, we focus on the evolution of this steady-state self-propulsion and the influence of the proximity of the confining walls. To that end, for  ${0\leq \kappa \leq 0.8}$ and
 ${0<{Pe}\leq 15}$, we systematically run time-dependent simulations until a steady state is reached, with a constant swimming speed along the axis of the capillary. The results for
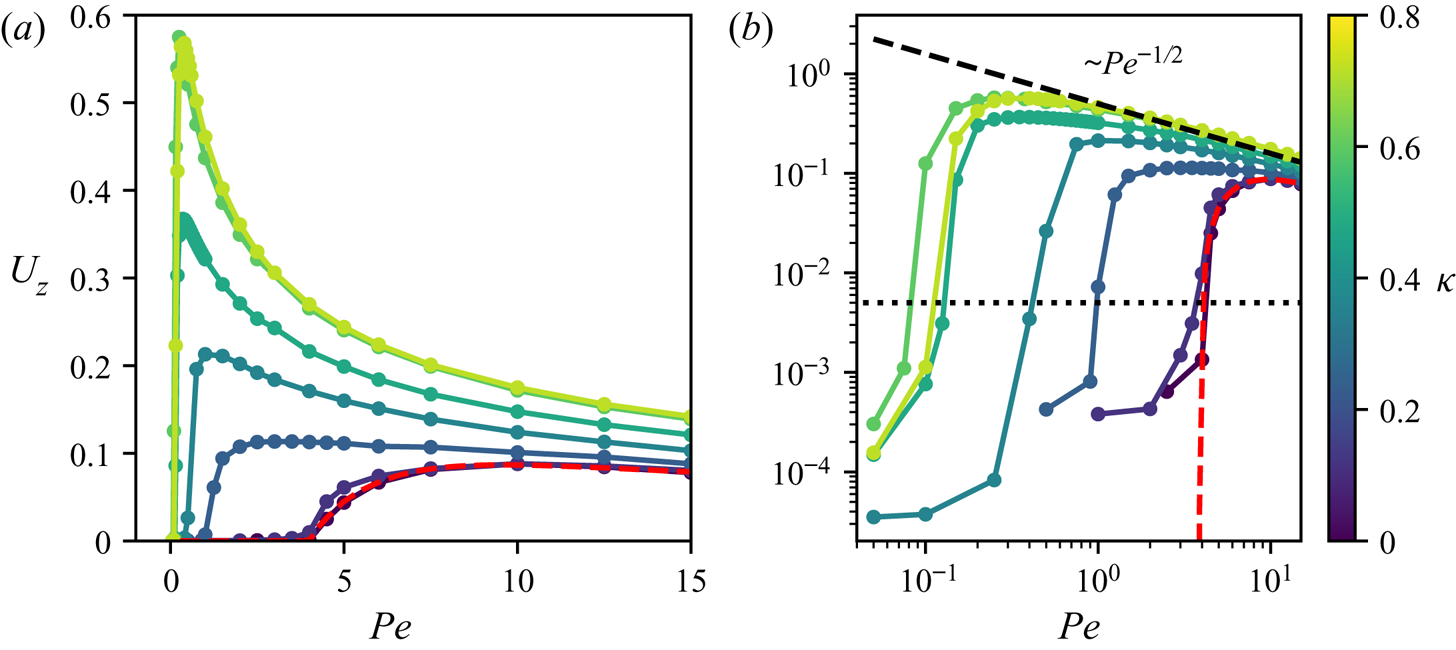
 $U_z({Pe},\kappa )$ are reported in figure 3, and demonstrate the strong influence of confinement and an increase of the self-propulsion velocity with confinement
 $\kappa$ for all
 ${Pe}$. This effect is significant provided the distance to the wall is of the order of a few particle radii (
 $\kappa \gtrsim 0.2$), confirming experimental observations (de Blois et al. Reference de Blois, Bertin, Suda, Ichikawa, Reyssat and Dauchot2021).
(a) Steady-state axisymmetric swimming velocity  $U_z$ of an isotropic active particle as a function of the convection-to-diffusion ratio,
 ${Pe}$, and for increasing confinement
 $\kappa$ (colour). (b) Same as (a) in logarithmic scale. The results for a single isolated particle in unbounded domains (
 $\kappa =0$, Michelin et al. Reference Michelin, Lauga and Bartolo2013) is shown for comparison (red dashed line). In (b) the dotted black line indicates the minimum velocity to determine the emergence of a net propulsion. The results are reported here for
 $\kappa =1/16$,
 $1/8$,
 $1/4$,
 $3/8$,
 $1/2$,
 $2/3$ and
 $3/4$.

Beyond a systematic increase of the swimming velocity, figure 3 also demonstrates several other important features. Most importantly, confinement effects are strongest for low-to-moderate values of  ${Pe}$. We first note a significant reduction with
 $\kappa$ of the critical self-propulsion threshold
 ${Pe}_c$. Furthermore, the presence of confinement strongly affects the evolution of
 $U_z({Pe})$: in weakly confined configurations the velocity varies non-monotonically with
 $\mbox {Pe}$, and increases smoothly from the threshold until it saturates for
 ${Pe}\approx 10$–
 $20$ and decreases as
 ${Pe}$ is increased further (Michelin et al. Reference Michelin, Lauga and Bartolo2013). In contrast, the velocity of strongly confined particles (
 $\kappa \gtrsim 0.5$) scales as
 $1/\sqrt {{Pe}}$ for most of the parameter range except in the immediate vicinity of the threshold
 ${Pe}_c(\kappa )$ where it increases sharply with
 ${Pe}$ (figure 3b). As a result, the maximum swimming velocities are observed at low Péclet in strongly confined environments (figure 3a). Note that self-sustained motion is never observed for
 ${Pe}=0$, regardless of
 $\kappa$: as for unbounded environments, convective transport of the solute by the phoretic flows is essential to the propulsion of isotropic particles, as it provides the required symmetry-breaking mechanism (Michelin et al. Reference Michelin, Lauga and Bartolo2013; Izri et al. Reference Izri, van der Linden, Michelin and Dauchot2014).
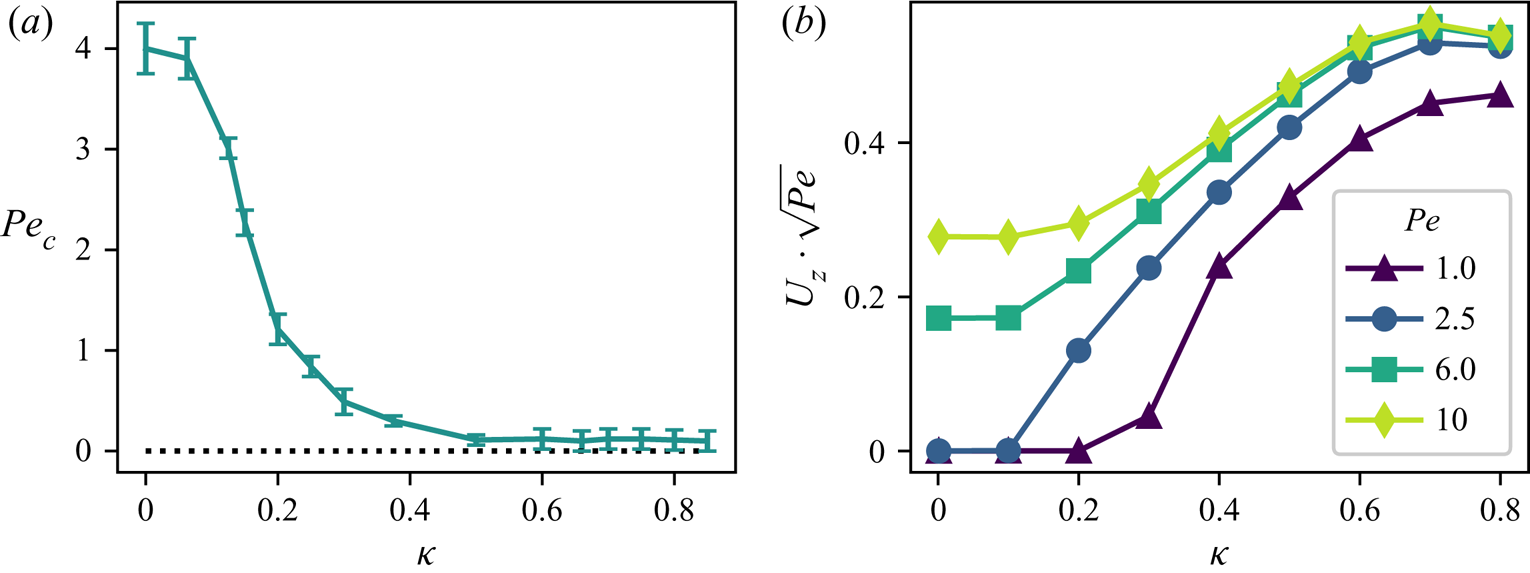
Stronger confinement significantly promotes self-propulsion, by reducing the minimum Péclet number,  ${Pe}_c$ required for self-sustained autophoretic motion: while
 ${Pe}_{c}=4$ for
 $\kappa =0$, the existence of a minimum
 ${Pe}$ for self-propulsion persists throughout the range of confinement investigated but this threshold drops quickly as
 $\kappa$ is increased, with
 ${Pe}_c\approx 0.1$ for
 $\kappa \gtrsim 0.5$ (figure 4). However, with the present numerical approach, it is not possible to analyse the lubrication limit with significant precision to conclude on the asymptotic behaviour of
 ${Pe}_c$ when
 $1-\kappa \ll 1$, and this asymptotic limit would require further analysis using a different approach.
(a) Evolution with confinement ( $\kappa$) of the critical threshold
 ${Pe}_c$ for the onset of propulsion. For fixed
 $\kappa$, the numerical uncertainties on
 ${Pe}_c$ are defined using the smallest (respectively largest) value of
 ${Pe}$ for which the steady-state velocity is greater (respectively smaller) than a numerical threshold
 $U_z^*=5\times 10^{-3}$. (b) Evolution of the rescaled particle velocity with confinement
 $\kappa$.

Except for rare examples (Hokmabad et al. Reference Hokmabad, Dey, Jalaal, Mohanty, Almukambetova, Baldwin, Lohse and Maass2021), the Péclet number is fixed in most experimental systems, and only spatial confinement can be controlled. For this reason, we also report in figure 4(b) the evolution of the rescaled swimming velocity for fixed  ${Pe}$ and variable confinement
 $\kappa$. In all cases, this rescaled representation (where we account for the dominant
 ${Pe}^{-1/2}$ scaling of the velocity, see also § 5) demonstrates a non-monotonic evolution of the swimming velocity with
 $\kappa$, with a maximum at
 $\kappa \approx 2/3$, before entering the lubrication regime. This behaviour and its origin will be further discussed in § 5.1.
4.3. Effect of confinement on the solute distribution
The peculiar evolution of the swimming velocity with confinement and its enhancement at low  ${Pe}$ is analysed by considering the detailed variations of the solute concentration around the isotropic phoretic particle in confined steady-state regimes (figure 5). For fixed
 ${Pe}$, the solute distribution around the particle is fundamentally modified by confinement.
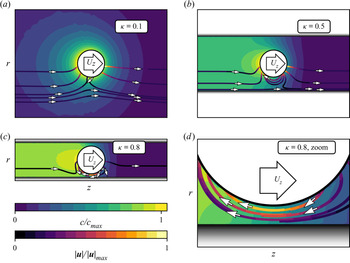
Steady-state relative solute concentration distribution and representative streamlines (colour coded by the fluid velocity magnitude) around an isotropic phoretic particle in axisymmetric confinement for  ${Pe}=6$ and increasing
 $\kappa$ (in the laboratory reference frame, i.e. fixed with respect to the capillary walls).

In unbounded domains and for weak confinements, the solute distribution is characterised by a monotonic decrease in all radial directions around the particle, with a small front-back asymmetry maintained by the self-generated phoretic flows (figure 5,  $\kappa =0.1$): in that case, the solute production at the particle surface is predominantly balanced by its radial diffusion away from the particle.
In contrast, for stronger levels of confinement (e.g. figure 5,  $\kappa =0.8$), lateral diffusion of the solute away from the particle is prevented by the lateral inert wall
 ${\varGamma _d}$: in that case, the solute production by the particle's catalytic surface is predominantly balanced by its downstream convective transport by the phoretic flows. As a result, the capillary upstream from the particle is essentially solute free, and the solute concentration saturates downstream from the particle at a much larger and uniform value. The largest solute concentrations are therefore found downstream and away from the particle, rather than on its surface as for the unbounded configuration.
A more detailed observation for strong confinement reveals that far upstream and downstream from the particle, the solute concentration becomes homogeneous due to the rapid lateral diffusion across the capillary (figure 5,  $\kappa =0.8$). Additionally, as confinement is increased, the fluid layer separating the particle from the wall becomes very thin and chemical diffusion across this thin gap becomes dominant over other solute transport mechanisms: as a result, the solute concentration is homogenised across the whole fluid layer, despite the steady emission of solute from the particle surface (figure 5,
 $\kappa =0.8$, zoom).
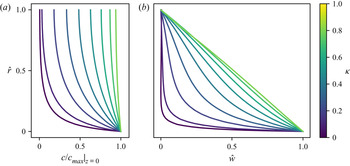
This last observation is further confirmed quantitatively by the detailed evolution of the distribution of the concentration across the thin fluid layer (figure 6a). While the solute concentration is only significant near the surface of the particle for small  $\kappa$, the distribution of solute across the gap is uniform when
 $\kappa \rightarrow 1$.
Relative spanwise distribution of (a) solute concentration and (b) streamwise flow velocity (in the particle's reference frame) within the fluid gap between the swimmer and the fixed walls ( $z=0$) for increasing confinement
 $\kappa$ (colour) and
 ${Pe} = 6.0$. The rescaled radial variable
 $\hat {r}=(r-a)/(R-a)$ is defined such that
 $\hat {r}=0$ (respectively
 $\hat {r}=1$) corresponds to the particle (respectively wall) surface for all values of
 $\kappa$. In (b) the rescaled fluid velocity with respect to the particle is
 $\hat {w}=(w+U_z)/(w_{slip}+U_z)$ (note: here
 $w<0$ throughout the gap in the particle reference frame, and
 $w=-U_z$ at the wall,
 $\hat {r}=1$, while
 $w=w_{slip}<0$ at the particle surface,
 $\hat {r}=0$). The results are reported for
 $\kappa =n/10$ with
 $1\leq n\leq 9$.

The dominance of lateral diffusion, and resulting homogenisation of the concentration in most of the domain (i.e. apart from  $|z|\sim 1$), justifies focusing on the mean concentration along the capillary axis, defined as the average within each cross-section (fixed
 $z$),
 \begin{equation} \langle c\rangle _{xy}(z)=\frac{1}{{\rm \pi} (R^2-R_{min}(z)^2)} \int_{R_{min}(z)}^R\int_0^{2{\rm \pi}}c(r,z)r\,\mathrm{d} r\,\mathrm{d} \theta, \end{equation}
with  $R_{min}(z)=\sqrt {a^2-z^2}$ for
 $|z|< a$ and
 $R_{min}(z)=0$ otherwise. This function of
 $z$ only takes a uniform value far upstream and downstream of the particle (figure 7), so that the front-back concentration contrast can be defined as
 \begin{equation} {\rm \Delta} c=\langle c\rangle _{xy}(z={-}L/2)-\langle c\rangle _{xy}(z=L/2). \end{equation}
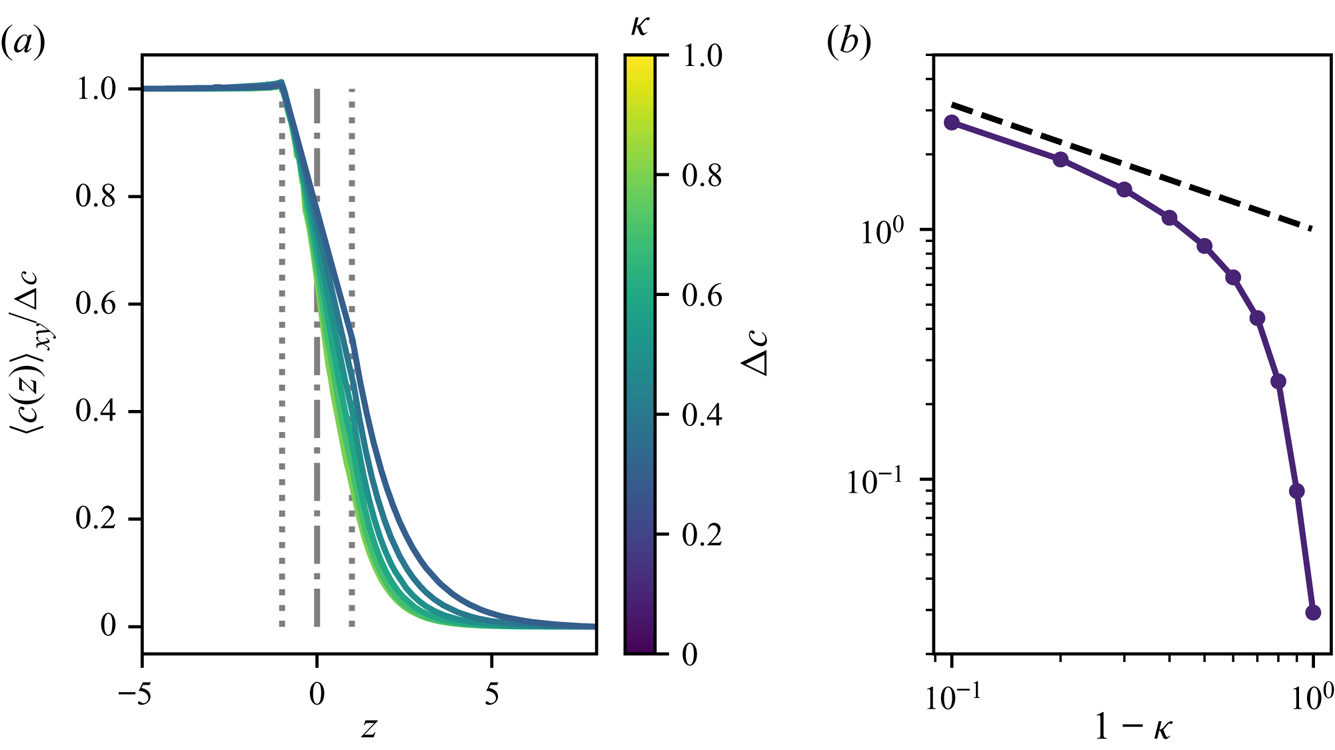
Figure 7(a) shows that the evolution with  $z$ of the average concentration, once rescaled by
 ${\rm \Delta} c$, becomes essentially independent of
 $\kappa$ for
 $\kappa \gtrsim 0.5$, and that this universal profile is characterised by (i) constant values behind and ahead of the particle (
 $z<-1$ or
 $z\gtrsim 2$) and (ii) a linear profile (constant streamwise gradient) in most of the vicinity of the particle. The amplitude of the front-back concentration contrast however increases sharply with
 $\kappa$, diverging as
 $(1-\kappa )^{-1/2}$ as
 $\kappa \rightarrow 1$, demonstrating the confinement-induced chemical saturation (figure 7b). This behaviour is quantitatively consistent with the asymptotic predictions (5.26) (see also § 5).
(a) Evolution of the spanwise-averaged solute concentration in the fluid around the particle along the pipe for increasing confinement  $\kappa$ (colour) for
 ${Pe}=6$. The particle's position and limits are shown (respectively dash-dotted and dotted lines). The results are reported for
 $\kappa =n/10$ with
 $2\leq n\leq 8$. (b) Evolution with
 $\kappa$ of the front-back concentration contrast measured using the spanwise-averaged concentration at
 $|z|\gg R$ upstream and downstream from the particle. The dashed line corresponds to the analytical prediction of § 5; see (5.26a–c).

The fore-aft asymmetry of the concentration profile, observed in figure 7(a) for  ${Pe}=6$, results from the accumulation of solute in the wake of the propelling droplet due to the restricted lateral diffusion when the droplet is sufficiently confined (large enough
 $\kappa$) and is also present for larger
 ${Pe}$. A small overshoot of the concentration profile can be observed immediately behind the particle for the least confined configurations (small
 $\kappa$) for which the solute transport balance is fundamentally different.
4.4. Effect of confinement on the flow field
The flow pattern and intensity generated by the swimming particle inside the capillary is also significantly modified by the presence and distance to the neighbouring walls. For strong confinement, the largest fluid velocities and velocity gradients are observed within the thin fluid gap: a finite volume of fluid needs to be moved from one side of the particle to the other through a narrower gap in order to allow for the particle motion through the capillary where the flow is at rest away from the particle. As  $\kappa$ approaches
 $1$, the typical fluid velocity within the gap is therefore much higher than the particle velocity itself (see also § 5 for a more quantitative discussion), resulting in strong spanwise gradients of the fluid streamwise velocity within the narrow gap (figure 5).
A more detailed analysis of the velocity distribution within the fluid gap further reveals that, as  $\kappa$ is increased, the velocity profile tends to a Couette flow profile (figure 6b): the dominant fluid transport in the narrowest fluid layer is therefore driven solely by the phoretic slip at the particle surface, resulting from the front-back concentration contrast observed in strongly confined configurations (figure 5). In particular, the absence of curvature in the velocity profile indicates that longitudinal pressure gradients play a negligible effect on the dominant flow.
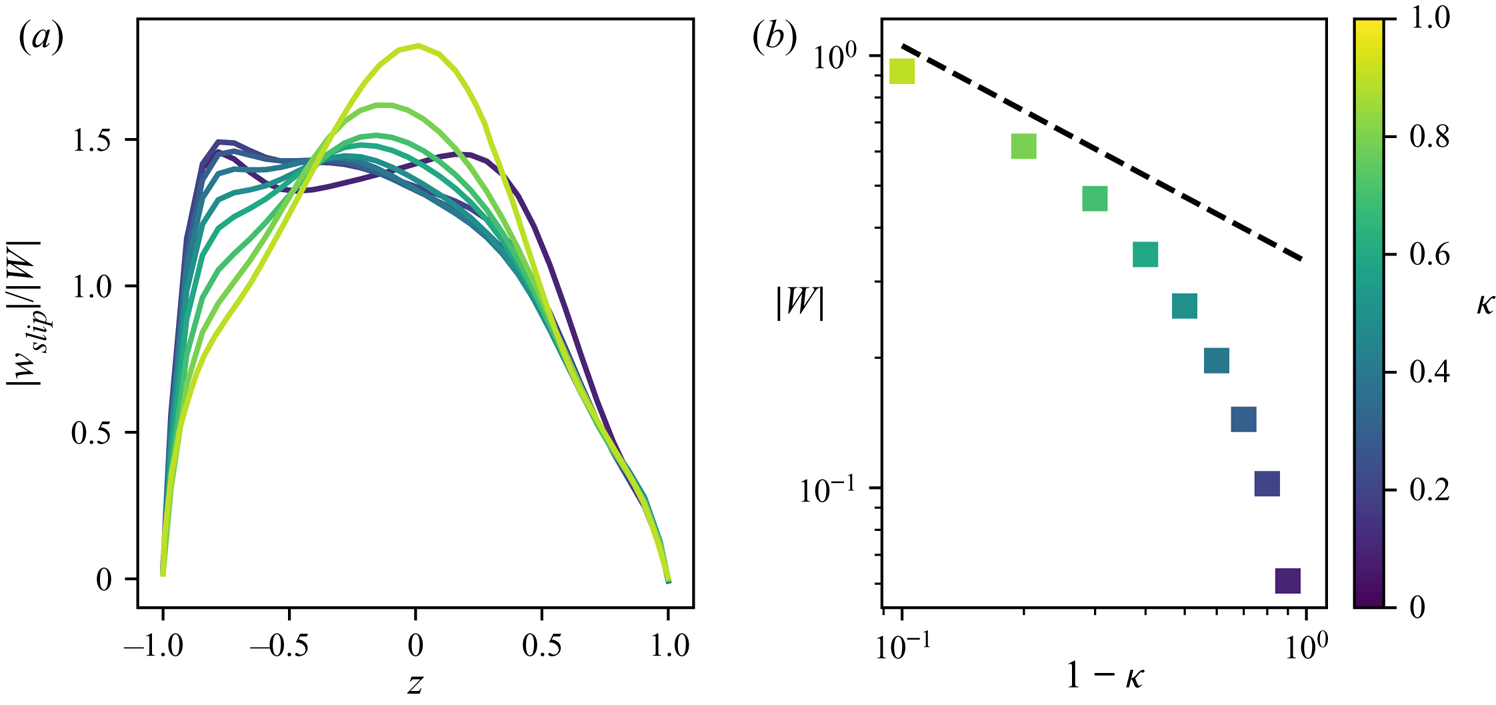
We therefore turn our attention to the evolution of this slip forcing for increasing  $\kappa$ and, more specifically, on its streamwise component that plays a major role in the thinnest regions. Once again, a transition can be clearly seen between two different regimes (figure 8a): for weak confinement, the relative distribution of slip is rather constant along the sphere, except near the front and back poles. A slight maximum is observed at the back of the particle, which is in qualitative agreement with the established result that the particle acts as a pusher swimmer in unbounded domains (Michelin et al. Reference Michelin, Lauga and Bartolo2013; Izri et al. Reference Izri, van der Linden, Michelin and Dauchot2014). As confinement is increased, the slip profile becomes more front-back symmetric with a maximum value attained in the narrowest region: this indicates a stronger localisation of the forcing in the regions where it has the most hydrodynamic influence on the self-propulsion. Note that such localisation in the regions of strongest hydrodynamic influence was also recently identified for a chemically active droplet propelling along a planar wall (Desaï & Michelin Reference Desaï and Michelin2021). The evolution of the maximum phoretic slip with
 $\kappa$ confirms the enhancement of the phoretic forcing as the distance to the confining walls is reduced, with the average fluid velocity in the gap,
 $W=\langle w(z=0)\rangle _{xy}$, diverging as
 $(1-\kappa )^{-1}$ when
 $\kappa \rightarrow 1$. This increase of the phoretic slip with confinement directly results from the increased (and diverging as
 $\kappa \rightarrow 1$) concentration contrast between the front and back of the phoretic particles that was discussed in greater details in § 4.3. The results are in good agreement with the asymptotic prediction for the evolution of
 $W$ as
 $\kappa \rightarrow 1$ (figure 8(b) and (5.26a–c)).
(a) Distribution of the surface slip velocity normalised by the average fluid velocity in the particle-capillary gap. The results are reported for  $\kappa =n/10$ with
 $2\leq n\leq 8$. (b) Average fluid velocity in the particle-capillary gap
 $W$ at varying confinement
 $\kappa$. Results are shown here for
 ${Pe}=6.0$. The dashed line corresponds to the analytical prediction, (5.26a–c).

Finally, the velocity field away from the particle (i.e. upstream and downstream) is almost uniform and eventually decays to zero (in the laboratory reference frame). Here a brief comment should be made regarding the boundary conditions imposed at the inlet and outlet boundaries of the computational domain (figure 1). A Dirichlet boundary condition on the flow velocity is imposed on  $\varGamma _{in}$ and
 $\varGamma _{out}$, representing that the flow is at rest far upstream and downstream from the particle in the lab frame. This will be the case, for example, when the domain considered (figure 1) is part of an infinitely long tube: away from the particle, the large hydrodynamic resistance prevents the existence of any flow within the tube.
4.5. Resistance to particle motion and pressure
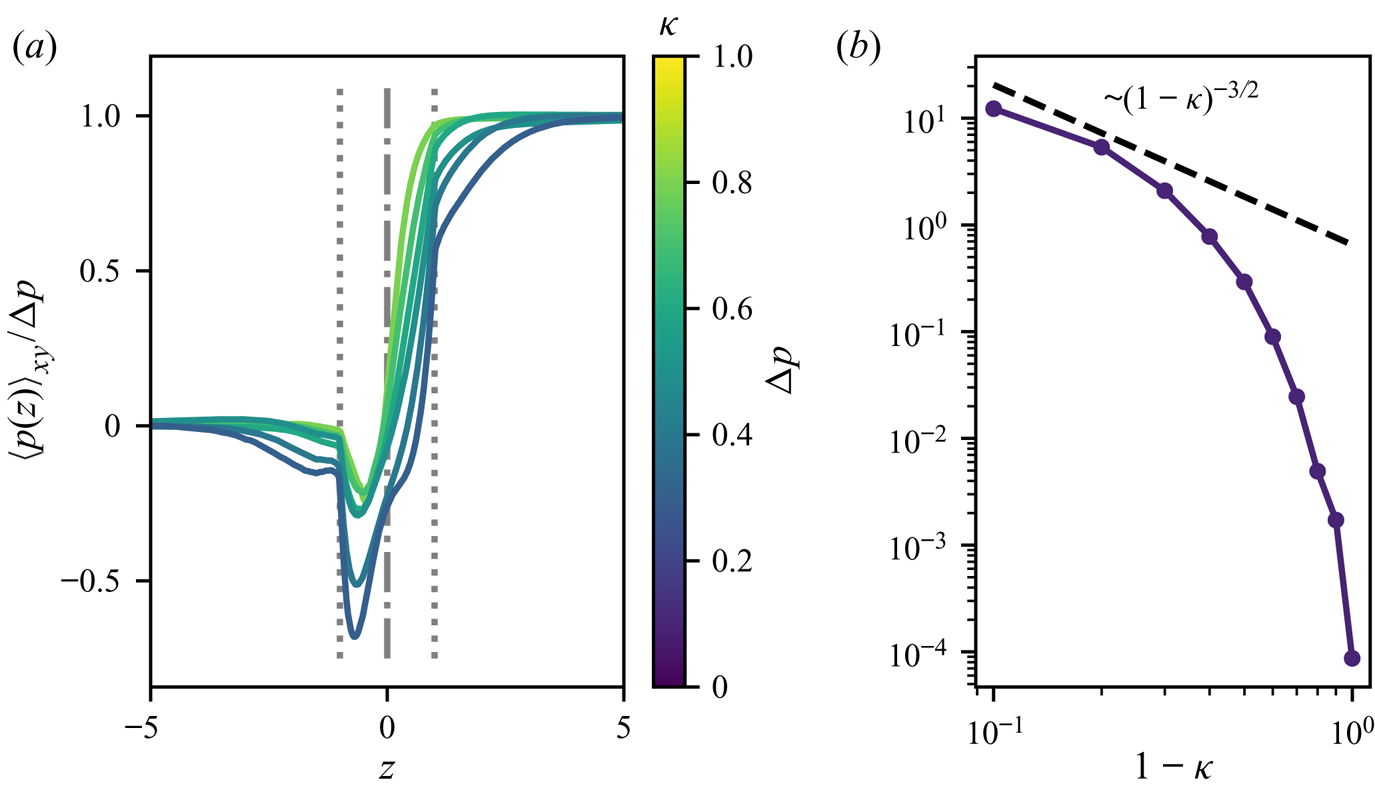
We noted earlier that, because fluid is at rest in front of and behind the phoretic particle, a finite volume of fluid must pass through the thin fluid gap for the particle to move forward. Driving such a volume flux through a thin viscous fluid layer results in the establishment of a net pressure difference between the front and back of the sphere, as demonstrated in figure 9 by the evolution of the spanwise-averaged pressure  $\langle p \rangle _{xy}$ along the capillary (i.e. its average on each cross-section) and of the front-back pressure difference
 ${\rm \Delta} p$ (both quantities defined in a similar way as their counterparts for the concentration).
(a) Evolution of the spanwise-averaged fluid pressure in the fluid around the particle for increasing confinement  $\kappa$ (colour). The particle's position and limits are shown (respectively dash-dotted and dotted lines). The results are reported for
 $\kappa =n/10$ with
 $1\leq n\leq 9$. (b) Evolution with
 $\kappa$ of the front-back mean pressure difference measured using the spanwise-averaged pressure at
 $|z|\gg R$ upstream and downstream from the particle. In both panels, results were obtained for
 ${Pe}=6$. The dashed line with
 $(1-\kappa )^{-3/2}$ is shown for comparison only.

We first note that the pressure difference  ${\rm \Delta} p$ vanishes when
 $\kappa \ll 1$, i.e. for unbounded phoretic particles, as expected. When
 $\kappa$ becomes larger, the pressure still reaches constant values far upstream and downstream of the particle, but they are now different and their difference quickly grows with confinement and diverges as
 $\kappa \rightarrow 1$ (figure 9b). While a clear scaling is difficult to identify from the numerical results, it can still be concluded that the divergence observed is weaker than
 $(1-\kappa )^{-2}$ (see § 5.2 for further discussion). The emergence of a finite (and increasing) pressure difference exerts a resisting force on the particle, balancing the net forcing exerted within the thin fluid gap by the phoretic flows generated by the particle.
It should further be noted that the pressure variations are not monotonic, showing a local minimum in the vicinity of the narrowest regions (figure 9a).
5. Self-propulsion of a tightly fitting particle
5.1. Global conservation arguments
The analyses and results of the previous sections provide some critical insight on the physical balances and phenomena determining the evolution of the confined self-propulsion, in particular in the limit of strong confinement ( $\kappa \gtrsim 0.5$).
In the following, these different arguments are summarised and combined to obtain a prediction for the scaling of the swimming velocity in this limit, in terms of the two main parameters of the problem,  ${Pe}$ and
 $\kappa$. Throughout, we focus exclusively on the steady-state regime at the centre of our attention in § 4. We will relate three specific quantities: (i)
 $U_z$ the swimming velocity of the phoretic particles, (ii)
 ${\rm \Delta} c$ the difference in the uniform solute concentration observed far downstream and upstream of the particle, respectively, and (iii)
 $W=\langle w(z=0)\rangle _{xy}$ the mean flow velocity (relative to the particle) through the narrowest fluid region (
 $z=0$) (oriented along
 $-\boldsymbol {e}_z$, i.e. from the front toward the back).
5.1.1. Solute conservation
Considering the entire computational domain as a control volume, the conservation of solute imposes
 \begin{equation} \int_{\varGamma}\boldsymbol{j}\boldsymbol{\cdot} \boldsymbol{n}\,\mathrm{d} S=0, \end{equation}
with  $\varGamma =\varGamma _p\cup \varGamma _d\cup \varGamma _{out}\cup \varGamma _{in}$ (figure 1),
 $\boldsymbol {n}$ the unit normal to
 $\varGamma$ pointing into the fluid domain, and
 $\boldsymbol {u}$ the fluid velocity in the reference frame of the particle. The non-dimensional solute flux
 $\boldsymbol {j}={Pe} c\boldsymbol {u}-\boldsymbol {\nabla } c$ (characteristic scale:
 $|\mathcal {A}|$) includes the contributions of convective transport by the fluid flow and diffusion, respectively.
The channel's wall are inactive and impermeable so that  $\boldsymbol {j}\boldsymbol {\cdot }\boldsymbol {n}=0$ on
 $\varGamma _d$. At the particle surface the solute flux is purely diffusive and matches the total production rate at the particle surface
 $\int _{\varGamma _p}\boldsymbol {j}\boldsymbol {\cdot }\boldsymbol {n}\,\mathrm {d} S={4{\rm \pi} }$. Far from the particle, near
 $\varGamma _{in}$ and
 $\varGamma _{out}$, the concentration is uniform so that the diffusive flux is negligible on these surfaces. The velocity is also uniform and equal to
 $-U_z\boldsymbol {e}_z$ so that
 \begin{equation} \int_{\varGamma_{in}\cup\varGamma_{out}}\boldsymbol{j}\boldsymbol{\cdot}\boldsymbol{n}\,\mathrm{d} S={-} \frac{{\rm \pi} {{Pe}\,}U_z{\rm \Delta} c}{\kappa^2}. \end{equation}
Equation (5.1) then leads to
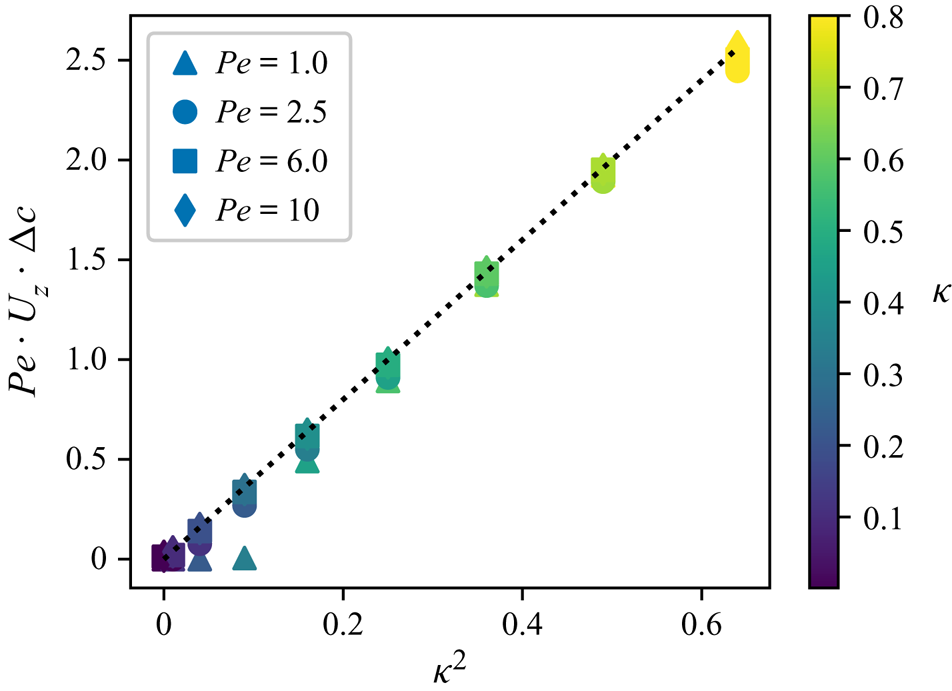
 \begin{equation} {Pe} \,U_z{\rm \Delta} c=4\kappa^2. \end{equation}
This result was found in agreement with the numerical results for strong enough confinements ( $\kappa \gtrsim 0.2$, figure 10). Note that for lower
 $\kappa$, such a balance is not expected to hold as the transport mechanism of the solute away from the particle surface vicinity is fundamentally different.
Global conservation of solute: the dimensionless solute emission ( $\kappa ^2$) is compared with the dimensionless excess solute convected downstream from the sphere (
 ${Pe}\,U_z{\rm \Delta} c$).

5.1.2. Conservation of mass
A similar argument for the conservation of mass on the upstream half of the computational domain leads to
 \begin{equation} \int_{\varGamma^+}\boldsymbol{u}\boldsymbol{\cdot}\boldsymbol{n}\,\mathrm{d} S=0, \end{equation}
with  $\varGamma ^+=\varGamma _{in}\cup \varGamma _p^+\cup \varGamma _d^+\cup \varGamma _0$ with
 $\varGamma _d^+$ and
 $\varGamma _p^+$ the parts of the wall and particle surfaces with
 $z>0$, and
 $\varGamma _0$ the fluid cross-section at
 $z=0$. The particle surface
 $\varGamma _p$ and the wall
 $\varGamma _d$ are impermeable and do not contribute to the integral above. On
 $\varGamma _{in}$, the velocity is uniform and equal to
 $-U_z$, so that
 $\int _{\varGamma _{in}}\boldsymbol {u}\boldsymbol {\cdot }\boldsymbol {n}\,\mathrm {d} S={\rm \pi} U_z/\kappa ^2$. By definition of
 $W$,
 $\int _{\varGamma _0}\boldsymbol {u}\boldsymbol {\cdot }\boldsymbol {n}\,\mathrm {d} S=-{\rm \pi} (1-\kappa ^2)W/\kappa ^2$, so that
 \begin{equation} U_z=(1-\kappa^2)W. \end{equation}
5.1.3. Fluid velocity trough the gap
One of the main features of the flow within the thin fluid gap identified in § 4.2 when the gap thickness is reduced (i.e.  $1-\kappa \ll 1$) was the emergence of a Couette-like dominant flow driven by the slip velocity
 $w_{slip}$ at the surface of the particle. For a cylindrical Couette flow (Leal Reference Leal2007),
 \begin{equation} W=\frac{w_{slip}}{2}f(\kappa),\quad \textrm{with }f(\kappa)=\frac{1}{\log(1/\kappa)}- \frac{2\kappa^2}{1-\kappa^2} \end{equation}
and  $f(\kappa \rightarrow 1)=1$ (plane Couette flow). The non-dimensional slip velocity is
 $({\mathrm {d}c}/{\mathrm {d}z})(z=0)\approx ({\mathrm {d}}/{\mathrm {d}z})\langle c\rangle _{xy}$ since the concentration is uniform across the fluid gap for large enough
 $\kappa$. The results of figure 7 suggest that the variations of
 $\langle c\rangle _{xy}$ with
 $z$ are almost linear so that the axial concentration gradient in the gap is proportional to the front-back concentration contrast
 ${\rm \Delta} c$ and, accordingly, the phoretic slip and mean flow in the gap
 $W$ satisfy
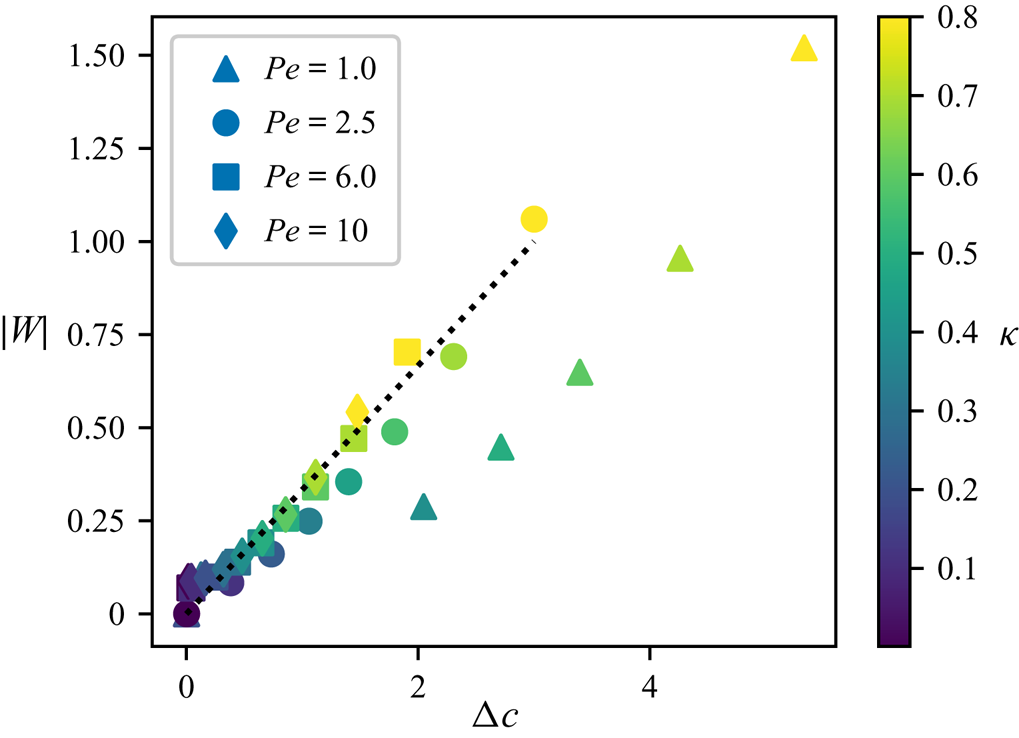
 \begin{equation} W\approx K{\rm \Delta} c\end{equation}
with  $K$ a constant of proportionality.
Figure 11 provides supporting evidence of this linear relationship between the average velocity  $W$ and the front-back concentration contrast, with
 ${K\approx 1/3}$, except for the lowest
 ${Pe}$-values.
Relative evolution of the spanwise-averaged axial velocity  $W$ of the fluid (relative to the particle) at
 $z=0$ (narrowest fluid gap) and of the front-back solute concentration
 ${\rm \Delta} c$. The dotted line corresponds to
 ${\rm \Delta} c/3$.

5.1.4. Approximation of the particle velocity
A combination of macroscopic conservation principles, (5.3) and (5.5), and qualitative argument, (5.7), allowed us to obtain three independent relationships between the three quantities of interest  $U_z$,
 $W$ and
 ${\rm \Delta} c$. Combining these provide the following predictions for each of these quantities:
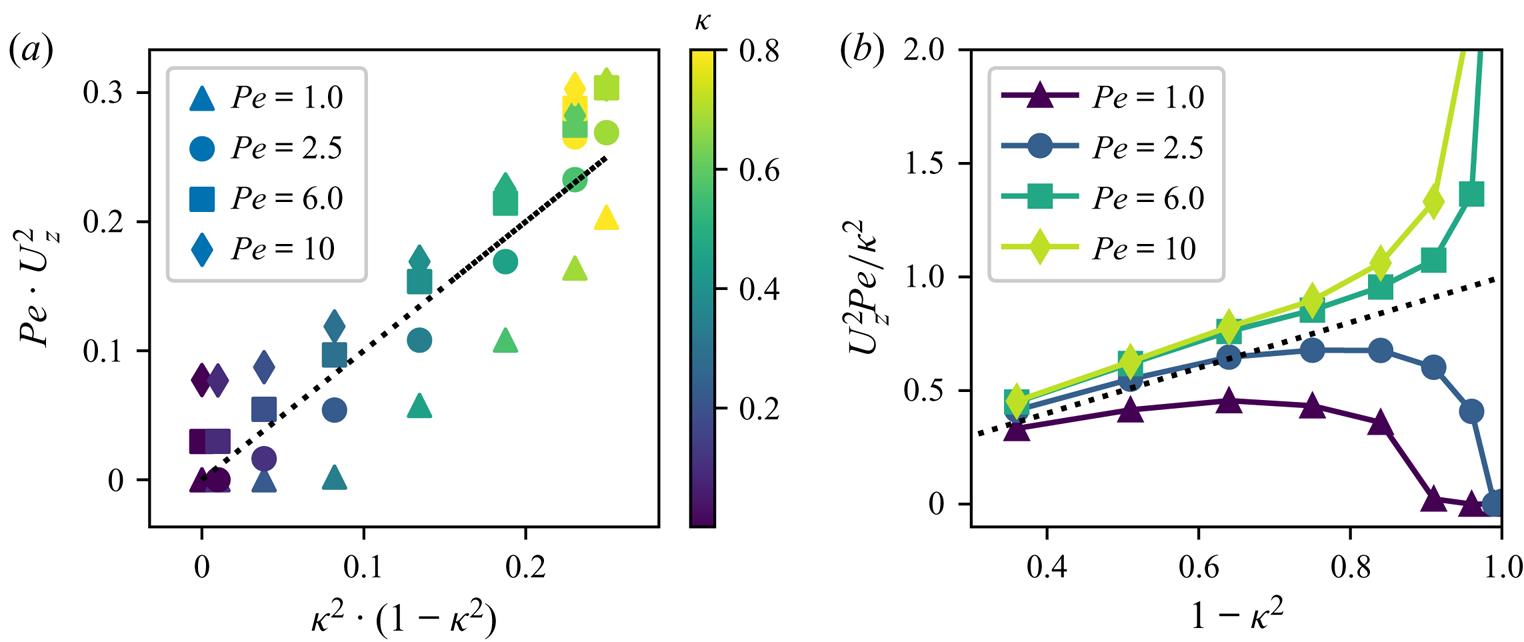
 \begin{equation} U_z\approx 2\kappa\sqrt{\frac{1-\kappa^2}{3{Pe}}},\quad W\approx \frac{2\kappa}{\sqrt{3{Pe}(1-\kappa^2)}},\quad {\rm \Delta} c \approx 2\kappa\sqrt{\frac{3}{{Pe}(1-\kappa^2)}}. \end{equation}
These predictions are in quantitative agreements with the numerical results (figure 12) in particular for larger  $\kappa$ (i.e.
 $\kappa \gtrsim 0.5$ or
 $1-\kappa ^2\lesssim 0.7$), except for the lowest value of
 ${Pe}$ investigated. This better agreement for larger
 ${Pe}$ was to be expected as convective transport of solute plays a dominant role in that limit.
(a) Evolution of the rescaled steady-state swimming velocity  $U_z$ with
 ${Pe}$ and
 $\kappa$. In each plot, the dotted line corresponds to the equality of the two plotted quantities. (b) The same data are reported to identify the behaviour for
 $\kappa \rightarrow 1$.

Furthermore, this relationship shows that  $U_z$ is not a monotonic function of
 $\kappa$ but instead should be maximum around
 $\kappa =1/\sqrt {2}\approx 0.7$ in agreement with the results of figure 4. These predictions also clearly establish that
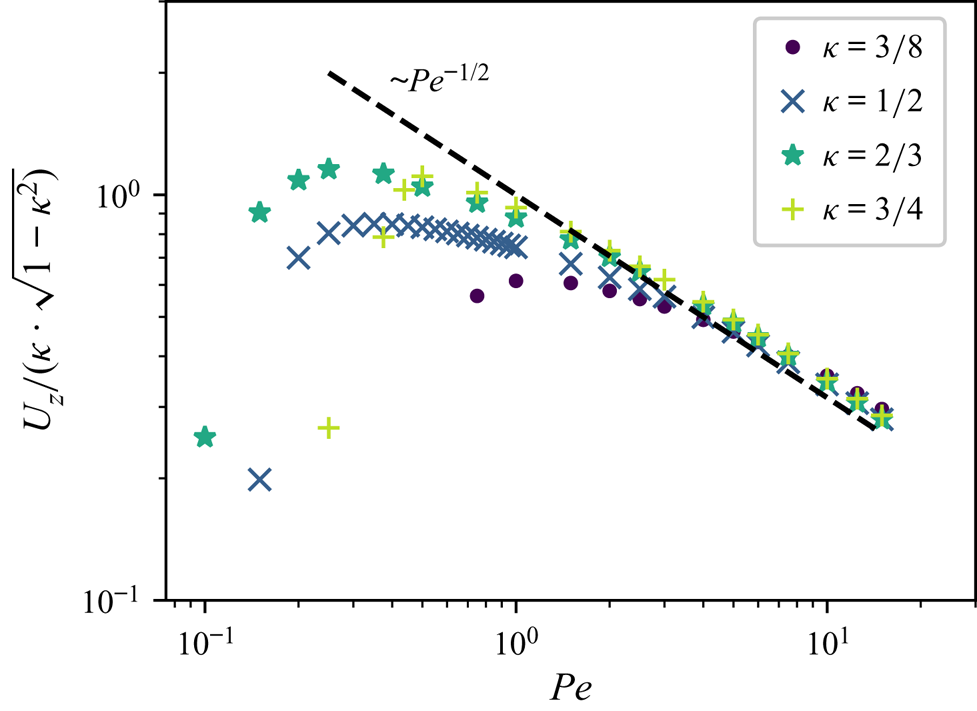
 $U_z\sim 1/\sqrt {{Pe}}$, in particular for larger
 ${Pe}$ and larger
 $\kappa$, which is confirmed in figure 13. We finally observe that the numerical evolution of
 $W$ and
 ${\rm \Delta} c$ with
 $\kappa$ are consistent with these predictions (see figures 7 and 8).
Evolution of the rescaled particle velocity with  ${Pe}$ for different confinement levels,
 $\kappa$. The dashed line corresponds to
 ${Pe}^{-1/2}$.

5.2. Asymptotic analysis
We focus now specifically on the lubrication limit, i.e. when  $R\approx a$ or equivalently
 $\kappa \rightarrow 1$ and, thus, define
 $\varepsilon =1-\kappa \ll 1$. Note that, the result above establishes that the dominant swimming velocity is set solely by the slip forcing inside the hydrodynamic lubrication region of width
 $\sqrt {\varepsilon }$ around the region of smallest thickness (and not anywhere else). In turn, this requires knowing the leading-order evolution of the surface concentration in that region.
The scalings obtained from the balance arguments of the previous sections indicate that, for  $\varepsilon =1-\kappa \ll 1$,
 \begin{equation} U_z={O\left(\sqrt{\frac{\varepsilon}{{Pe}}}\right)}\quad\textrm{and}\quad {W,{\rm \Delta} c=O\left(\frac{1}{\sqrt{\varepsilon{Pe}}}\right)}. \end{equation}
Physically, this indicates that as the fluid layer between the particle and the wall is reduced, the velocity of the particle tends to zero while the front-back concentration difference diverges. This is not surprising as we focus here on the steady self-propulsion of the particle. In § 4.3 we noted that the confined limit of the particle self-propulsion corresponds to a fundamental change in the way the solute produced at the particle surface is evacuated: when  $\kappa \rightarrow 0$ (unbounded flow), the solute is mostly diffused away in the far field and in all directions, while for
 $\kappa \rightarrow 1$, it must be convected downstream by the displacement of the particle, as steady diffusive solutions do not exist for these confined configurations. Lower self-propulsion velocities (e.g. due to the increase of viscous stresses at the boundary) therefore require larger concentration accumulation in the back of the self-propelled particle.
These arguments demonstrate not only a typical  $O(\varepsilon ^{-1/2})$-scale for the magnitude of the concentration in the thin lubrication layer located between the particle and the wall (with respect to the reference concentration far ahead of the particle, taken as zero here), but also that this concentration contrast
 ${\rm \Delta} c$ is established at the scale of the size of the particle, so that the relevant scale of horizontal variations for
 $c$ is
 $O(1)$ not the classical
 $O(\varepsilon ^{1/2})$-length of the lubrication zone relevant for hydrodynamic lubrication problems. Within the thin fluid layer surrounding
 $z=0$, one must therefore expect
 \begin{equation} c=O(\varepsilon^{{-}1/2}),\quad \tilde{u}\sim\frac{\partial c}{\partial x}=O(\varepsilon^{{-}1/2}), \end{equation}
where  $\tilde u$ is the slip velocity forcing at the particle surface.
5.2.1. Hydrodynamic lubrication
When  $\varepsilon \rightarrow 0$, the fluid's motion within the thin annular layer surrounding the particle at
 $z=0$ corresponds to a lubrication flow forced at the surface of the particle by the phoretic slip
 $\tilde {u}(z)$ along its surface. It is therefore described by the two-dimensional lubrication equations
 \begin{equation} \frac{\partial p}{\partial \rho}=0,\quad \frac{\partial ^2{u_z}}{\partial \rho^2}=\frac{\partial p}{\partial z}, \quad\frac{\partial u_z}{\partial z}+ \frac{\partial u_\rho}{\partial \rho}=0, \end{equation}
with  $\rho =\kappa ^{-1}-r$ the radial distance from the outer cylinder of radius
 $1/\kappa$ (measured inward) and
 $u_\rho$ the corresponding velocity component. The boundary conditions on the axial velocity are at leading order
 \begin{equation} u_z(\rho=0,z)={-}U_z,\quad u_z(\rho=h(z),z)=\tilde{u}(z), \end{equation}
with  $\rho =h(z)$ the equation for the surface of the particle, i.e.
 \begin{equation} h(z)=\frac{1}{\kappa}-\sqrt{1-z^2}\sim{\varepsilon} \left[1+\frac{z^2}{2\varepsilon}+O\left(\frac{z^4}{\varepsilon}\right)\right]. \end{equation}
Note that the present analysis is similar to that in Sherwood & Ghosal (Reference Sherwood and Ghosal2018) for the electrophoretic motion of a sphere inside a tightly fitting tube. The lubrication equations can be integrated to find the axial flow  $u_z(z)$,
 \begin{equation} u_z(\rho,z)=\frac{\rho(\rho-h)}{2}{\dfrac{\mathrm{d} p}{\mathrm{d} z}}+\tilde{u}(z) \left(\frac{\rho}{h}\right)+U_z\left(\frac{\rho}{h}-1\right), \end{equation}
and integration across the fluid layer and around the particle provides the volume flux
 \begin{equation} q(z)=Q=2{\rm \pi}\int_0^hu_z(\rho,z)\,\mathrm{d} \rho={-}\frac{{\rm \pi} h^3}{6}{\dfrac{\mathrm{d} p}{\mathrm{d} z}}+ {\rm \pi}h\left({-}U_z+\tilde{u}(z)\right), \end{equation}
which must indeed be a constant for all  $z$ in order to conserve the total volume flux through the different cross-sections. We first note that
 $Q=2{\rm \pi} \varepsilon W$, with
 $W$ the average axial velocity within the narrowest gap. Using the conservation of mass around the particle, (5.5), as
 $\varepsilon \rightarrow 0$, we further note that
 \begin{equation} Q=2{\rm \pi}\varepsilon W={\rm \pi} U_z \end{equation}
when  $\varepsilon \rightarrow 0$ so that the
 $U_z$-contribution to the right-hand side of (5.15) is
 $O(\varepsilon U_z)$ and is negligible in front of the left-hand side of that equation, as
 $Q=O(U_z)$.
Classically, this equation can then be used to compute the pressure difference between the two ends of the hydrodynamic lubrication region (Leal Reference Leal2007)
 \begin{equation} {\rm \Delta} P=\int_{{-}l}^{l}\frac{\partial p}{\partial z}\mathrm{d} z={-}6U_z\int_{{-}l}^l \frac{\mathrm{d} z}{h^3}+6\int_{{-}l}^l\frac{\tilde{u}(z)\,\mathrm{d} z}{h^2},\end{equation}
with  $l\gg \varepsilon ^{1/2}$ a length scale much larger than the typical
 $\varepsilon ^{1/2}$-width of the lubrication region. We note that because
 $1/h$ varies from
 $0$ to
 $1/\varepsilon$ over a
 $O(\varepsilon ^{1/2})$ length scale, the two integrals on the right-hand side of (5.17) scale respectively as
 $O(U_z\varepsilon ^{-5/2})$ and
 $O(\tilde {u}\varepsilon ^{-3/2})$.
The phoretic slip  $\tilde {u}$, as the forcing phenomenon of the problem, should remain part of the dominant balance in the conservation of volume flux, (5.15), so that
 $Q=O(\varepsilon \tilde {u})$. As a result, and using (5.16), both terms on the right-hand side of (5.17) are of the same order and contribute to the dominant balance.
The left-hand side of (5.17) represents a pressure difference between the upstream and downstream regions away from the particle. This would lead to a  $O({\rm \Delta} P)$ resistive force on the phoretic particle, that must be balanced by a driving force of the same order for self-propulsion to occur. This driving force can only arise from the phoretic slip forcing and associated shear stress
 ${\partial u_z}/{\partial \rho }=O(\tilde {u} \varepsilon ^{-1})$ at the particle's boundary within the lubrication zone, resulting in a
 $O(\tilde {u}\varepsilon ^{-1/2})$-driving force on the particle once integrated over the
 $O(\varepsilon ^{1/2})$-lubrication region, so that, at most
 ${\rm \Delta} P=O(\tilde {u}\varepsilon ^{-1/2})$. This establishes that
 ${\rm \Delta} P$ is subdominant in (5.17) and both integrals on the right-hand side of (5.17) must therefore balance exactly. Consequently, the swimming velocity
 $U_z$ is obtained from the slip velocity
 $\tilde {u}$ along the particle surface as
 \begin{equation} U_z=\frac{\displaystyle\int_{{-}l}^l\frac{\tilde{u}(z)\,\mathrm{d} z}{h^2}}{\displaystyle\int_{{-}l}^l \frac{\mathrm{d} z}{h^3}},\end{equation}
that demonstrates that  $U_z=O(\varepsilon \tilde {u})$.
5.2.2. Chemical transport through the hydrodynamic lubrication layer
Note that, the result above establishes that the dominant swimming velocity is set solely by the slip forcing inside the hydrodynamic lubrication region of width  $\sqrt {\varepsilon }$ around the region of smallest thickness (and not anywhere else). In turn, this requires knowing the leading-order evolution of the surface concentration in that region. It was however noted earlier that the chemical transport is externally constrained by the front-back concentration contrast imposed by the displacement of the particle in a confined setting, so that axial concentration gradients are essentially constant along the hydrodynamic lubrication region.
As for the hydrodynamic lubrication, the leading-order problem for the concentration is two dimensional in the  $(z,\rho )$-plane. The relevant boundary conditions satisfied by the concentration field are then
 $$\begin{gather} \frac{\partial c}{\partial \rho}=0\quad\textrm{at }\rho=0, \end{gather}$$
 $$\begin{gather}\frac{\partial c}{\partial \rho}=1+h'\frac{\partial c}{\partial z}\quad\textrm{at }\rho=h(z), \end{gather}$$
since  $\boldsymbol {n}=-\boldsymbol {e}_\rho +h'\boldsymbol {e}_z$ at leading order.
Equations (5.19)–(5.20) indicate that the relevant length scale for the variations of  $c$ in the
 $\rho$ direction is
 $h=O(\varepsilon )$. We noted earlier however that the relevant length scale in the axial
 $z$-direction is
 $O(1)$. From the hydrodynamic lubrication problem, we also obtained that
 $u_z=O(\tilde u)=O(\varepsilon ^{-1/2})$ so that by mass conservation
 $u_\rho =O(1)$. Furthermore, the steady advection–diffusion equation satisfied by
 $c$, i.e.
 ${{Pe}\,\boldsymbol {u}\boldsymbol {\cdot }\boldsymbol {\nabla } c=\nabla ^2c}$, becomes at leading order
 ${\partial ^2c}/{\partial \rho ^2}=0$, establishing that the leading order
 $O(\varepsilon ^{-1/2})$ concentration field must necessarily satisfy
 ${\partial c}/{\partial \rho }=0$ and that the non-homogeneous boundary condition, (5.20), corresponds to subdominant corrections of the concentration field.
Since the problem is axisymmetric around the particle, the conservation of solute in the fluid volume contained between two successive cross-sections at  $z$ and
 $z+\mathrm {d} z$ provides the following simplified equation for the evolution of
 $c(z)$:
 \begin{equation} \frac{\mathrm{d} }{\mathrm{d} z}\left(h\frac{\mathrm{d} c}{\mathrm{d} z}\right)-\frac{{Pe}\, Q}{2{\rm \pi}}\frac{\mathrm{d} c}{\mathrm{d} z}+1=0. \end{equation}
The successive terms in the previous equation arise from the balance of diffusion, convection by the flow within the lubrication layer and production at the particle surface, respectively.
Previously, we noted that the variations of  $c$ along the
 $z$-direction occur at the
 $O(1)$ scale of the particle. The dominant transport balancing the production at the particle surface is therefore purely convective (diffusive terms are subdominant in the hydrodynamic lubrication region). As a result the leading-order axial concentration gradient, and surface slip velocity, are constant and obtained simply as
 \begin{equation} \tilde u=\frac{\partial c}{\partial z}=\frac{2}{{{Pe} \,U_z}}. \end{equation}
Reporting this result into (5.18), we obtain
 \begin{equation} {{Pe} \,U_z^2}=\frac{2\displaystyle\int_{{-}l}^l\frac{\mathrm{d} z}{h^2}}{\displaystyle\int_{{-}l}^l \frac{\mathrm{d} z}{h^3}}.\end{equation}
The integral at the numerator, keeping only the leading-order contribution as  $\varepsilon \ll 1$ and
 $l\gg \sqrt {\varepsilon }$, can be expanded as
 \begin{equation} \int_{{-}l}^l\frac{\mathrm{d} z}{h^2}=\frac{1}{\varepsilon^2} \int_{{-}l}^l\frac{\mathrm{d} z}{\left[1+{z^2/(2\varepsilon)}\right]^2}= \frac{\sqrt{2}}{\varepsilon^{3/2}}\int_{{-}l/\sqrt{\varepsilon}}^{l/\sqrt{\varepsilon}} \frac{\mathrm{d} u}{(1+u^2)^2}=\frac{\rm \pi}{\varepsilon^{3/2}\sqrt{2}}. \end{equation}
Similarly, the denominator integral in (5.23) is obtained as  ${3{\rm \pi} }/{4\varepsilon ^{5/2}\sqrt {2}}$ so that finally,
 \begin{equation} U_z=\sqrt{\frac{8\varepsilon}{3{Pe}}}. \end{equation}
This result is consistent with the qualitative and quantitative simulations and analysis of §§ 4 and 5.1 when  $\kappa \rightarrow 1$. It further validates analytically the numerical prefactors obtained in § 5.1 from the simulation results for the swimming velocity
 $U_z$, mean fluid velocity in the gap
 $W$ and concentration contrast
 ${\rm \Delta} c$, (5.8a–c) so that as
 $\kappa \rightarrow 1$, the leading-order behaviour of the swimming velocity, mean fluid velocity in the gap and global concentration contrast are
 \begin{equation} U_z\sim 2\sqrt{\frac{2(1-\kappa)}{3{Pe}}},\quad W\sim \sqrt{\frac{2}{3{Pe}(1-\kappa)}},\quad {\rm \Delta} c \sim \sqrt{\frac{6}{{Pe}(1-\kappa)}}. \end{equation}
6. Conclusions and perspectives
Following recent experimental observations and characterisation of the behaviour of chemically active droplets inside small capillaries (de Blois et al. Reference de Blois, Bertin, Suda, Ichikawa, Reyssat and Dauchot2021), the influence of spatial confinement on the self-propulsion of such droplets was investigated here using a combination of direct numerical simulations and asymptotic analysis.
To overcome the triple challenge posed by the complex geometry of the problem, the nonlinear hydrochemical coupling and the need for a precise implementation of surface boundary conditions, we specifically developed a novel approach based on embedded boundaries and implemented on top of the popular flow solver Basilisk (Popinet Reference Popinet2015). Our focus was here on the axisymmetric motion of a single particle along the centreline of a straight capillary. Nevertheless, the framework is completely general and can be easily adapted to account for more complex geometric domains and/or larger numbers of particles.
Using this versatile numerical tool, we analysed the dual effect of spatial confinement and of convective transport of the solute. The particle-to-capillary size ratio,  $\kappa$, was found to alter significantly the dynamics of an isotropic autophoretic swimmer, generally promoting and enhancing self-propulsion. Indeed, with increased confinement (larger
 $\kappa$), the self-propulsion threshold
 ${Pe}_c$ is starkly reduced, becoming essentially negligible as
 $\kappa \rightarrow 1$. Additionally, for fixed
 ${Pe}\geq {Pe}_c$, the swimmer's velocity increases significantly with confinement, up to a maximum value reached for
 $0<\kappa <1$, before decreasing again and vanishing as
 $\sqrt {1-\kappa }$ when
 $\kappa \rightarrow 1$ (near-contact limit). For fixed
 $\kappa$, the swimming velocity of strongly confined particles scales as
 $1/\sqrt {{Pe}}$.
Below the self-propulsion threshold  ${Pe}_c$, convective transport is not sufficient to destabilise a symmetric solution and the system relaxes (in time) toward a front-back symmetric solute distribution and no particle motion. Note that, no steady state can be reached for the concentration whose average value around the particle increases linearly in time as diffusion, restricted to occur along the axis of the capillary, is not sufficient to transport away the solute produced at the particle surface. Yet, a steady regime is reached for the concentration gradients and flow fields.
These observations stem from a fundamental alteration of the chemical transport, as the presence of the confining passive walls prevents solute diffusion away from the particle, except along the capillary axis. Then, convective transport becomes the predominant mechanism to balance the solute production by the swimmer, resulting in an increased front-aft concentration contrast as the particle leaves a solute-saturated wake behind. The phoretic surface slip velocities are thus increased promoting the particle's self-propulsion, despite the increased viscous stresses introduced by the lateral confinement. When  $\kappa \rightarrow 1$, the particle dynamics is in fact completely driven by the most confined regions consisting of a thin fluid gap around the particle's equator. The solute distribution is homogeneous across this thin fluid layer, and the flow field is completely driven by the phoretic slip at the particle surface.
We confirmed these results in the near-contact limit ( $\kappa \rightarrow 1$) using lubrication analysis, that demonstrated that, for
 $\mbox {Pe}=O(1)$, the concentration gradient inside the lubrication region is, in fact, essentially uniform and set by the balance of mass and solute between the upstream and downstream regions, in stark contrast with what is observed for weaker confinement such as a particle near an infinite planar wall (Desaï & Michelin Reference Desaï and Michelin2021). Using these arguments, a predictive model for the swimming velocity with no fitting parameter was obtained and validated against the direct numerical simulations. This model confirmed the dependence with
 $\kappa$ and
 ${Pe}$ of the swimming velocity, as well the existence of an optimal confinement maximising self-propulsion. The detailed dynamics of the solute and particle near the propulsion threshold (
 $\mbox {Pe}\approx \mbox {Pe}_c$) remains however to be characterised.
Throughout this work, we adopted a simplified phoretic model with a rigid particle generating slip flows in response to chemical gradients; yet, the similarity in the solute transport dynamics between rigid isotropic particles and active droplets (Izri et al. Reference Izri, van der Linden, Michelin and Dauchot2014; Morozov & Michelin Reference Morozov and Michelin2019a) suggests that much of the qualitative conclusions presented here remain valid if a more complete hydrodynamic description of the droplet is retained, in particular the dominant dependence of the velocity with  $(\kappa,{Pe})$. Despite our focus on a strictly confined geometry (i.e. a capillary surrounding the particle tightly), our results shed fundamental light on the role of the lubrication layer. This is critical for understanding the propulsion of active droplets along flat boundaries or in Hele–Shaw geometries, although the absence of confining walls around most of the particle surface introduces key distinctive features in the solute transport and associated dynamics (e.g. the critical threshold
 ${Pe}_c$ is reduced to a reduced
 $O(1)$ value as the particle gets closer to the wall; see Desaï & Michelin Reference Desaï and Michelin2021).
Finally, our numerical framework unlocks the possibility to simulate the full nonlinear hydrodynamic coupling leading to spontaneous motion of autophoretic swimmers under any generic confinement and for many particles. In particular, it can be used to analyse the off-axis self-propulsion of the particle and the detailed stability of the axisymmetric solution considered here with respect to fully three-dimensional perturbations, which was purposely left here for a later publication for clarity. This would provide some critical insight into the non-straight motion observed experimentally for mildly confined active droplets (de Blois et al. Reference de Blois, Bertin, Suda, Ichikawa, Reyssat and Dauchot2021). It could also provide a much needed understanding of the individual dynamics of active droplets in complex geometries (Jin et al. Reference Jin, Vachier, Bandyopadhyay, Macharashvili and Maass2019) or their collective organisation (Hokmabad et al. Reference Hokmabad, Saha, Agudo-Canalejo, Golestanian and Maass2020; Illien et al. Reference Illien, de Blois, Liu, van der Linden and Dauchot2020).
Funding
This work was supported by the European Research Council (ERC) under the European Union's Horizon 2020 research and innovation program (grant agreement no. 714027 to S.M.).
Author contributions
S.M. designed research, F.P. developed the numerical framework and performed the simulations, and S.M. developed the theory. All authors contributed to analysing the data and writing the paper.
Declaration of interests
The authors report no conflict of interest.