


Adequate intake of n-3 long-chain PUFA, such as DHA and EPA, plays an important role in human health(Reference Riediger, Othman and Suh1). High DHA and EPA levels in blood lipids have been associated with improved infantile development, lower risk of CHD, lower incidence of cancer and avoidance of mental diseases(Reference Riediger, Othman and Suh1).
A modest increase in DHA and EPA uptake ( < 300 mg/d) can rapidly alter the fatty acid composition of blood lipids(Reference Fekete, Marosvolgyi and Jakobik2). The incorporation of EPA and DHA into individual blood lipid fractions is time- and dose-dependent and differs between n-3 fatty acids(Reference Masson, Latini and Tacconi3). The quantity of administered n-3 fatty acids determines total changes in tissues(Reference Brown, Pang and Roberts4–Reference Katan, Deslypere and van Birgelen6). Plasma phospholipids (PL) or cholesteryl esters reach n-3 fatty acid equilibrium within 2 weeks, erythrocytes after approximately 120 d and adipose tissues after 1–2 years(Reference Katan, Deslypere and van Birgelen6, Reference Arterburn, Hall and Oken7). In most biological compartments, changes of EPA levels occur earlier and are more pronounced than changes of DHA(Reference Brown, Pang and Roberts4–Reference Katan, Deslypere and van Birgelen6, Reference Zuijdgeest-van Leeuwen, Dagnelie and Rietveld8). This might be related to different affinities of EPA and DHA to lecithin-cholesterol acyltransferase(Reference Subbaiah, Kaufman and Bagdade9), different clearance rates of both n-3 fatty acids from plasma to adipose tissue(Reference Zuijdgeest-van Leeuwen, Dagnelie and Rietveld8) or the displacement of DHA by EPA in plasma PL(Reference Arterburn, Hall and Oken7). Moreover, the conversion of EPA to DHA is very limited(Reference Brenna, Salem and Sinclair10), whereas retroconversion of DHA to EPA was observed after DHA supplementation(Reference Plourde, Chouinard-Watkins and Vandal11).
Strong correlations exist for EPA and DHA percentages between plasma and erythrocyte lipids(Reference Arterburn, Hall and Oken7, Reference Geppert, Kraft and Demmelmair12) and other tissues, such as cardiac tissue(Reference Harris, Sands and Windsor13), brain cortex(Reference Makrides, Neumann and Byard14) and cheek cell glycerophospholipids (GPL)(Reference Klingler, Demmelmair and Koletzko15). Correlations of n-3 long-chain-PUFA contents between adipose tissue and blood lipids are low or absent(Reference Baylin, Kim and Donovan-Palmer16, Reference Ogura, Takada and Okuno17). While the fatty acid analysis of blood lipids offers a measure for the fatty acid intake over the last few weeks, the analysis of subcutaneous fat reflects long-term fat intake(Reference Arab18). Plasma PL or cholesteryl esters, erythrocyte PL, whole blood or plasma total lipids and adipose tissue are the preferred markers for n-3 fatty acid status in humans since n-3 long-chain-PUFA contents of these tissues are strongly correlated with dietary fat intake(Reference Hodson, Skeaff and Fielding19).
Cheek cell PL have also been recommended as a biological marker for dietary fatty acid intake(Reference McMurchie, Margetts and Beilin20), but they have rarely been used in clinical studies. This might be related to insecure sample quality and quantity and additionally required sample handling procedures(Reference Harris, Sands and Windsor13). On the other hand, sampling of cheek cells is less invasive than blood or adipose tissue sampling and therefore better accepted, particularly when applied in infants or children. Recently, we developed a robust method for the analysis of cheek cell GPL fatty acids, which requires only minimal sample amounts(Reference Klingler, Demmelmair and Koletzko15).
This method has been applied in a 29 d DHA supplementation trial. The supplement did not provide appreciable amounts of n-3 fatty acids other than DHA to avoid influences of these fatty acids on DHA incorporation into the studied compartments. The aims of the present study were the comparison of the time course of DHA incorporation into cheek cell, plasma and erythrocyte GPL, and the determination of the correlation of DHA between these tissues. The results of this study will show whether cheek cells reflect short-term or long-term changes in dietary fat intake and may underpin the suitability of cheek cells as a fatty acid status marker.
Materials and methods
Subjects
A total of thirteen volunteers were recruited for a supplementation study with DHA. Towards this, seven healthy females and six males between 20 and 40 years of age with a BMI of 20–25 kg/m2 were invited. Participants ought not to have taken n-3 long-chain-PUFA supplements or medication assumed to interfere with the lipid metabolism 3 months before the start of the study. Further exclusion criteria were pregnancy, fatty fish consumption more than once per week, a weight reduction diet 4 weeks before study commencement and the abuse of alcohol or drugs.
The present study was conducted according to the guidelines laid down in the Declaration of Helsinki and all procedures involving human subjects were approved by the Ethical Committee of the University of Munich Medical Center (034-10). Written informed consent was obtained from all subjects before study commencement. The trial was registered at ClincialTrials.gov (NCT01192269).
Experimental design and supplements
The study consisted of a 2-week baseline period followed by a 29 d intervention period and included clinical examinations at the beginning and the end of the study. Blood and cheek cells were sampled eleven times during the trial, on days − 14, 0 (start of intervention), 1, 2, 3, 4, 9, 14, 18, 24 and 29 (end of intervention). The study supplement consisted of a 950 μl DHASCO®-S microalgae oil capsule (Martek Biosciences) containing 510 mg DHA (Table 1). The content of EPA and other n-3 fatty acids was negligible ( < 0·4 %). Over the first 5 d, capsules were administered directly after blood and cheek cell sampling. The capsules for the remaining intervention period were handed out at day 5, and the participants were asked to take one capsule daily with breakfast and to record the time of consumption. Capsule counts were conducted at the end of the study.
Selected fatty acids of the study supplement (950 μl capsule) according to the manufacturer
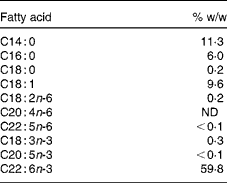
ND, not detected.
Glycerophospholipid fatty acid analysis of erythrocyte, cheek cell and plasma lipids
The analysis of erythrocytes was conducted with a modified method for plasma GPL analysis(Reference Glaser, Demmelmair and Koletzko21). Briefly, after an overnight fast, venous blood was collected into 7·5 ml EDTA Monovettes (Sarstedt) and directly placed on ice. Cooled samples were centrifuged (1000 g, 10 min, 4°C) within 2 h after sampling. Plasma was separated, the buffy-coat was discarded, and remaining blood cells were washed three times with saline (0·9 % NaCl).
A volume of 100 μl erythrocytes was haemolysed by the addition of 100 μl water; thereafter, 1300 μl methanol plus 100 μl internal standard (14·6 mg dipentadecanolyl-sn-glycero-phosphocholine, phosphatidylcholine 15:0, in 100 ml methanol; Sigma Aldrich) were added during continuous shaking. The suspension was kept in an ultrasound water bath (40 kHz, 120 W) for 5 min. Precipitated proteins were separated by centrifugation (3030 g, 10 min, 4°C), and the methanolic supernatant containing polar lipids was transferred into a small brown glass. Then, 50 μl of sodium methoxide solution (25 wt% in methanol; Sigma Aldrich) were added to synthesise fatty acid methyl esters (FAME) from erythrocyte GPL at room temperature. After 4 min, the reaction was stopped with 150 μl 3 m-methanolic HCl (Sigma Aldrich). FAME were extracted twice into 600 μl hexane, the extracts were combined, hexane was evaporated under a continuous flow of N2, and the FAME were re-dissolved in 40 μl hexane (containing 2 g/l butylated hydroxytoluene). Samples were stored at − 20°C until GC analysis.
The analysis of GPL fatty acids from cheek cells and plasma required a slightly different sample preparation and was performed as recently described(Reference Klingler, Demmelmair and Koletzko15, Reference Glaser, Demmelmair and Koletzko21). Briefly, cheek cells were collected with an endocervical brush and additional mouth rinse. Cheek cells were isolated by centrifugation before they were suspended in 1400 μl methanol including phosphatidylcholine 15:0 as internal standard. The methanolic cell suspension was treated with ultrasound for 20 min and the precipitated proteins were removed by centrifugation. FAME synthesis and extraction were performed as described previously. The analysis of plasma GPL did not require sample pre-treatment. Methanol and internal standard were added directly to plasma for protein precipitation.
FAME were quantified by GC with flame ionisation detection (Agilent 5890 series II), using a 25 m × 0·22 mm (inner diameter) BPX70 column (SGE). Injection temperature was set to 250°C, the split ratio was 1/30 and He was used as the carrier gas. The oven temperature was programmed to rise from 150 to 180°C at 2·5°C/min, followed by 1·5°C/min to a final temperature of 200°C, which was held for 1 min. The pressure program started at 0·9 bar, and pressure increased by 0·02 bar/min to 1·2 bar, 0·05 bar/min to 1·5 bar, and 0·1 bar/min to a final pressure of 2·0 bar. This pressure was held until the temperature program was completed(Reference Glaser, Demmelmair and Koletzko21).
FAME were identified by comparison with a FAME standard mixture (GLC-569B, Nu-Check Prep, Inc.). All FAME response relative to pentadecanoic acid methyl ester (internal standard) was determined using GLC-85 (Nu-Check Prep, Inc.) as external standard. EZChrom Elite (version 3.1.7, Agilent) was used for peak integration.
Dietary records
Participants recorded their total food and beverage consumption on three consecutive days including one weekend day a week before the start of the intervention period. Nutrient intakes were calculated using PRODI (version 4.5 LE, Nutri-Science), which is based on the nutrient data bank of Souci-Fachmann-Kraut (version 2000) and the ‘Bundeslebensmittelschlüssel’ (version 2.3).
Mathematical modelling and statistical analysis
Curves of averaged DHA percentage increases (y) of plasma, erythrocyte and cheek cell GPL were fitted according to the least square using OriginPro, version 8.5 software (originLab), by varying the parameters a, b and c of the equation
 $$\begin{eqnarray} y = a \times (1 - e ^{ - bx })^{ c } \end{eqnarray}$$
where x is the time in d since the onset of supplementation, and a, b and c are constants. The parameter a represents the upper limit of the DHA percentage increase, which is approached with infinitive time (x), while parameters b and c define the shape of the exponential increase. With c= 1, this equation was used by Katan et al. (Reference Katan, Deslypere and van Birgelen6) to model changes of EPA and DHA in cholesterol esters, erythrocytes and adipose tissue during fish oil supplementation. The time of the half-maximal DHA incorporation t 1/2 can be calculated as DHAt 1/2= − 1/b× ln(1 − 2− 1/c).
Statistical analysis was performed using IBM SPSS Statistics for Windows, version 19.0.0.1 (IBM). Relative fatty acid contents (mol%) are given as mean and standard deviation based on twenty detected cis-fatty acids with chain lengths between 14 and 24 carbon atoms(Reference Glaser, Demmelmair and Koletzko21). Changes from baseline to day 29 were expressed as mean difference and 95 % CI, significance of differences was evaluated using paired t tests. Correlation coefficients between compartments at baseline were evaluated according to Pearson. P values < 0·05 were considered as statistically significant.
Results
Baseline characteristics and nutrient intake
The compliance of the subjects was very good, and twelve of the thirteen participants followed exactly the study protocol. However, one participant consumed twenty-eight instead of twenty-nine capsules. This resulted in a DHA intake of about 96 % of the planned dose; therefore this subject was not excluded from the study.
Baseline characteristics of the study subjects and their average nutrient intake are presented in Table 2. The characteristics described did not change during the study (data not shown). No adverse effects were reported during the intervention period.
Characteristics of the study participants (n 13) and their nutrient intake at baseline (Mean values and standard deviations)

GT, glutamyl transpeptidase; GPT, glutamic pyruvic transaminase; GOT, glutanic oxaloacetic transaminase; CRP, C-reactive protein.
Plasma, erythrocyte and cheek cell glycerophospholipid fatty acid compositions
Table 3 shows the GPL fatty acid compositions of plasma, erythrocytes and cheek cells, determined before (averaged fatty acid baseline values of day − 14 and day 0) and after the supplementation period (day 29). The majority of individual GPL fatty acid proportions differed significantly between the three compartments. Palmitic-, stearic-, oleic-, linoleic- and arachidonic acids (ARA) were the predominant fatty acids in plasma and erythrocytes, averaging 88·0 (sd 1·4) and 85·0 (sd 1·2) mol%, respectively. In cheek cells, palmitic-, stearic-, oleic-, linoleic- and palmitoleic acids presented the major fatty acids comprising 86·3 (sd 1·0) mol%. Erythrocytes contained the highest levels of ARA and DHA averaging 15·2 (sd 1·6) and 4·3 (sd 0·8) mol%, followed by plasma with 10·1 (sd 1·5) and 2·7 (sd 0·5) mol% and cheek cells with 3·2 (sd 0·6) and 0·7 (sd 0·1) mol%, respectively.
Fatty acid compositions (mol%) of plasma, erythrocytes† and cheek cells at baseline (Mean values, standard deviations, mean difference and 95 % confidence intervals; n 13)

Significant changes of individual fatty acid contents during intervention are indicated as * P< 0·05, ** P< 0·01 or ***P< 0·001; one-sample t test.
† Erythrocyte values for samples stored for 8 months have been reported elsewhere(Reference Klem, Klingler and Demmelmair34).
The additional DHA intake of 510 mg/d significantly increased the DHA content in all three compartments, which was by 2·20 mol% (95 % CI 1·66, 2·73; P< 0·001) in plasma, 1·18 mol% (95 % CI 0·89, 1·46; P< 0·001) in erythrocytes and 0·54 mol% (95 % CI0·43, 0·66; P< 0·001) in cheek cells at the end of the study. ARA proportions decreased during the same period, but differences were only in plasma statistically significant ( − 1·01 mol%; 95 % CI − 1·52, − 0·49; P <0·002). Proportions of plasma linoleic acid decreased during the intervention period ( − 1·35 mol%; 95 % CI − 2·47, − 0·23; P= 0·022), but this change was not observed in erythrocytes or cheek cells. EPA contents were not significantly affected by DHA supplementation. The study was not adequately powered to determine reliably changes in fatty acids other than DHA; thus the changes and correlations between percentages in different compartments were analysed on an explorative basis only.
Correlation coefficients were computed between individual fatty acids of all three compartments at baseline (Table 4). Major cheek cell fatty acids, such as oleic- and linoleic acid did not correlate with erythrocytes and plasma, while significant correlations were found for palmitic (r 0·64) and stearic acids (r 0·70). High correlations were found for DHA contents between cheek cells and erythrocytes as well as cheek cells and plasma (r 0·88 and 0·76, respectively), and for EPA between the same compartments (r 0·79 and r 0·66, respectively). The sum of both n-3 fatty acids DHA and EPA was also highly correlated (r 0·87 and r 0·72, respectively). Correlations for ARA were only found between cheek cells and plasma (r 0·65), but not between other compartments. Most of the fatty acids in plasma and erythrocytes were highly correlated, except for palmitic acid, oleic acid, vaccenic acid, and ARA. Correlations calculated for EPA, DHA and EPA+DHA were similar to those of cheek cells and erythrocytes.
Correlation coefficients of individual glycerophospholipid fatty acids between cheek cells, erythrocytes and plasma before DHA supplementation
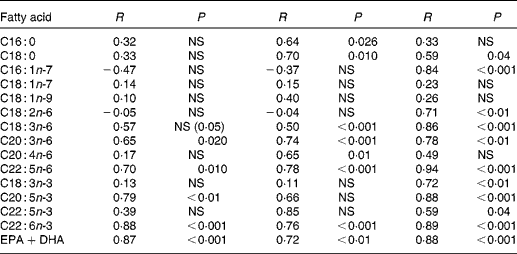
NS, P>0·05, Pearson's correlation coefficient.
At the end of the study, correlations for DHA levels between cheek cells and plasma (r 0·60, P= 0·03) or erythrocytes (r 0·77, P= 0·002) tended to be lower, whereas DHA levels did not correlate any more between plasma and erythrocytes (r 0·353, NS).
Incorporation of DHA in plasma, erythrocytes and cheek cells
Fig. 1 shows changes of DHA mol% in plasma, erythrocyte and cheek cell GPL over the course of supplementation. The mean DHA increase (mol%) relative to the baseline level was most prominent in plasma (186 %), followed by cheek cells (180 %) and erythrocytes (130 %).
DHA changes from baseline in different compartments of subjects supplemented with 510 mg DHA daily over 29 d. Values are means with standard deviations represented by vertical bars. Curves were fitted to y = a× (1 − e − bx)c resulting in the following parameters for plasma (■): a= 2·25, b= 0·07, c= 0·52; erythrocytes (●): a= 1·09, b= 0·10, c= 0·97 and cheek cells (▲): a= 0·68, b= 0·10, c= 1·68.

The parameter a, representing the estimated maximal increase of DHA∞, was 2·25, 1·09 and 0·68 for plasma, erythrocytes and cheek cells. The parameters b and c describe the course of the increase over time with 0·07 and 0·52 for plasma, 0·10 and 0·97 for erythrocytes, and 0·10 and 1·68 for cheek cells. The parameters are based on the collected data points until day 29 and thus may not reflect processes mostly effective during longer intervention periods. Solving the equation used for time until half of the expected maximal increase is reached (DHAt 1/2), yielded 4·4 d for plasma, 6·4 d for erythrocytes and 10·4 d for cheek cells.
Discussion
This is the first study evaluating the incorporation rate of DHA into cheek cell GPL in comparison to plasma and erythrocyte GPL. High correlations are found for DHA between all three compartments. In our 29 d supplementation trial (510 mg DHA/d), a half-maximal GPL DHA level is reached after about 4 d in plasma, 6 d in erythrocytes and 10 d in cheek cells. The relative response to DHA supplementation is highest in plasma and cheek cells. Our findings support the use of cheek cells as a n-3 fatty acid status marker.
The distribution of total GPL fatty acids in cheek cell and plasma determined in our study cohort is comparable to other studies(Reference Klingler, Demmelmair and Koletzko15, Reference Glaser, Demmelmair and Koletzko21, Reference Glaser, Demmelmair and Sausenthaler22). Data for fatty acid contents of total GPL in erythrocytes are not available. However, our results can be compared to those reported for erythrocyte total fatty acids(Reference Geppert, Kraft and Demmelmair12), although differences for some individual fatty acids are indicated. This might be related to the contribution of sphingomyelin fatty acids to erythrocyte total fatty acids. Sphingomyelin contains high amounts of palmitic acid and only traces of n-3 fatty acids(Reference Kornsteiner, Singer and Elmadfa23). This is reflected in the respective patterns of erythrocyte total and GPL fatty acids.
At the start of the study, GPL DHA proportions of cheek cells in our subjects averaged 0·7 mol% (0·8 wt%), which is comparable to DHA levels in cheek cell PL reported for breastfed infants(Reference Connor, Zhu and Anderson24, Reference Hoffman, Birch and Birch25), elderly people(Reference Harris, Sands and Windsor13) and cheek cell GPL in adults(Reference Klingler, Demmelmair and Koletzko15). In comparison to plasma and erythrocytes, the DHA content of cheek cells is approximately one-third. This may limit the validity of cheek cell GPL as a fatty acid status marker, but it has been shown that changes of n-3 and n-6 fatty acid uptakes are reflected in cheek cell lipids similarly to erythrocytes or plasma(Reference Harris, Sands and Windsor13, Reference Connor, Zhu and Anderson24–Reference Hoffman and Uauy26). Moreover, the outcome of our supplementation study shows that the relative DHA increase in cheek cells is comparable to that in plasma, which is in agreement with DHA changes reported for plasma (104 wt%) and cheek cell PL (95 wt%) in patients receiving 400 mg DHA per d over a period of 6 months(Reference Harris, Sands and Windsor13).
Little is known about DHA incorporation into cheek cells. The oral mucosa is an avascular stratified squamous epithelium(Reference Salamat-Miller, Chittchang and Johnston27). Cells of the base membrane are continuously renewed by mitosis, and migrate through the epithelium to the surface(Reference Hill, Meyer, Squier and Gerson28). The nutrient and metabolite content of the outer epithelium layer is determined by cell migration and to a smaller extent by diffusion(Reference Salamat-Miller, Chittchang and Johnston27). The estimated renewal time of buccal cheek cells is 5–8 d(Reference Gillespie29, Reference Kaidbey and Kurban30). These characteristics of the oral mucosa suggest that DHA changes in the analysed outer epithelial layer can be expected not earlier than 5 d after the onset of supplementation. Such a delay is observed in our study, although an increase is indicated after 1 d, which might be explained by passive transport mechanisms. However, we have no information about the exact time when the increase took place, as samples between day 5 and day 8 were not collected. Considering the lag-phase of at least 5 d, half-maximal DHA levels are reached quickly, which is comparable to plasma. DHA contents in cheek cells do not further increase after 24 d, suggesting that DHA equilibrium is reached at about this time. These data indicate that cheek cells reflect short-term changes of the dietary n-3 fatty acid pattern; however, a delayed increase at the start of the intervention has to be considered.
Plasma and erythrocyte lipids are used as biological markers for dietary fat intake. Their n-3 and n-6 fatty acid contents are highly correlated(Reference Geppert, Kraft and Demmelmair12). Correlations described for cheek cells with other biological markers are mainly related to DHA, EPA and ARA. Strong correlations have been shown for DHA between cheek cell PL and plasma PL (r 0·83), erythrocyte total lipids (r 0·72)(Reference Hoffman, Birch and Birch25), plasma total lipids (r 0·61)(Reference Connor, Zhu and Anderson24) and serum PL (r 0·72)(Reference Laitinen, Sallinen and Linderborg31). In our study, correlation coefficients of r >0·75 have been determined between DHA in cheek cell, plasma and erythrocyte GPL. Correlations between cheek cell and plasma EPA have been only reported in a single study(Reference Laitinen, Sallinen and Linderborg31), in which the r-value of 0·56 is similar to that in our study. Correlations of ARA levels between cheek cells and blood compartments have also already been determined, but results are inconsistent. Whereas ARA contents correlated between cheek cell and serum PL(Reference Laitinen, Sallinen and Linderborg31), none or weak relationships were reported between cheek cell PL and plasma PL or erythrocyte total lipids(Reference Connor, Zhu and Anderson24, Reference Hoffman, Birch and Birch25). No correlations have been found between ARA levels in plasma and erythrocyte total fatty acids(Reference Bailey-Hall, Nelson and Ryan32). Our results confirm previous findings, where correlations were only indicated between cheek cells and plasma, but not between the other compartments.
The supplementation of DHA as an individual n-3 fatty acid was chosen to exclude the effects of other fatty acids on the incorporation of DHA into GPL. Consuming fish or fish oil capsules may result in different DHA levels than those observed in our study due to the competition of EPA and DHA for the sn-2 position of GPL. There was no control group without DHA supplementation included, and hence we cannot compare the intervention effects to a reference group. Systematic changes of fatty acid compositions during the study period cannot be excluded, but such changes are not expected during a 4-week period. An estimate for random variation was obtained by duplicate baseline measurements within 2 weeks before study start. In all compartments, differences for DHA percentages were small compared to those observed after supplementation (data not shown). Also, providing DHA only allows detecting changes in EPA related to retroconversion. Based on the EPA results, retroconversion did not take place during the supplementation period of 29 d. We cannot exclude that with a prolonged intervention time a further increase in DHA proportions would have occurred in the three compartments. However, this seems unlikely as DHA in cheek cells derives from plasma lipids, and plasma DHA levels reach equilibrium within 1 month.
While the studied daily supplementation with 510 mg DHA is clearly above the average habitual DHA intake in most countries(Reference Ian Givens and Gibbs33), this dosage has frequently been applied in interventional studies to test DHA effects(Reference Fekete, Marosvolgyi and Jakobik2). We tested only the kinetics of DHA incorporation following a change in intake from about 80 mg DHA to 590 mg per d. Nevertheless, we assume that with lower DHA intakes similar curves, with lower maximal changes, would be observed as for DHA supplementations up to 1 g/d increases in plasma PL DHA percentages have been found to be proportional to intake increases(Reference Arterburn, Hall and Oken7). On the other hand, a further increase of the supplementation dose leads to disproportional increases of DHA in plasma(Reference Arterburn, Hall and Oken7) and kinetics will probably differ. In case of very low basal DHA levels and/or minute changes of DHA intakes, cheek cell GPL analysis might be disadvantageous compared to plasma or erythrocytes, as cheek cells contain less GPL DHA which may influence the relative error of measurements unfavourably.
In summary, after a lag-phase of a few days, cheek cells respond quickly to DHA supplementation. The relative increase over 4 weeks is comparable to plasma, although the proportion of DHA in cheek cells is small compared to plasma and erythrocytes. This indicates that cheek cells reflect short-term changes in dietary fatty acid composition. Furthermore, sampling of cheek cells is simple and applicable in a non-clinical environment. Based on the results of this study, cheek cell GPL are an alternative to plasma and erythrocyte PL as biological markers for n-3 fatty acid status, especially in n-3 fatty acid supplementation trials and studies, where blood sampling is difficult or not applicable.
Acknowledgements
The authors gratefully acknowledge the provision of the DHASCO®-S microalgae oil by Martek Biosciences. Furthermore, the authors thank Dr Claudia Matthies for her valuable support during the intervention trial and subsequent sample analysis. The present study was financially supported by the Federal Ministry of Education and Research (0315680B). B. K. is receiving a Freedom to Discover Award of the Bristol-Myers Squibb Foundation, New York, NY. The methods for the GPL FA analysis presented in this article are in patent pending status. M. K., H. D. and B. K. conceived and designed the experiments of the clinical study; M. K. and S. K. performed the experiments; M. K. and H. D. analysed the data. M. K., S. K., H. D. and B. K. wrote the paper and were responsible for the review and approval of the manuscript. The authors have no conflicts of interest to declare.



