


Introduction
Positive degree-day (PDD) models, which relate melt to the accumulated total of positive daily temperatures, have been used for over 100 years. Many of them use temperature from a weather station near the glacier and estimate the glacier-average summer balance Bs. Although PDD models are widely viewed as crude, embodying less explicit representation of energy transfer processes, their accuracy is comparable to that of more detailed energy-balance models (Reference HockHock, 2003). Reference OhmuraOhmura (2001) explains that the temperature term is highly relevant, being a measure not only of sensible heat but also of downwelling longwave radiation. Together they ‘account for three quarters of the entire energy source for melt’ and ‘wind speed is only weakly correlated with melt rate’.
In field studies of Aletschgletscher in the Swiss Alps, Reference Lang and BraunLang and Braun (1990) found that temperature T ‘observed at a snow-free valley station, 60 km far from the glacier, provides more information about daily variations of melt rates at the glacier surface than T observations made near it’.
Because of inaccuracy in precipitation measurements at altitude, particularly snowfall, precipitation at a low-altitude station where more falls as rain is usually a better estimator of glacier precipitation. Gauge catch decreases with increasing wind speed, resulting in an undercatch of 3–10% for rainfall and 50% or more for snowfall (Reference Groisman and LegatesGroisman and Legates, 1994). Reference Hayes, Rasmussen and ConwayHayes and others (2002) found correlations of r∼+0.9 in monthly precipitation between nine stations in a region ∼50×100 km in the Cascade Range, ∼180 km to the south of South Cascade Glacier, Washington, USA.
In this paper, published glacier-average mass-balance values are denoted B to distinguish them from values B adjusted to a fixed topography (1970).
South Cascade Glacier
South Cascade Glacier (48.36 ˚ N, 121.06 ˚ W) is a small north-facing glacier on the crest of the North Cascade Range of northwest Washington, 250 km from the Pacific Ocean (Fig. 1). It has an altitude range of 1630–2130ma.s.l. and, in 2005, an area of 1.75 km2 (Reference Bidlake, Josberger and SavocaBidlake and others, 2007). The US Geological Survey (USGS) established a research program there in the mid-1950s and has continued extensive monitoring since.
Northwest Washington state, USA, showing South Cascade Glacier (SCG), Diablo Dam (DD), Forks and Seattle.

The mean published glacier-average net balance Bn during 1986–98 was –0.89mw.e. Reference Rasmussen and ConwayRasmussen and Conway (2001) calculated that if that value persisted indefinitely, glacier area would decrease to ∼0.55 km2. The mean was –0.91mw.e. during 1999–2006.
Data sources
Annual values of seasonal mass-balance components, averaged over the surface of the glacier, are given by Reference Bidlake, Josberger and SavocaBidlake and others (2007) for South Cascade Glacier for the period 1959–2005. Daily temperature extremes T max and T min for the 24 hour period beginning at 0000 local standard time are tabulated in previous USGS reports for balance years 1998–2005, missing observations on only 12 days. Preliminary mass-balance values for 2006 were also supplied (personal communication from B. Bidlake, 2007).
At Diablo Dam (41 km north of the glacier), daily temperature and precipitation are measured at 0800 by Seattle City Light. These measurements, which have been made since 1934, are published monthly by the US National Oceanic and Atmospheric Admnistration (NOAA) and its predecessor organization in the Climatological Data, Washington series. Measurements have been made at the powerhouse in front of the dam (271m), except between April 1935 and December 1944 when the observations were made at the top of the dam (371 m). Monthly mean temperature and precipitation at Diablo Dam during 1945–2006 are shown in Figure 2.
Mean 1945–2006 climatological conditions at Diablo Dam: (a) mean daily maximum temperature T max (upper curve) and minimum temperature T min (lower curve) on days with precipitation P > 1 mm (closed circles) and with P ≤ 1 (open circles); (b) mean daily P in mmd − 1; and (c) fraction of days with P > 1.

Over the reconstruction period 1935–58, precipitation and temperature observations are missing on only three winter days and on only seven summer days, respectively. Over the period with mass-balance measurements, 1959–2006, precipitation and temperature observations are missing on 156 winter days and on 99 summer days, respectively. Missing data were filled in by linear regression with observations at Concrete, 53 km west-southwest of Diablo Dam. It is fortunate that observations were made at Concrete on almost every day of missing data at Diablo Dam, although the record at the former is much less complete.
Monthly mean normalized values of the Pacific Decadal Oscillation (PDO) were downloaded in February 2007 (http://jisao.washington.edu/pdo/PDO.latest).
Previous modelling
Several models have been published that relate glacier mass balance to observations at a nearby weather station. Reference TangbornTangborn (1980) extended South Cascade Glacier net balance Bn back to 1884 using weather observations at Snoqualmie Falls (110 km to the southwest at 131 m). Monthly precipitation and mean maximum and minimum temperatures are published back to 1899; the record was extended back to 1884 using the correlation with Seattle and North Head (at the mouth of the Columbia River). During the period 1959–74, for which mass-balance data are available, a linear regression model had a root-mean-square (rms) error of 0.38 mw.e. for B n (r 2 = 0.82) but failed to resolve the winter and summer components, Bw and Bs. Reference TangbornTangborn (1999) used daily data from Diablo Dam to model Bn for the period 1959–96, obtaining an rms of 0.75.
South Cascade Glacier mass balance has been related to large-scale atmospheric circulation indices. Reference McCabe and FountainMcCabe and Fountain (1995) found a negative correlation (r 2 =0.58 during 1959–90) between Bw and a 700 hPa geopotential height over western Canada. Reference Bitz and BattistiBitz and Battisti (1999) found a negative correlation during 1959–95 between the November– April PDO and Bw (r 2 =0.56) and Bn (r 2 =0.42). The PDO is the first principal component of monthly sea-surface temperature anomalies in the North PacificOcean north of 20 ˚ N.
Reference Rasmussen and ConwayRasmussen and Conway (2001) used upper-air conditions, measured by a radiosonde at a station 250 km to the west, to model Bw. During 1959–98, an rms error of 0.24mw.e. (r
2 = 0.85) was obtained. Because of the strong correlation between Bn and Bw (r = +0.79 over that period), an rms of 0.53 mw.e.(r
2 =0.65) for Bn was found. Reference Rasmussen and ConwayRasmussen and Conway (2003) used upper-air conditions in the US National Centers for Environmental Prediction–US National Center for Atmospheric Research (NCEP–NCAR) reanalysis database (Reference KalnayKalnay and others, 1996; Reference KistlerKistler and others, 2001) at a grid-point 310 km to the west-southwest to model Bs. During 1959–99 it had an rms error of 0.30 mw.e. (r
2 =0.71). When the two models were combined, the rms error in estimating  was 0.40 mw.e. (r
2 =0.81).
Adjusting Published Mass Balance to 1970 Reference Topography
Whereas all previous models of South Cascade Glacier mass balance have used published values of components, here denoted Bw, Bs and Bn, this analysis uses values adjusted to a fixed topography. The published values for a particular year are averaged over that year’s glacier topography. The mass-balance time series, therefore, represent the combined effects of climate variation and of evolving glacier geometry.
Reference Elsberg, Harrison, Echelmeyer and KrimmelElsberg and others (2001) developed a method for deriving the mass-balance series B n(t) related to a particular reference topography, and demonstrated it using the rich record from South Cascade Glacier. As a glacier retreats, two effects of opposite sign occur. (1) Primarily, loss of area at low altitude removes its negative contribution to the glacier-average balance. (2) Secondarily, lowering of the glacier surface elsewhere tends to make the balance there more negative because the vertical gradient db n /d z of point values b is positive.
Reference Elsberg, Harrison, Echelmeyer and KrimmelElsberg and others (2001) found that the cumulative B n(t) between 1970 and 1997, with respect to the 1970 topography, would have been 16% more negative than the cumulative published Bn(t). A linear variation in time, as suggested by Reference Elsberg, Harrison, Echelmeyer and KrimmelElsberg and others (2001, fig. 6), is fit to that 27 year difference and is extrapolated back to 1935 and forward to 2006:

Reference Elsberg, Harrison, Echelmeyer and KrimmelElsberg and others (2001) did not adjust the seasonal components. The seasonal components are adjusted here:

In the absence of independent information, the adjustment δB n is apportioned equally between the two seasonal components. Removing area at low altitude will, for instance, remove both the strongly negative summer balance and the weakly positive winter balance, making the glacier-average summer balance less negative and the glacier-average winter balance more positive. The 1970–97 cumulative of Bn(t) is –14.92 and of B n(t) is –17.31mw.e., which is 16% more negative. Extending the linear trend gives δB n(t) = +0.22mw.e. in 1935, +0.07mw.e. in 1959 and –0.23mw.e. in 2006.
This assumption of linearity underlying Equation (1) is supported by changes in the glacier’s geometry over the past few decades. Reference Harrison, Elsberg, Echelmeyer and KrimmelHarrison and others (2001) show that the change of cumulative balance relative to the initial state (1970) is nearly linear in change in area. The glacier area has decreased roughly linearly between 1928 and 2005 (Fig. 3) as has the glacier volume, according to Reference Josberger, Bidlake, March and KennedyJosberger and others (2007).
Decreasing glacier area with unweighted best-fitting straight line. Data from 15 sources.

A Simple Mass-Balance Model
A simple model that uses daily data is

in which summations are over the period mid-October to mid-May, and

in which summations are over the period mid-May to mid-October. Values of the four model parameters are determined by linear regression to minimize model errors. Winter and summer seasons are approximated this way because in most years the dates on which Bw and Bs were measured are not published. Values of T at the glacier are calculated at the mean equilibrium-line altitude (ELA) (∼2000 m) from the daily Diablo Dam temperature measurements and the mean monthly lapse rates (Fig. 4).
Mean 1993–2005 climatological conditions at 1848 m, adjacent to South Cascade Glacier: (a) mean daily maximum temperature T max (upper curve) and minimum temperature T min (lower curve) on days with Diablo Dam precipitation P > 1 mm (closed circles) and P ≤ 1 mm (open circles); and (b) vertical lapse rate of mean temperature between 1848 m and Diablo Dam (271m).

Daily precipitation P from the excellent record at Diablo Dam is used instead of the short, intermittent record at the glacier, where its measurement is unreliable. Rainfall, which constitutes most of the Diablo Dam P, can also be measured much more accurately than snowfall. Because the P term represents accumulation, values of P are included only when temperature at the glacier ≤1 ˚ C. Precipitation at higher temperature is classified as rain, which is assumed to run off immediately. Assuming +1 ˚ C at ∼2000m is consistent with using +2 ˚ C at ∼1650 m, as done by Reference Rasmussen and ConwayRasmussen and Conway (2003).
The T + term is the treatment of temperature used in PDD models. Equations (2) and (3) are similar to the model Reference De Woul and HockDe Woul and Hock (2005) devised to determine the sensitivity to climate change of 42 glaciers in the Arctic, and that Reference Radić and HockRadić and Hock (2006) used to model future mass balance of Storglaciären, Sweden. The difference is in the temporal partitioning; they calculated accumulation through the entire year by using only the first and third terms of Equation (3) and ablation by using only the second and third terms of Equation (4). It is easily calculated from

Results
The model is calibrated over 1959–2006 by finding the coefficients to minimize є n, the rms discrepancy between B∗ w + B∗ s and the topographically adjusted B n given by Equations (2), which are α = 1.58, β = −0.00448, Σ w = 1.00 and Σ s = 2.56. Because of some months of missing observations at Diablo Dam, a few years were omitted from the calibration: 1966, 1985 and 1997 for B w and 1965, 1987 and 1997 for B s. The β value is within the range of values Reference Braithwaite and ZhangBraithwaite and Zhang (2000) and Reference HockHock (2003) list from numerous studies.
Goodness-of-fit is expressed by the coefficients of determination in which σ is the standard deviation of the topographically adjusted balance component and є is the rms model error. By coincidence, є w = є n = є s = 0.40, with corresponding r 2 = 0.62, 0.83 and 0.60. Although є w and є s combine to 0.402 + 0.402 = 0.562, є n is much less because discrepancies B∗ w − B w and B∗ s − B s tend to counteract each other (r = −0.40).

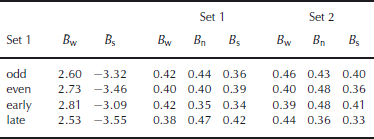
Results of four split-sample tests (Table 1) indicate the stability of the model. The model is calibrated on set 1 and tested on its complement, set 2. The two pairs of sets are odd–even and early–late, where the odd (even) set is the odd- (even-)numbered years. The early (late) set is years 1959–82 (1983–2006). By comparison, when the model is evaluated over the entire period 1959–2006, the rms for all three is 0.40. A comparison of results with previous work is given in Table 2.
Split-sample tests (rms in mw.e. a − 1)
Model comparison (mw.e. rms and % r 2) over the period 1959–t 1 (values in brackets were calculated using Equation (6); thevariable for the Diablo Dam model is B and for all other models, it is B)
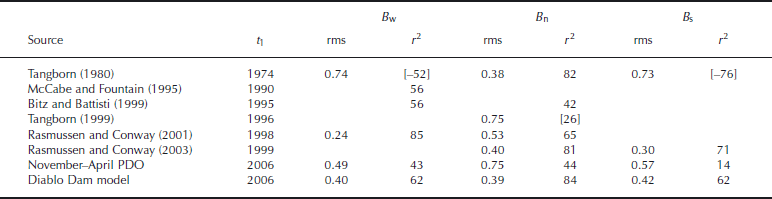
Figure 5 depicts the joint distribution of precipitation at Diablo Damand temperature measured at 1848m next to the glacier, during 1998–2005. It divides the distribution of mid-October to mid-May over which B w is modelled into three sub-periods. Appreciable rain fell at 1848m throughout the winter.
Joint distribution of precipitation P at Diablo Dam (mm) and temperature T at 1848m adjacent to South Cascade Glacier during balance years 1998–2005 for (a) autumn (mid-October to mid-December, 247 days, snow fraction 70%); (b) winter (mid-December to mid-March, 340 days, snow fraction 87%); and (c) spring (mid-March to mid-May, 197 days, snow fraction 75%). The rain–snow divide is indicated by the vertical line at T = +1 ˚ C.

Correlation with PDO
Extending the analysis of Reference Bitz and BattistiBitz and Battisti (1999) through 2006 with mean November–April PDO yields a correlation with Bw of rms 0.49mw.e. (r 2 =0.43) and with Bn of rms 0.75mw.e. (r 2 =0.44). When their regressions for Bn and Bw are subtracted, an rms of 0.57 mw.e. (r 2 =0.14) is obtained for Bs.
Reconstructed–observed Balance Series
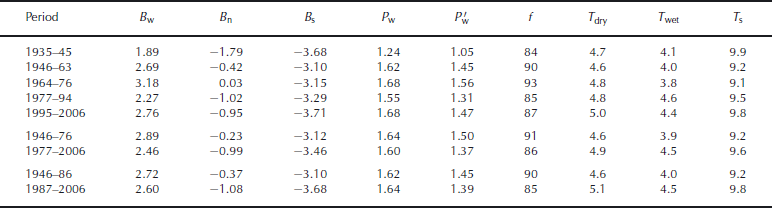
Combined series, 1970-topography-adjusted observations 1959–2006, reconstructed 1935–58, are shown in Figure 6. Mean values of pertinent climate variables are given in Table 3 for each of the periods in Figure 6. Mean winter temperatures on days of P = 0 are given by T dry. During mid-October to mid-May, temperatures T wet are weighted by P . Mean dry-day summer temperatures T s are for mid-May to mid-October.
Climate variation: the first five periods are the B w periods in Figure 6, the next two are the second and third B n periods and the final two are the second and third B s periods. The mean Diablo Dam precipitation over mid-October to mid-May is given by P w (m), falling to P′ w (m) when T ≤+1 ° C which is interpreted as snow (f (%) being the ratio).
Reconstructed and observed mass-balance components referring to 1970 glacier topography. For five of the seven shifts P(t) < 0.005; for 1963/64 for B w it is ∼0.05 and for 1994/95 for B w it is ∼0.02. See Table 3 for dates of stages.

Stages of the piecewise-constant function are determined empirically so that the probability P (t) (according to the Student’s t test) of the values in the two stages being samples from the same population is small. Six of the eight shifts in the best-fitting piecewise-constant functions are significant at the 99% level. The 1963/64 and 1994/95 shifts in B w are significant at 98%. Cumulative B n is shown in Figure 7.
Cumulative reconstructed–observed B n from 1935, adjusted to 1970 topography.

B values are observed except prior to 1959, and are adjusted smoothly in time (Equation (2)) to refer to the 1970 topography. Those mass-balance values and meteorological conditions at Diablo Dam are independent records and are not related through the model presented here. Over the calibration period, total winter precipitation averaged 1.65 m, of which 1.44 mfell as snow. Summer precipitation was 0.35 m, of which 0.03 m fell as snow.
Although seasonal averages of large-scale circulation patterns such as the PDO do not correlate well with glacier mass balance at an annual resolution (Reference Rasmussen and ConwayRasmussen and Conway, 2004), a good correlation is demonstrated over multi-year periods. There was a strong winter increase after 1976 in sea-surface temperatures (SST) in the northeast Pacific (Reference Hare and MantuaHare and Mantua, 2000). It coincided with warming and drying which combined to produce a strong decrease in winter balance B w. Not only did winter precipitation P w decrease by ∼9%, but the fraction f falling as snow decreased from 93% to 85%. The snow fraction is determined by applying the lapse rate (Fig. 4) to the Diablo Dam temperatures to estimate the temperature at the ELA.
After 1994, P w increased by 9% and f increased to 87%. Wet-day temperature T wet at Diablo Dam also decreased. Greater P w and lower T characterizing this period is in contrast to what happened in southern Norway. P w increased substantially in southern Norway during 1989–95; upper-air temperature increased by 0.3 ˚ C and f decreased from 0.91 to 0.90 (Reference Rasmussen and ConwayRasmussen and Conway, 2005).
Periods of strong summer balance B s before 1946 and after 1987 have high Diablo Dam summer temperature T s. Reference Hare and MantuaHare and Mantua (2000) also demonstrate an increase of summer SST after 1989. After 1945, B w became more positive and B s less negative, which combined to make B n much less negative. Winters became snowier, with both P w and f increasing, and summers became cooler, with T s decreasing.
The change in P w between the first two periods, 1935–45 and 1946–63, occurred over the entire region. Reference MoteMote (2003) shows that the regional average 1 April snow water equivalent increased ∼14%. At Forks near the Pacific Ocean (Fig. 1), which has a superb observational record, P w increased ∼15%. Temperature comparison with Forks, however, is not meaningful because of its cloudy marine environment.
Conclusions
Untangling the climate signal from archived mass-balance records is a daunting task. It was only the immense richness of the South Cascade Glacier archive that made it possible for Reference Elsberg, Harrison, Echelmeyer and KrimmelElsberg and others (2001) to perform their rigorous analysis. A more elementary solution is available for any glacier for which the spatial distribution b(x, y) or b(z) is known for several different years and the topography Z(x, y) or the area–altitude distribution is known at a chosen reference time. If these variables are known, no assumption need be made concerning meteorological conditions or their relation to mass balance.
Temperature lapse rates in Figure 4 were obtained over a large sample of 13 years. Their low values in winter demonstrate the unsuitability of using the typical free-atmosphere wet adiabatic rate 6.5 ˚ Ckm − 1 to derive temperatures at a glacier from weather stations at much lower altitudes. The joint distribution of temperature and precipitation (Fig. 5), of daily resolution, indicates the unsuitability of monthly mean temperatures in partitioning between rain and snow.
Acknowledgements
This work was supported by US National Science Foundation grant OPP-0240861. It is not possible to give enough credit to the US Geological Survey personnel who established and have continuously maintained for 50 years the supreme glacier program in the Western Hemisphere, including M. Meier, A. Post, W. Tangborn, R. Krimmel and W. Bidlake. Comments by H. Conway and W. Bidlake led to an improved paper. I am grateful to L. Koenig for drawing Figure 1.



