Introduction
Obesity is a complex disorder that is affected by many interacting genetic and non-genetic factors. The global emergence and increase in childhood obesity represents a serious public health problem that contributes to a higher prevalence of obesity-related chronic diseases in adult populations (Ong et al., Reference Ong, Ahmed, Emmett, Preece and Dunger2000; Ebbeling et al., Reference Ebbeling, Pawlak and Ludwig2002; Rolland-Cachera, Reference Rolland-Cachera2005; Han et al., Reference Han, Lawlor and Kimm2010, Herouvi et al., Reference Herouvi, Karanasios, Karayianni and Karavanaki2013; Giussani et al., Reference Giussani, Antolini, Brambilla, Pagani, Zuiccotti and Valsecchi2013). The problem of overweight and obesity in children and adolescents has been noted in different countries (Ells et al., Reference Ells, Hancock, Copley, Mead, Dinsdale and Kinra2015; Mladenova & Andreenko, Reference Mladenova and Andreenko2015; Ogden et al., Reference Ogden, Carroll, Lawman, Fryar, Kruszon-Moran, Kit and Flegal2016; Djordjic et al., Reference Djordjic, Radisavljevic, Milanovic, Bozic, Grbic, Jorga and Ostojic2016).
The city of Kraków in southern Poland has seen a considerable increase in the prevalence of obesity of school children over the last few decades (Bac et al., Reference Bac, Woźniacka, Matusik, Golec and Golec2012; Kryst et al., Reference Kryst, Kowal, Woronkowicz, Sobiecki and Cichocka2012; Kowal et al., Reference Kowal, Kryst, Woronkowicz and Sobiecki2014), although in the years 1983–2010 the incidence of overweight girls in Kraków decreased slightly, from 12.44% to 11.17% (Kowal et al., Reference Kowal, Kryst, Woronkowicz and Sobiecki2014). A similar trend has been observed in other countries (Peneau et al., Reference Peneau, Salanave, Maillard-Teyssier, Rolland-Cachera, Vergnaud and Mejean2009; Stamatakis et al., Reference Stamatakis, Wardle and Cole2010; Ogden et al., Reference Ogden, Carroll, Fryar and Flegal2015, Reference Ogden, Carroll, Lawman, Fryar, Kruszon-Moran, Kit and Flegal2016).
Body mass index (BMI) has limited applicability in measuring body fat in children and adolescents (Tomaszewski et al., Reference Tomaszewski, Żmijewski, Milde and Sienkiewicz-Dianzenza2015). However, it is still a convenient way of detecting overweight and obesity. In addition, the existing data on BMI measured in large population groups enable the comparison of results across countries. There is now good evidence that central obesity carries more health risks compared with total obesity, as assessed by BMI. The predictive power of BMI as a measure of adiposity is considered to be insufficient (Flegal & Ogden, Reference Flegal and Ogden2011; Javed et al., Reference Javed, Jumean, Murad, Okorodudu, Kumar and Somers2015). Waist circumference and waist-to-height ratio (WHtR), a proxy for central obesity, should be measured at the same time as BMI to better predict health risk (Brammbilla et al., Reference Brammbilla, Bedogni, Heo and Pietrobelli2013; Sahweel & Gibson, Reference Sahweel and Gibson2016).
In 2000, Cole et al. (Reference Cole, Bellizzi, Flegal and Dietz2000) published a set of smoothed, sex-specific BMI values based on six representative data sets. The International Obesity Task Force (IOTF) recommended cut-offs based on the age- and sex-specific values of BMI extrapolated to the adult values of 25 kg/m2 and 30 kg/m2 for defining overweight and obesity, respectively. At the same time in the United States, the Centers for Disease Control and Prevention (CDC) published growth charts (the CDC 2000) based on five National Health and Nutrition Examination Surveys (NHANES) conducted in the years 1960–1994 (www.cdc.gov/nccdphp/dnpao/growthcharts/resources/sas.htm).
Many countries have created databases based on national surveys, e.g. Germany (Kalies et al., Reference Kalies, Lenz and von Kiers2002), United Kingdom (Cole et al., Reference Cole, Freemann and Preece1995), Spain (Martinez-Costa et al., Reference Martínez-Costa, Núñez, Montal and Brines2014), France (Kêkê et al., Reference Kêkê, Samouda, Jacobs, di Pompeo, Lemdani and Hubert2015), Romania (Chirita-Emandi et al., Reference Chirita-Emandi, Barbu, Cinteza, Chesaru, Gafencu and Mocanu2016), Greece (Christoforidis et al., Reference Christoforidis, Dimitriadou, Papadopolou, Stilpnopoulou, Katzos and Athanassiou-Metaxa2011) and others. Data from a large and representative group of Polish children and school-aged youth (6–19 years) were published in 2011 and collected under the OLAF Study (Kułaga et al., Reference Kułaga, Litwin, Tkaczyk, Palczewska, Zajączkowska and Zwolińska2011) – a cross-sectional study on height, weight and BMI of school-aged children in Poland using data from a current sample of Polish children aged 6–19 years (n=17,573). Field examinations were conducted in 416 schools in all regions of Poland between November 2007 and November 2009.
The very definition of overweight and obesity is a problem, as each country uses different percentile-based definitions (Flegal & Ogden, Reference Flegal and Ogden2011). In 2007 the definitions of overweight and obesity were changed in the US and the rest of the world. Overweight was then defined as a BMI between the 85th and 95th percentiles, while obesity was over the 95th percentile (Ogden & Flegal, Reference Ogden and Flegal2010). For greater comparability of results from different countries, using the same definition allows the evaluation of the problem in different populations throughout the world. Accordingly, this study used the definitions proposed in 2007.
The overall aim of this study was to assess differences in the prevalence of overweight and obesity in children and adolescents from Kraków (the second largest city in Poland), in relation to various references. It was evident there were differences in these prevalences that depended directly on the method used (O’Neill et al., Reference O’Neill, McCarthy, Burke, Hannon, Klely and Flynn2007), and therefore it was decided to carry out additional analysis to explore this issue further. The present study assessed the efficiency of three standards – the IOTF reference, CDC reference and national Polish 2010 standard – each using different cut-offs in defining overweight and obesity in children aged 5–14 years. Finally, the study aimed to assess the usefulness of the national database as a reference, compared to the results available in the international literature.
Methods
Study sample
The heights and weights of children in randomly selected primary schools and high schools in Kraków, Poland, were measured from November 2009 to March 2010. In order to provide a representative sample, the selection of units for testing (schools and classrooms) was determined at random, taking into account available information sources about the study population. Analysis of the age pyramid of the population of Kraków determined the proportion between the number of boys and girls, and the percentages of each age group in relation to the whole sample. All types of schools were taken into account (kindergarten, primary school, secondary school, basic vocational school, technical school, high school), as well as their location in the city. Considering all the above, the target sample size was established in the age groups, along with the number of allocated research institutions and the number of classrooms in a facility in every district. All analysed schools and kindergartens were chosen by two-stage lottery, using the ‘urn randomization method’.
Anthropometric measurements
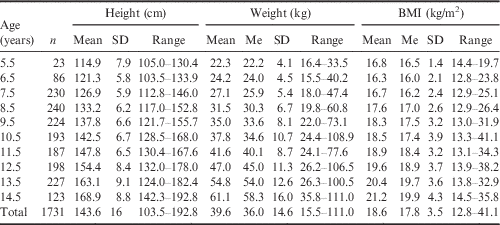
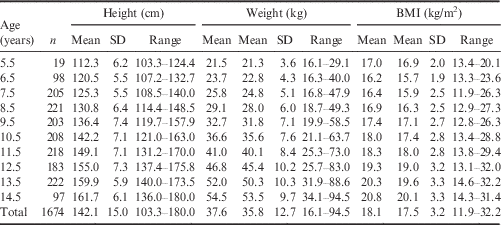
All measurements were performed in the morning by the authors (RW, AB, MK). The study sample comprised 3405 children aged 5–14 years, including 1674 girls (49.2%) and 1731 boys (50.8%). The distribution of children by sex and age group (means, medians, standard deviations and ranges for height, weight and BMI) is presented in Tables 1 and 2. The anthropometric measurements were made according to the procedures in force, i.e. with the consent of the Bioethics Committee at the Regional Medical Association in Kraków (No. 26/KBL/OIL/2007) and with the consent of the children’s parents or legal guardians. The children were examined in light clothes without shoes. Body height was measured with an anthropometer to the precision of 0.1 cm. Body weight was measured using a TANITA scale model TBF-300A to the precision of 0.1 kg. All measurements were performed in the morning by the study authors (RW, AB, MK).
Heights, weights and BMIs of boys by age group, Kraków, Poland, 2009–2010

Heights, weights and BMIs of girls by age group, Kraków, Poland, 2009–2010

Analysis
To assess the prevalence of overweight and obesity, BMI was calculated for each child (kg/m2), and children were placed in overweight and obesity groups. The children were put into age groups based on the method whereby a 5.5 year old group included all children aged 5.0–5.99 on the day of the survey. The children’s BMI was calculated and classified as normal, overweight or obese according to the International Obesity Task Force (IOTF) (Cole et al., Reference Cole, Bellizzi, Flegal and Dietz2000) and Centers for Disease Control and Prevention (CDC 2000) BMI cut-offs. To assess the number of overweight and obese children, national data references (Polish 2010) were used, as presented by Kułaga et al. (Reference Kułaga, Litwin, Tkaczyk, Palczewska, Zajączkowska and Zwolińska2011). Percentile curves for height, weight and BMI were created separately for each sex using the Lambda-Mu-Sigma (LMS) method. The LMS method summarizes the measurement distributions with three age- and sex-specific parameters, namely: the Median (M), the coefficient of variation (S) and the skewness of the distribution (L). This method was used to take the asymmetry of the distribution into account (Scherdel et al., Reference Scherdel, Botton, Rolland-Cachera, Leger, Pele and Ancel2015). In the case of BMI, in addition to the traditional set of percentiles (3rd, 10th, 25th, 50th, 75th, 90th, 97th), the 85th and 95th percentiles were included because these are the recommended BMI cut-offs identifying children and adolescents for overweight and obese, respectively (Ogden & Flegal, Reference Ogden and Flegal2010). In 2013, Kułaga et al. (Reference Kułaga, Grajda, Gurzkowska, Góźdź, Wojtyło and Świąder2013) published data for children of preschool age. The study did not provide values for the 85th and 95th percentiles. For this reason, in the present analysis, national data for children aged 5.5 and 6.5 were not use (see Tables 3 and 4).
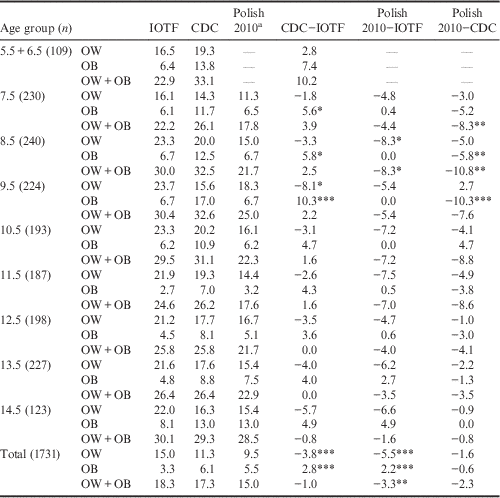
Prevalence (%) of overweight and obesity in boys by age group using three different reference datasets

OW, overweight; OB, obesity.
a Due to the lack of 85th and 95th percentile values for preschool children, the prevalence of overweight and obesity is not presented for those age groups.
*p<0.05; **p<0.01; ***p<0.001.
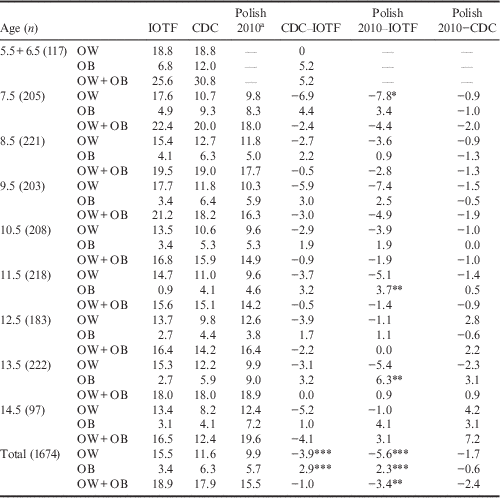
Prevalence (%) of overweight and obesity for girls by age group using three different references datasets

a Due to the lack of 85th and 95th percentile values for preschool children, the prevalence of overweight and obesity is not presented for those age groups.
*p<0.05; **p<0.01; ***p<0.001.
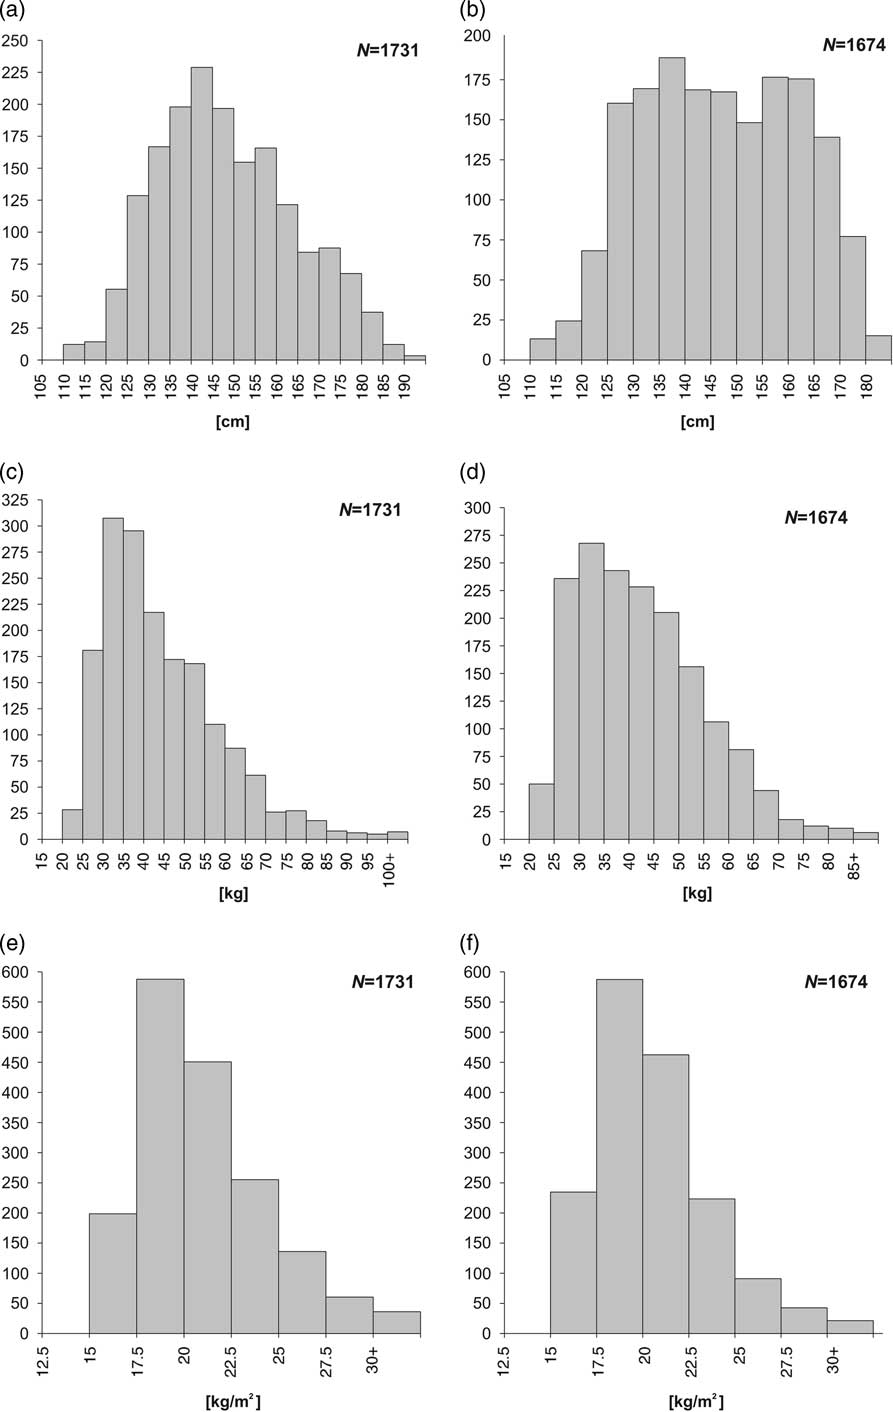
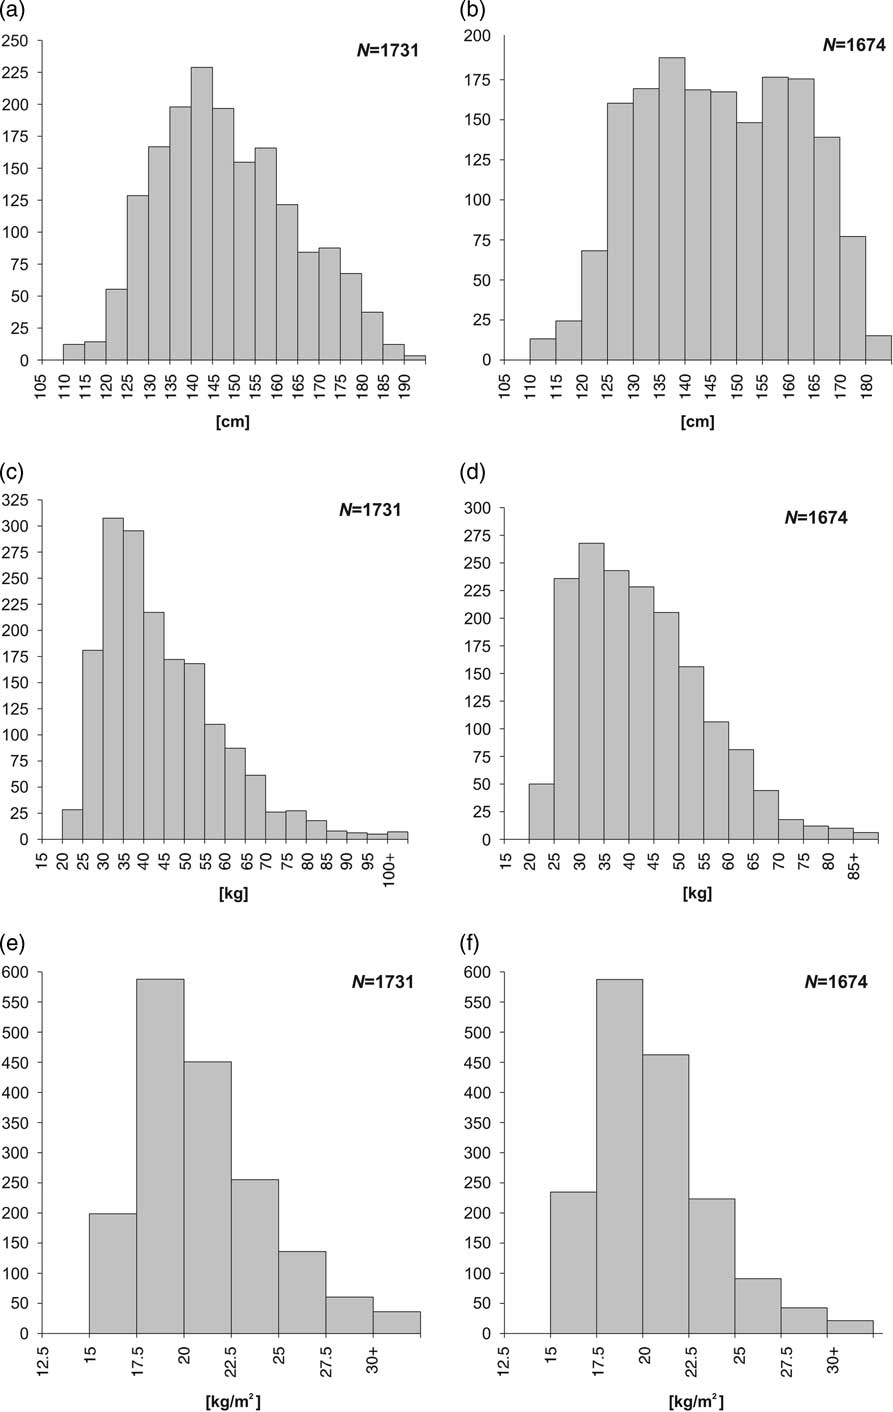
Before applying statistical tests, the normality of distribution was tested separately for each characteristic and sex using Kolmogorov–Smirnov and Shapiro–Wilk tests. While boys’ body height had a normal distribution, their BMIs and body weights had positively skewed distributions, so for these variables basic statistical parameters (means, standard deviations and ranges) were determined, and in addition medians for weight and BMI (see Fig. 1).
Histograms of abundance: body height: a) boys and b) girls; body weight: c) boys and d), girls; BMI: e) boys and f) girls.
In order to assess the statistical significance of the differences in the proportions of overweight or obesity between the three applied reference datasets, a comparison of two proportions was performed using the z-test for large sample sizes, which was possible thanks to a large number of observations in different years. This test is asymptotically converged to a normal distribution. The concordance of classification methods was assessed using Cohen’s kappa coefficient (Cohen, Reference Cohen1960). Coefficient values close to 1 indicate high compliance ratings, and those close to 0 the lack of conformity (random distribution of ratings). Kappa coefficient values greater than 0.8 may be regarded as indicative of near-perfect conformity, or ‘almost perfect agreement’. Values from 0.6 to 0.8 indicate a significant compliance or ‘substantial agreement’ and values from 0.4 to 0.6 indicate average compliance or ‘moderate agreement’ (Landis & Koch, Reference Landis and Koch1977). Statistical analysis was performed using STATISTICA 10 software.
Results
Tables 3 and 4 show the prevalence of overweight and obesity for boys and girls respectively in the study sample by age group using the three different evaluation criteria. Differences in the prevalence of overweight in both the total group of boys and girls were statistically significantly higher (p<0.001) using the IOTF cut-offs than using the Polish 2010 and CDC cut-offs, and were statistically lower for obesity. Within the age groups only a few results were statistically significantly different.
The lack of statistically significant differences when overweight and obese girls were treated as a single group showed that the number of girls with BMI at or above the 85th percentile was similar, i.e. the cut-off points were similar for IOTF and CDC. The differences appeared in the 95th percentile, with a nearly two times higher percentage of obese girls as estimated by the CDC in relation to the IOTF (6.1% and 3.3%, respectively). Among the girls, the highest prevalence of overweight was observed using the IOTF reference, and the lowest when Polish 2010 data were used (except for the 12.5- and 14.5-years-old groups). In the case of obesity, the highest values were observed in the youngest groups (5.5–9.5 and 12.5 years) using CDC and in the other age groups using Polish 2010.
The prevalence of overweight in Polish children from Kraków differed significantly accordingly to the reference used. The IOTF or CDC reference data resulted in a high prevalence of overweight for boys and girls, while the more recent Polish 2010 reference data indicated lower rates. The prevalence of obesity in Polish children was lowest when using the IOTF reference, both in boys and girls, and highest when using the CDC reference.
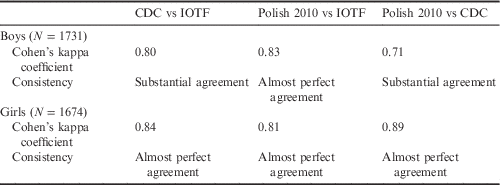
Agreement between the three references used in the study was tested using Cohen’s kappa coefficient (Table 5). The high values of Cohen’s kappa coefficient, ranging from 0.71 to 0.89, suggest a strong degree of compliance between the various classification methods. In the girls, the compatibility between methods was higher than in boys. The weakest level of compliance was observed between the Polish 2010 and CDC among boys.
Compliance of the classification of participants using various BMI criteria

Discussion
The problem of overweight and obesity in children and adolescents has been noted by many authors. There has been a record increase in the prevalence of overweight and obesity among children and adolescents in many regions of the world over the last decade (Rosati et al., Reference Rosati, Triunfo, Zucchetti, Gorca, Chini and Campana2014; Ells et al., Reference Ells, Hancock, Copley, Mead, Dinsdale and Kinra2015; Mladenova & Andreenko, Reference Mladenova and Andreenko2015; Djordjic et al., Reference Djordjic, Radisavljevic, Milanovic, Bozic, Grbic, Jorga and Ostojic2016).
The present study in Polish school children found that the prevalence of overweight and obesity varied depending on the method of evaluation. Using BMI cut-offs from a national (Polish) database resulted in a lower percentage of overweight children for both sexes when compared with both the CDC and IOTF cut-offs, respectively: 9.5% vs 11.3% vs 15% for boys and 9.9% vs 11.6% vs 15.5% for girls. The highest percentage of obesity for both sexes was observed using the CDC cut-offs (6.1% boys, 6.3% girls) and the lowest using the IOTF (3.3% and 3.4%, respectively), while the percentage of obese children calculated on the basis of Polish national data was 5.5% for boys and 5.7% for girls.
Similar results were obtained by Zimmermann et al. (Reference Zimmermann, Gubeli, Puntener and Molinari2004) for Swiss children aged 6–12 years. Differences in the prevalence of overweight were relatively low for boys and amounted to 16.6% (IOTF) and 20.3% (CDC) and 19.1% for girls (both BMI cut-offs). At the same time, the percentage of obese children was nearly twice as high using the CDC than the IOTF cut-offs; 7.36% vs 3.85% for boys, and 5.31% vs. 3.72% for girls. The same trend was observed in 6- to 7-year-old Chilean children (Kain et al., Reference Kain, Uauy, Vio and Albala2002). The percentage of overweight children was similar, regardless of the adopted method and sex, and the percentage of obese children was twice as high when estimated with the CDC than the IOTF cut-offs for both sexes. The results of a study on Irish school children aged 8–12 (comparing IOTF, CDC and UK90 cut-offs) also confirmed the finding of the present paper (O’Neill et al., Reference O’Neill, McCarthy, Burke, Hannon, Klely and Flynn2007). Given these relationships, and the fact that the percentage of overweight and obese children evaluated using Polish 2010 cut-offs fell between CDC and IOTF results, it seemed appropriate to use the Polish 2010 cut-offs as reference. At the same time, it also seems adequate to present estimates based on international BMI cut-offs when comparing Polish results with those from different countries.
Wang and Wang (Reference Wang and Wang2002) compared the prevalence of overweight and obesity for three different populations in China, Russia and the United States for two age groups: 10–18 and 6–9 years. They used the IOTF and WHO cut-offs for the 10–18 age group, and the CDC for 6- to 9-year-olds. They obtained high agreement of results for each method in all three populations when assessing overweight. This was shown by the Kappa coefficient ranging from 0.88 to 0.98, with values above 0.8 indicating an excellent agreement of results. Obesity was assessed only for Russia and the United States due to the very low percentage of obesity in China. In the present study, the results obtained using the IOTF and CDC cut-offs were compared. Agreement of results was not as high as in the case of overweight. For children aged 6–9, the Kappa coefficient was 0.77 for boys and 0.73 for girls. In the age group 10–18 all values indicated a high agreement of results. When comparing the prevalence of obesity in 6- to 9-year-old children estimated by IOTF and WHO for the United States, the Kappa coefficient was 0.8 regardless of sex; for the Russian population it was only 0.58 for boys and 0.74 for girls and 0.65 for the entire group (n=1678). This indicates a poor agreement of obesity results in this age group. In this study, Cohen’s kappa coefficient values ranged from 0.71 for boys to 0.89 for girls when comparing the Polish 2010 with the CDC reference.
Shields and Tremblay (Reference Shields and Tremblay2010) showed that the prevalences estimated for the OITF (26%) and CDC (28%) cut-off points for the combined overweight and obesity category in children and adolescents aged 2–17 years were similar. The estimates of the prevalence of obesity were higher when based on the CDC (13%) compared with the IOTF cut-offs (8%). In a study of Romanian children aged 6–19 years, the prevalence of overweight (including obesity) was 23% when based on IOTF cut-offs and 23.2% when based on CDC cut-offs (Chirita-Emandi et al., Reference Chirita-Emandi, Barbu, Cinteza, Chesaru, Gafencu and Mocanu2016). Nilsen et al. (Reference Nilsen, Yngve, Sjöberg, Moraeus, Lissner and Werner2016) showed that, depending on which growth reference was used (IOTF, WHO or national database), the prevalence of overweight (including obesity) varied from 16.5% to 25.7% for boys and from 18.2% to 25.2% for girls. They observed that there were significant gender differences depending on the growth reference they used. Mighelli et al. (Reference Mighelli, Nunes and Oliveira2014) observed, in a group of 966 children aged 10–16 years, whose weight status was verified according to CDC, IOTF and WHO criteria, that the highest level of agreement for overweight and obesity classification was obtained with the IOTF and CDC criteria.
In this paper, agreement of results was evaluated by the comparison of two proportions. The highest agreement was observed for the CDC and national database (Polish 2010) for both sexes. These differences were not statistically significant. The greatest differences were found between the IOTF and Polish 2010 results, at p<0.001 for overweight and obesity, and p<0.05 for overweight included obesity. Comparing CDC and IOTF separately for overweight and obesity, the differences were statistically significant at p<0.001, but after combining overweight and obesity the difference was no longer statistically significant. This resulted from the fact that, for children aged 6–12 years, the IOTF BMI cut-offs are generally higher than those of the CDC. For boys, the difference between the CDC and IOTF was about 0.5 units for overweight and 1.5–2 units for obesity. In girls, the values for overweight were similar, but for obesity it was approximately 1 unit higher in IOTF (Zimmermann et al., Reference Zimmermann, Gubeli, Puntener and Molinari2004). These differences explain an almost two times higher prevalence of obesity identified by the CDC in both sexes.
The prevalence of overweight and obesity as defined using the Polish 2010 standard was much lower than that estimated by Chrzanowska et al. (Reference Chrzanowska, Gołąb, Żarów, Sobiecki and Brudecki2002). In boys, the difference was about 7 percentage points and in girls it was about 2 percentage points (Kowal et al., Reference Kowal, Kryst, Sobiecki and Woronkowicz2013, Reference Kowal, Kryst, Woronkowicz and Sobiecki2014). The prevalence of overweight and obesity calculated using IOTF data, compared with the prevalence in the population of children from Kraków (Chrzanowska et al., Reference Chrzanowska, Gołąb, Żarów, Sobiecki and Brudecki2002), determined using the same criteria, was lower for the boys by about 5 percentage points and higher for the girls by about 1 percentage point (22.87% and 17.34%, respectively).
Overweight determined using the Polish 2010 cut-offs was lower than when using the CDC and IOTF cut-offs, and for obesity it was between CDC and IOTF but closer to the CDC. Thus, for both sexes, the sum of overweight and obesity incidence was lower for the Polish 2010 cut-offs than for the other BMI cut-offs specified. This trend is most distinct for boys aged 9.5–11.5.
As clearly shown in Tables 3–4, the three procedures tended to overestimate or underestimate the prevalence of overweight and obesity by sex and age groups when used on the same population. This may be interpreted as a consequence of using higher and lower cut-offs or may also depend on some other issues. Chinn and Rona (Reference Chinn and Rona2002) showed how IOTF curves for girls tend to overestimate overweight and obesity as a result of a problem with the backward tracking of the BMI centiles from 18 years of age. The differences in prevalence of overweight and obesity between different methods may be due to the methods of data collection and/or secular trends (Flechtner-Mors et al., Reference Flechtner-Mors, Schwab, Frohlich-Reiterer, Kapellen, Meissner and Rosenbauer2015).
This result showed that the differences in the classification of overweight and obesity between the presented BMI cut-offs (IOTF, CDC, Polish 2010) were not high: from 0.6% to 5.5% for boys and from 0.6% to 5.6% for girls. The overall results of the study also suggest a strong degree of compliance between the applied classification methods (Table 5), as confirmed by the high Cohen’s kappa coefficient, ranging from 0.71 to 0.89. However, these differences, especially between CDC and IOTF and between Polish 2010 and IOTF, were statistically significant. This fact should be taken into account when different criteria are used in assessing the prevalence of overweight and obesity in children and adolescents.
In the case of populations of children from Kraków, the use of national data appears to be the most appropriate. However, the distribution of height, weight and BMI for school children in Poland have been found to differ from international data in the IOTF cut-offs (Kułaga et al., Reference Kułaga, Litwin, Tkaczyk, Różdżyńska, Barwicka and Grajda2010). These differences should be taken into account when comparing data from different countries, and it seems to be better to rely on international standards. A similar problem is also relevant to the comparison of populations from different regions: Kułaga et al. (Reference Kułaga, Litwin, Tkaczyk, Różdżyńska, Barwicka and Grajda2010) clearly pointed to the fact that there exist certain limitations to the analysis of height, weight and BMI z-scores when Polish regional references are used. They indicated the need for the creation of a national reference database updated every 10 years.
There is a longstanding debate in the literature about the use of an international approach rather than national-based classification of overweight and obesity. Some point to the weakness of the national references consisting of a small sample size, restricted to certain age ranges or based on cross-sectional studies (Flechtner-Mors et al., Reference Flechtner-Mors, Schwab, Frohlich-Reiterer, Kapellen, Meissner and Rosenbauer2015). Flegal et al. (Reference Flegal, Ogden, Wei, Kuczmarski and Johnson2001) observed that when IOTF and CDC methods were used to assess US children and adolescents aged 2–19 years, the IOTF reference produced a lower prevalence of overweight than the CDC reference. Importantly, Reilly (Reference Reilly2002), in his systematic review, suggested that defining paediatric obesity using national BMI reference data was widely recommended for clinical practice, when IOTF and CDC reference data were preferred for clinical and epidemiological applications.
Previous studies conducted in Kraków seem to confirm the relevance of regional standards, as data on body weights, heights and BMIs of boys and girls in the Kraków population differ from those gathered internationally. Instead, they are similar to the data obtained in this research. It is worth noting that the choice of method does not matter in assessing the trends of overweight and obesity changes. Studies based on different criteria has always shown an increasing trend (Ogden et al., Reference Ogden, Carroll, Curtis, McDowell, Tabak and Flegal2006; Chrzanowska et al., Reference Chrzanowska, Kozieł and Ulijaszek2007). This is a substantial piece of information indicating that the problem of excessive weight gain is real, even if the percentages show some discrepancies.
The strength of this study was its large sample size and information on sex and age, which allowed the evaluation of differences by age and sex groups. However, no information was available on the socioeconomic characteristics of children. The absence of detailed information on family economic status, living environment, dietary patterns and physical activity at the individual level was a limitation of this study.
In conclusion, creating and updating of national databases based on large, representative groups is justified and provides better reference for regional data than international data (when trying to establish a situation in a country). However, in order to ensure the comparability of results with those from other countries, it seems advisable to use cut-offs based on international data. The Polish 2010 national reference proposed by Kułaga et al. (Reference Kułaga, Litwin, Tkaczyk, Różdżyńska, Barwicka and Grajda2010) can be recommended as a national BMI reference for screening and monitoring growth in children and adolescents in Poland. From the close agreement between methods, the IOTF and CDC references can be used for international comparisons.