Implications
The experiment supplies data to calculate metabolisable energy (ME) values of diets for broilers, from chemical analyses of diets. This can help feed manufacturers to improve the evaluation of diet quality, especially because most previous data regarding ME value of poultry diets have been established in the past with adult cockerels, not with broilers, whereas pronounced differences are sometimes observed in ME values between adult cockerels and broilers. Data are also shown regarding relationships between chemical composition of diets and water excretion, which is important for the quality of housing systems and welfare.
Introduction
Energy value of broiler diets constitutes a major part of their nutritional properties and their cost. The expression of energy value that is used in poultry nutrition is the ME, as in birds, faeces and urinary secretions are voided together through cloaca. In most cases, ME is expressed as apparent ME corrected to zero nitrogen retention (AMEn). The interest in using the correction to zero nitrogen retention is to obtain ME values that are more stable and additive, by removing variations coming from body protein accretion (Hill and Anderson, Reference Hill and Anderson1958). ‘Apparent’ means that there is no correction for endogenous losses. A correction for endogenous losses does not show any interest when a correction to zero nitrogen retention is applied, because in such a condition, the value of endogenous losses becomes very low and negligible, especially in ad libitum feeding condition (Bourdillon et al., Reference Bourdillon, Carré, Conan, Duperray, Huyghebaert, Leclercq, Lessire, McNab and Wiseman1990a).
The expression of energy value as net energy (NE) is mainly used in ruminant nutrition, and also in pig nutrition, whereas in poultry NE expression is practically never used, probably because attempts to prove a better efficiency of the NE system compared with ME often fail in poultry (Pirgozliev and Rose, Reference Pirgozliev and Rose1999).
In poultry, AMEn values vary in the same way as would digestible energy (DE) values vary, because in the derivation of poultry AMEn values, metabolic losses are either negligible (intestinal gas production) or a constant relative to a nutrient (uric acid losses relative to digestible protein). Therefore, the question of an NE system instead of AMEn in poultry is equivalent to the question of replacing a DE system by ME or NE systems in ruminant or pig nutrition. In ruminants or pigs, the interest in using NE or ME instead of DE comes from the fact that the ME/DE or NE/DE ratios are affected by the extent of fibre digestion (Jarrige, Reference Jarrige1980; Noblet and Perez, Reference Noblet and Perez1993). In poultry, the extent of fibre digestion is very low (Carré et al., Reference Carré, Derouet and Leclercq1990), which would explain why the interest in using an NE system in poultry seems to be low. However, in poultry, the ME system was much more studied than NE, with numerous studies devoted to ME determination techniques and interests.
The aim of the current studies was to provide reliable data allowing both AMEn and NE values of diets to be predicted and evaluated, using 28 different diets given to broilers. With AMEn and NE values being measured in similar conditions, it was possible to compare the efficiency of ME and NE systems. The results reported here constitute the first part of these studies. This first part was only devoted to AMEn determinations.
Owing to the difficulty and cost for the in vivo measurement of NE, NE evaluation in practice can only be done using predicting equations based on either crude or digestible dietary components. Therefore, the main approach of our studies consisted in the in vivo measurements of digestibilities, AMEn and NE values, and in the prediction of these values by regression calculations based on crude or digestible components. Thereafter, calculated energy values (AMEn v. EN) can be compared for the efficiency to predict bird performances.
In vivo measurements of energy values were performed in conditions rather close to usual rearing practice. The birds were fed ad libitum with various pelleted diets formulated to obtain independent variations of energy values and amino acid contents.
In addition to the interest in providing data for NE predictions, the results of this first part are also interesting on their own, as very few experiments based on a great number of diets have been conducted in the past to predict AMEn values in broilers (Sibbald et al., Reference Sibbald, Czarnocki, Slinger and Ashton1963). In fact, most of these experiments predicting AMEn values were carried out with adult cockerels (Clunies et al., Reference Clunies, Leeson and Summers1984; Fisher and McNab, Reference Fisher and McNab1987). Application of these predicting equations to broilers remains questionable, as AMEn values were often observed to be higher in adult cockerels than in broilers (Bourdillon et al., Reference Bourdillon, Carré, Conan, Francesch, Fuentes, Huyghebaert, Janssen, Leclercq, Lessire, McNab, Rigoni and Wiseman1990b). Therefore, the AMEn predictions were also developed in the current study to supply more precise information, especially adapted to broiler feeding.
In addition, this experiment was an opportunity to examine the relationships between water excretion and diet composition. Water excretion is an important factor affecting litter humidity in broiler housing systems. Excess humidity in litter, in many respects, is considered a negative factor in broiler production systems. Thus, diet formulation could be used to reduce litter humidity (Francesch and Brufau, Reference Francesch and Brufau2004). Owing to the great number of diets tested in the current experiment, this experiment was unique for examining the effect of diets on water excretion.
Material and methods
Bird management
The experiment, conducted in 1996, was divided into three trials with a 4-week interval. Trials only differed by the diets distributed from 21 days. In each trial, a total of 400 male broiler chicks (IJV 915, ISA) were reared on litter floor in an environmentally controlled housing system from 0 to 21 days of age, with ad libitum feeding and access to water, using a standard starter diet (48.5% maize and 12.6% wheat). For each trial, at 21 days of age, 20 groups of eight birds and a group of 20 birds were constituted to obtain homogeneous groups with similar mean body weights (680 g). The group of 20 birds was killed by neck dislocation for carcass analyses. Among the 20 groups, 10 were used for measurements of AMEn and digestibilities, with each group being randomly allocated to a specific experimental diet. The other 10 groups received the same diets for measurements of growth and depositions of protein and fat from 21 to 35 days. Each bird was placed at random in individual metal cages (44 cm length, 33 cm width, 50 cm height) supplied with individual feeder and drinker, in an environmentally controlled room. The lighting cycle was 24 h/day from days 0 to 4, and then, 23 h/day with 1 h dark at 0000 h. Temperature was set at 34°C at day 0 and gradually decreased to 22°C at day 21, set at 24°C at the entrance in individual cages at day 21, then decreased to 21°C at day 25 and maintained at this temperature until day 35.
Digestive balance experiment
For the birds assigned to AMEn and digestibility measurements, a digestive balance experiment was conducted from day 27 to day 31 using the total collection method described by Bourdillon et al. (Reference Bourdillon, Carré, Conan, Duperray, Huyghebaert, Leclercq, Lessire, McNab and Wiseman1990a), modified for the feeding period (55 instead of 79 h). Total excreta were collected daily and immediately frozen. Dry matter of feed was measured at the beginning and end of the feeding period to measure the feed intake on a dry matter basis. Excreta were weighed, freeze-dried, equilibrated for 3 days at ambient temperature and weighed again. Water of excreta was measured as the difference between these two weights, added to the water remaining (90 g/kg) in equilibrated freeze-dried excreta. Freeze-dried excreta of birds from the same diet were pooled for chemical analyses and gross energy (GE) determination.
Diets
Thirty different experimental diets (Supplementary Tables S1ab) were formulated to obtain independent variations of proteins, lipids, starch, available sugars (sucrose and glucose) and fermentable sugars (α-galactosides and lactose). Calculated AMEn values (MJ/kg, as fed basis, adult cockerels) ranged from 10.48 to 13.76. Crude protein (as fed basis) varied from 16.0% to 26.5%. These diets were obtained by varying the mixture of 16 different feedstuffs. Diets differed between trials, except diets 11.1, 11.2 and 11.3 used in trials 1, 2 or 3, respectively. Diets were attributed to trials in such a way that similar mean diet compositions were obtained for each trial. Except for diet 26, amino acids were formulated on the basis of ratios to proteins, not to ME, with a minimum amino acid to crude protein ratio being reached for each diet either for lysine (around 0.0470) or sulphur amino acids (around 0.0355). Diet 26, a low-protein diet formulated as diet 6, was supplemented with pure amino acids on the basis of ratios to ME. Diets 4 and 5 only differed by nature of sugars, the major sugars being either sucrose for diet 4 or lactose for diet 5. Calcium and available phosphorus were maintained at minima of 9.9 and 3.9 g/kg, respectively. Supplementations of trace minerals and vitamins were the same for all diets.
Coccidiostats introduced in diets were robenidine from day 0 to day 21, and salinomycin from day 21 to day 35. All diets were distributed as pellets.
Analyses
For diets (Supplementary Tables S2ab), the contents of GE (isoperibol calorimeter, IKA-Kalorimeter C 700, IKA-Analysentechnik Heitersheim D-79423), nitrogen (Kjeldahl method), lipids A (no acidic treatment previous to petroleum ether extraction), lipids B (with an acidic treatment previous to petroleum ether extraction), starch P (polarimetric method), total reducing sugars after acid hydrolysis, crude fibre, ash (AFNOR, 1985), NDF (Van Soest et al., Reference Vansoest, Robertson and Lewis1991) and water-insoluble cell-wall (WICW, Carré and Brillouet, Reference Carré and Brillouet1989) were determined by two, three or four laboratories. In addition, for diets, one laboratory determined in triplicate the contents of starch E (enzymatic method) (Carré et al., Reference Carré, Beaufils and Melcion1991), sucrose, glucose, lactose (enzymatic test kits from Boehringer Mannheim, 1980), α-galactosides [GLC analysis (12 m BP1 capillary column from SGE (Ringwood, Victoria 3134, Australia), 290°C to 320°C temperature programme) of trimethylsilyl derivatives of oligosaccharides (Sosulski et al., Reference Sosulski, Elkowicz and Reichert1982) extracted in hot 50 : 50 methanol:water, with melezitose as standard], real applied viscosity (RAV), potential applied viscosity (PAV, with a preliminary ethanolic treatment) and water retention capacity of cell walls (Carré et al., Reference Carré, Gomez, Melcion and Giboulot1994; Carré, Reference Carré2002). For pooled freeze-dried excreta, contents of GE, total nitrogen, lipids B, starch E, α-galactosides, lactose (see above the methods used for diets) and protein nitrogen (Terpstra and De Hart, Reference Terpstra and De Hart1974) were measured by one laboratory.
Calculations
Calculated compositions of diets obtained from ingredient compositions (Supplementary Tables S1ab) were based on INRA feedstuff composition tables (INRA, 1984; Larbier and Leclercq, Reference Larbier and Leclercq1992), with AMEn values being those assigned to adult cockerels. In vivo AMEn values were calculated as described by Hill and Anderson (Reference Hill and Anderson1958). In vivo AMEn and digestibility values assigned to individual birds were calculated by using individual amounts of excreta and feed intake, and analyses of pooled freeze-dried excreta from the corresponding diet. Then, mean in vivo AMEn and digestibility values for a diet were calculated from these individual values.
As the simple regression relating water excretion to feed intake showed a significant intercept, the [excreted water]/[feed intake] ratio depended on feed intake level. Therefore, the residual values from this regression were calculated to obtain a value of excreted water that was completely independent from feed intake.
Cell-wall-retained water was calculated by multiplying WICW content by the water retention capacity of the cell wall.
Non-cell-wall carbohydrate content (NCC) was calculated as follows:
 $$\displaylines{ {\rm{NCC}}\,{\rm{(g/kg)}} = & {\rm{1000}} - {\rm{N}}\times {\rm{6}}{\rm{.25}}\,{\rm{(g/kg) - Lipids}}\,{\rm{B}}\,{\rm{(g/kg)}} \cr & - {\rm{WICW}}\,{\rm{(g/kg)}} - {\rm{Ash}}\,{\rm{(g/kg)}} $$
For the calculation of content of digestible starch P, the digestibility coefficient observed for starch E was applied. For the content of digestible total-reducing sugars, the calculation was done using the digestibility coefficients of fermentable sugars and attributing a value of 100% to the digestibility coefficient of sucrose and glucose. For the content of digestible non-cell-wall carbohydrates, the calculation used the digestibility coefficients observed for starch E and fermentable sugars, and a value of 100% for the digestibility coefficient of sucrose and glucose.
Theoretical equations for AMEn calculation were either direct or indirect. Theoretical direct equations were only based on available nutrients (all components, except WICW-related components and ash) and were under the form:
 $$[{\rm{Thd}}]{\rm{:AMEn = }}\sum {{a}_i}{{x}_i}{\rm{ - }}u\,{\rm{m}}{{{\rm{d}}}_{{\rm{CP}}}}\,{\rm{CP}}$$
where ai is the [(nutrienti gross energy) × (nutrienti mean digestibility)] value; xi the nutrienti content of diet; u the gross energy value of uric acid on the basis of a crude protein equivalent (5.5 MJ/kg crude protein); CP the crude protein content of diet; mdCP the mean digestibility of CP.
GE value of nutrients were taken from the study by Noblet and Perez (Reference Noblet and Perez1993) and corrected by a 0.99 multiplying factor for adjustment to the GE energy value of diets measured in the current experiment. Therefore, GE values (MJ/kg) used in the calculations were 38.83, 22.83, 17.20, 16.16 and 18.44 for lipids, proteins, starch, sugars and WICW, respectively. Mean digestibilities were deduced from the in vivo values observed in the current experiment (Supplementary Tables S2ab). Considering all diets, these mean digestibilities (%) were 84.1, 83.2, 95.9, 100 (assumed value), 89.0 and 95.5 for lipids, proteins, starch, sucrose and glucose, fermentable sugars and total sugars, respectively. For maize diets (no wheat), mean digestibilities (%) were 88.1, 85.0, 96.9, 100 (assumed value), 87.7 and 95.0, respectively.
Indirect equations included WICW as a variable. Theoretical indirect equations were built using the principle that WICW and ash act as diluters of available nutrients (Carré et al., Reference Carré, Prévotel and Leclercq1984), as WICW components represent the whole fraction of fibres that are not digested by chickens (Carré et al., Reference Carré, Derouet and Leclercq1990). Indirect1 equation used GE, CP and WICW variables as follows:
Theoretical indirect1 equation:
 $${\rm{AMEn}}\, = \,D\,{\rm{(GE - G}}{{{\rm{E}}}_{{\rm{CP}}}}\,{\rm{CP - G}}{{{\rm{E}}}_{{\rm{WICW}}}}\,{\rm{WICW)}} + {\rm{M}}{{{\rm{E}}}_{{\rm{CP}}}}\,{\rm{CP}}$$
where D is the mean digestibility of the gross energy assigned to lipids and non-cell-wall carbohydrates; GE the gross energy value of diet; GECP the gross energy value of crude protein (22.83 MJ/kg); GEWICW the gross energy value of WICW (18.44 MJ/kg); WICW the WICW content of diet; MECP the AMEn value of crude protein.
Considering all diets, using the mean protein digestibility value (83.2%) and the gross energy values of proteins and WICW:
 $${\rm{M}}{{{\rm{E}}}_{{\rm{CP}}}} = 0.832\,(22.83\:{\rm{ - }}\:u) = 14.42$$
and
 $${\rm{AMEn}}\,{\rm{ = }}\,D\,{\rm{(GE}}\,{\rm{ - }}\,{\rm{18}}{\rm{.44}}\,{\rm{WICW)}}\,{\rm{ - }}\,{\rm{(22}}{\rm{.83}}\,D\,{\rm{ - }}\,{\rm{14}}{\rm{.42)}}\,{\rm{CP}}$$
Considering all diets, the D coefficient was calculated using the mean digestibilities and mean contents of lipids, starch and sugars, observed in the current experiment, which gave
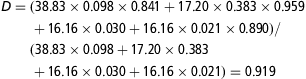 $$\displaylines{ D = & (38.83\times 0.098\times 0.841 + 17.20\times 0.383\times 0.959 \cr & + 16.16\times 0.030 + 16.16\times 0.021\times 0.890)/ \cr & (38.83\times 0.098 + 17.20\times 0.383 \cr & + 16.16\times 0.030 + 16.16\times 0.021) = 0.919 $$
Thereafter, coefficients were adjusted to the in vivo AMEn value of diets obtained in the current experiment using the 0.978 multiplying factor:
Thus
 $$\displaylines{ {\rm{[Thi1]\!\!:AMEn = }} \, & {\rm{0}}{\rm{.978}}\,D\,{\rm{(GE}}\,{\rm{ - }}\,{\rm{18}}{\rm{.44}}\,{\rm{WICW)}} \cr & {\rm{ - }}\,{\rm{(22}}{\rm{.33}}\,D{\rm{ - 14}}{\rm{.10)}}\,{\rm{CP}} $$
And (equation (39)):
 $$\displaylines{ {\rm{AMEn}}\,{\rm{(MJ/kg)}}\,{\rm{ = }} & \,{\rm{0}}{\rm{.899}}\,{\rm{GE}}\,{\rm{(MJ/kg)}}\,{\rm{ - }}\,{\rm{6}}{\rm{.41}}\,{\rm{CP}}\,{\rm{(g/g)}} \cr & {\rm{ - }}\,{\rm{16}}{\rm{.57}}\,{\rm{WICW}}\,{\rm{(g/g)}} $$
Theoretical indirect2 equations used lipids, ash and WICW, as follows:
 $${\rm{AMEn = }}\ D^{\prime}\,{\rm{(GE - G}}{{{\rm{E}}}_{{\rm{WICW}}}}\,{\rm{WICW) - }}u\,{\rm{m}}{{{\rm{d}}}_{{\rm{CP}}}}\,{\rm{CP}}$$
where D′ is the mean digestibility of the gross energy assigned to all nutrients except WICW; GE = 38.83 Lipids + 22.83 CP + 17.20 (non-cell-wall carbohydrates) + 18.44 WICW; Non-cell-wall carbohydrates (g/g DM) = 1−Lipids−CP−Ash−WICW.
Thus
 $$\displaylines{ {\rm{AMEn = }}\ & D^{\prime}\,{\rm{(17}}{\rm{.20}} + {\rm{21}}{\rm{.63}}\,{\rm{Lipids}} + {\rm{5}}{\rm{.63}}\,{\rm{CP - 17}}{\rm{.20}}\,{\rm{Ash}} \cr & {\rm{ - 17}}{\rm{.20}}\,{\rm{WICW) - }}u\,{\rm{m}}{{{\rm{d}}}_{{\rm{CP}}}}\,{\rm{CP }} $$
Considering all diets:
[D′ 5.63 CP – u mdCP CP] was very low and considered a constant by applying the mean CP content to the CP variable.
Considering all diets, the D′ coefficient was calculated in the same way as that described for D (see above), which gave: D′ = 0.891.
Thereafter, coefficients were adjusted to the in vivo AMEn value of diets obtained in the current experiment using the 0.977 multiplying factor:
Thus
 $$\displaylines{ {\rm{[Thi2]\!\!:}}\,{\rm{AMEn = }}\ & {\rm{0}}{\rm{.977 }}\,D^{\prime}\,{\rm{(17}}{\rm{.31}} + {\rm{21}}{\rm{.63}}\,{\rm{Lipids}} \cr & {\rm{ - 17}}{\rm{.20}}\,{\rm{Ash - 17}}{\rm{.20}}\,{\rm{WICW)}} $$
And (equation (42), data on dry matter basis):
 $$\displaylines{ {\rm{AMEn}}\, \ {\rm{(MJ/kg}}\ {\rm{DM) = }} \ & {\rm{15}}{\rm{.08}} + {\rm{18}}{\rm{.84}}\, \ {\rm{Lipids}}\ \,{\rm{(g/g)}} \cr & - {\rm{14}}{\rm{.98}}\,\ {\rm{Ash}}\,\ {\rm{(g/g)}} - {\rm{14}}{\rm{.98}}\,\ {\rm{WICW}}\,\ {\rm{(g/g)}} $$
Theoretical equations were noticed as ‘a’, ‘b’ or ‘c’. Equations ‘a’ were those with no considerations about wheat or wheat-related parameters such as RAV or PAV. Equations ‘b’ and ‘c’ introduced RAV or wheat content parameters, respectively, to take account of the strong influence of wheat on digestibilities.
The first step of calculations of coefficients of theoretical equations ‘b’ and ‘c’ were obtained by only considering maize diets (no wheat), and applying the calculations described above. These equations differed from ‘a’ equations by mean digestibilities, and D (0.938) or D′ (0.910) values that were higher than those obtained by considering all diets. Thereafter, these equations obtained from maize diets were corrected by introducing RAV or wheat variables as follows: considering all diets, the differences between the in vivo AMEn value and the AMEn value calculated from these equations were submitted to simple regression analyses, with RAV or wheat content as independent variable; then, the results of these simple regressions were used to correct the theoretical equations obtained from maize diets to obtain theoretical equations adapted to all diets.
Statistical analyses
ANOVA and simple or multiple regression analyses were performed using the SuperAnova software (1989 to 1991, version 1.11, Abacus Concepts Inc., Berkeley, CA, USA). Stepwise regression method was used for selecting regression equations, with the Statview software (1998, version 5.0, SAS Institute Inc, Cary, NC, USA). For regressions with no intercept, R 2 values were calculated as: 1 – RSD2/σ 2y, with RSD and σ 2y being the residual standard deviation of the regression equation and the variance of the dependent variable, respectively.
Results
Diet composition
Measured analytical data were often rather close to the values expected from calculations. Thus, as expected, correlations between contents of available nutrients (crude proteins, lipids, starch, sucrose + glucose, fermentable sugars) were rather low (|r|⩽0.37; Supplementary Table S3). Moreover, correlations between digestible components were even lower (|r|⩽0.24; Supplementary Table S3). Thus, independences between these variables were at a satisfactory level. A dependence was observed between crude protein and non-cell-wall carbohydrates (r = −0.58; Supplementary Table S3). Some dependence could also be noticed for WICW content, on starch, ash, RAV and PAV contents (r = −0.65; 0.69; 0.64; 0.60; Supplementary Table S3). Ash content also showed a dependence on starch content, with a r value of −0.58 (Supplementary Table S3).
Ranges of variations were rather large for starch, CP and WICW contents, with s.d. exceeding 31 g/kg, less for lipids and sugars (12 g/kg < s.d. < 16 g/kg) and rather low for ash (s.d. = 5 g/kg).
Strong relationships were found between homologous analyses (lipids A or B; starch P or E; total reducing sugars or sucrose + fermentable sugars; WICW, NDF or crude fibre; NCC or starch + sugars) (Supplementary Tables S2ab). For instance, the following relationship was observed:
 $$\displaylines{ {\rm{NCC = }} \& {\rm{1}}{\rm{.025}}\,{\rm{(starch}}\,{\rm{E}} + {\rm{sucrose}} + {\rm{glucose}} \cr & + {\rm{fermentable}}\,{\rm{sugars);}}\,{{R}^{\rm{2}}} {\rm{ = 0}}{\rm{.904}} $$
Among the three fibre criteria (crude fibre, NDF and WICW), WICW showed the highest content values.
Water-retention capacity of WICW was observed to be positively related to the WICW/NDF ratio (P = 0.014, with diet 15 as outlier).
RAV and PAV values (Supplementary Tables S2ab) were strongly related to wheat introduction (R 2 = 0.92 and 0.96, respectively). From these relationships, it could be estimated that the RAV and PAV values of the wheat sample used in the current experiment were 3.51 and 4.29 ml/g DM, respectively.
Water excretion
Water excretion was described according to three parameters: the water content of excreta, the water excretion/feed intake ratio and the residual value from the regression equation expressing water excretion as a function of feed intake (Supplementary Table S4). The amount of water excretion was strongly and positively related to feed intake, with the following relationship:
 $${\rm{WEd}} = {\rm{1}}{\rm{.85}}\,{\rm{FId}} - {\rm{86}}{\rm{.7;}}\,{{R}^{\rm{2}}} = {\rm{0}}{\rm{.58,}}\,n = {\rm{240,}}\,P = {\rm{0}}{\rm{.0001}}$$
where WEd is the individual daily water excretion (g); FId the individual daily feed intake (g).
According to the intercept, the WEd/FId ratio mechanically increased when FId increased. Thus, the residual values (RWEs) from this regression were also calculated to evaluate water excretion independently of feed intake level. It may be noticed that these residual values were not affected by trial effect. RWE was positively correlated with the dry matter excretion/feed intake ratio (R 2 = 0.21; n = 240; P = 0.0001).
The effect of diets was strongly significant (P = 0.0001) on the three parameters of water excretion (Supplementary Table S4). The diet that produced the highest level of residual water excretion (diet 7, Supplementary Table S4) contained high levels of wheat and sunflower meal and did not contain any meat meal or soya bean protein isolate (Supplementary Table S1a). The diet with the lowest residual water excretion (diet 17, Supplementary Table S4) contained meat meal and protein soya bean isolate and did not contain any wheat or sunflower meal (Supplementary Table S1b).
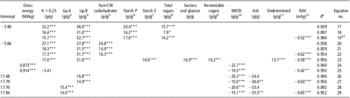
The main regression equations relating these individual water excretion parameters to diet analyses are shown in Table 1. WICW content or the amount of cell-wall-retained water appeared in some regressions, as positive factors for WEd/FId and RWE dependent variables (Table 1). Sugar components were present in almost all regressions as positive factors (Table 1). Electrolyte parameters (Cl or K) appeared in all regressions as positive factors (Table 1). Either starch content or in vivo AMEn values appeared as negative factors in some regressions. In vitro viscosity of water extract (RAV) was a significant positive factor in the equations including the starch variable. No regression contained the CP factor (Table 1). Residual values from each of these regression calculations were not affected by trial effect.
Multiple regression calculationsFootnote 1 relating individual water excretion parameters (Y; n = 240) to in vivo AMEnFootnote 2 and chemical or physical analyses of diets (dry matter basis) in 4-week broilers

* P < 0.05, **P < 0.01, ***P < 0.001.
1 Residual values from regression calculations were not significantly affected by trial effect. Models were all significant (P = 0.0001).
2 Apparent metabolisable energy value of diets corrected to zero nitrogen retention.
3 Starch from the DMSO-enzyme method.
4 WICW = water-insoluble cell-wall (Carré and Brillouet, Reference Carré and Brillouet1989). CW retained water = cell wall retained water (g water/g diet) (Carré et al., 1994).
5 RAV = real applied viscosity (Carré et al., 1994).
6 Values calculated from ingredient composition of diets.
7 Residual values from the regression: g excreted water/day = f (g feed intake DM/day).
Relationships with in vivo apparent digestibilities
Ranges of variation for in vivo digestibilities (%) were 78.6 to 87.1, 71.8 to 90.6, 92.7 to 97.7 and 80.8 to 95.4 for proteins, lipids, starch and fermentable sugars, respectively (Supplementary Tables S2ab). Main regressions relating apparent digestibilities to feedstuff contents are shown in Table 2. Wheat was a negative factor for digestibilities of starch, lipids and proteins, with the strongest coefficient being observed for lipid and the weakest for starch digestibility (Table 2). Peas were negative for starch digestibility, with a coefficient rather similar to that observed for wheat (Table 2). Meat meal was negative for protein digestibility (Table 2).
Main regression calculationsFootnote 1 relating mean digestibilities in 4-week broilers (Y; n = 30) to dietary ingredient introductions

1 Models and coefficients were all significant (P = 0.0001 and P < 0.0001, respectively). Residual s.d. were 0.69, 3.22 and 1.10 for digestibilities of starch, lipid and protein, respectively.
2 Starch digestibility values were corrected for trial effect (−0.65, + 0.27 and + 0.37 for trials 1, 2 and 3, respectively). For lipid and protein digestibilities, residual values from regression calculations were not significantly affected by trial effect.
Fibre-related parameters (crude fibre, NDF, WICW, RAV and PAV) were often negatively correlated (P < 0.05) with digestibilities (Supplementary Table S5), and also positively correlated with wheat content.
Relationships with in vivo AMEn values
Relationships between in vivo AMEn value of diets and AMEn values calculated using either ingredient composition of diets (Supplementary Tables S1ab) or analytical predicting equations from literature (Supplementary Tables S2ab) were all highly significant (P = 0.0001), with R 2 values ranging from 0.842 (calculation from ingredient composition of diets) to 0.928 (direct equation, according to Fisher and McNab, Reference Fisher and McNab1987). However, in vivo AMEn values were always lower than calculated values (Supplementary Tables S1ab and S2ab). Differences between the in vivo AMEn values and the AMEn values calculated with analytical predicting equations from literature were strongly related (P = 0.0001) to wheat introduction (Supplementary Figure S1). Hence, increasing wheat introduction resulted in increasing reduction in the in vivo AMEn values compared with the AMEn values expected from calculations (Supplementary Figure S1).
Among the various analytical parameters of diets, fibre-related parameters showed the strongest correlations (from −0.91 to −0.75) with in vivo AMEn values. Ash content also exhibited a strong negative correlation (−0.74) with in vivo AMEn values (Supplementary Table S5).
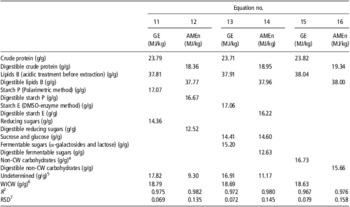
Table 3 shows three pairs of regressions calculating GE or in vivo AMEn (paired equations no.: 11 and 12, 13 and 14, 15 and 16) where coefficients for crude and digestible components should be the same in a pair, except for proteins whose coefficients should differ by 5.5, the correction for uric acid excretion. Coefficients of paired equations were very similar for lipids, starch, non-cell-wall carbohydrates, sucrose + glucose and proteins (after correction by adding 5.5 to digestible protein coefficients), but showed notable difference for total sugars, fermentable sugars and undetermined components, with reduced values in AMEn equations compared with GE (Table 3). Coefficients of WICW in AMEn regressions (Table 3) did not differ from zero. Thus, WICW variable was removed from the AMEn regression calculations as shown in Table 3.
Multiple regression calculations without interceptFootnote 1 (n = 30) calculating GEFootnote 2 and mean in vivo AMEnFootnote 2 values of diets (MJ/kg DM) in 4-week broilers, using crude and digestibleFootnote 3 nutrient contents, respectively. All data are expressed on dry matter basis

1 Residual values from regression calculations were not significantly affected by trial effect. Coefficients were all highly significant (P = 0.0001), except in equation (12) for the coefficient of ‘Undetermined’ (P = 0.0065). Models were all significant (P = 0.0001).
2 Gross energy value, and apparent metabolisable energy value corrected to zero nitrogen retention.
3 For starch P, total reducing sugars and non-cell-wall carbohydrates, the digestibilty values used for calculation of digestible nutrient contents were obtained by using starch E and fermentable sugar digestibilities, and by considering sucrose and glucose 100% digested components.
4 Non-cell-wall carbohydrates = 1 – N × 6.25 – Lip.B – WICW – Ash.
5 Undetermined = (1 – N × 6.25 – Lip.B – St.P – total sugars – WICW – Ash) or (1 – N × 6.25 – Lip.B – St.E – Sucr – Glc – Ferm.Sug. – WICW – Ash).
6 Water-insoluble cell-walls.
7 Residual s.d.
The regressions calculating in vivo AMEn as functions of crude dietary components are shown in Table 4. Regressions were done according to schemes of a direct equation or indirect equations (1 or 2) (see the ‘Material and methods’ section). For each equation scheme, introduction of the RAV variable led to noticeable improvement in precision, especially in the scheme of indirect2 equations (Table 4). The accuracies of the regression calculations including the RAV variable were rather high and very similar, with R 2 values ranging from 0.950 to 0.966 (Table 4). Test of the trial effect on residual values was negative for all equations, except for equation (19) (Table 4). However, this trial effect was low, with difference between trials not exceeding 0.23 MJ/kg. A correction for this trial effect was applied to each in vivo AMEn value, before obtaining the coefficients shown in equation (19).
Multiple regression calculationsFootnote 1 (n = 30) relating mean in vivo AMEnFootnote 2 value of diets (MJ/kg DM) in 4-week broilers to dietary analytical data. All data are expressed on dry matter basis

CW = cell wall.
*P < 0.05, **P < 0.01, ***P < 0.001.
1 Models were all significant (P = 0.0001). Residual s.d. ranged from 0.189 to 0.382.
2 Apparent metabolisable energy value corrected to zero nitrogen retention.
3 Lipids with no acidic treatment before extraction.
4 Lipids with an acidic treatment before extraction.
5 Non-cell-wall carbohydrates = 1 – N × 6.25 – Lip.B – WICW – Ash.
6 Starch from polarimetric method.
7 Starch from DMSO-enzyme method.
8 Total sugars from reducing sugar method.
9 α-galactosides and lactose.
10 WICW = Water-Insoluble Cell-Wall (Carré and Brillouet, Reference Carré and Brillouet1989).
11 Undetermined = 1 – N × 6.25 – Lip.B – St.E – Sucr. – Glc – Ferm.Sug. – WICW – Ash.
12 RAV = Real Applied Viscosity (Carré et al., 1994).
13 For equation (19), in vivo AMEn values were corrected for trial effect (−0.088, −0.053 and + 0.14 for trial 1, 2 and 3, respectively). For other equations, residual values from regression calculations were not significantly affected by trial effect.
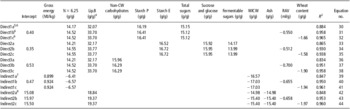
Theoretical equations calculating AMEn values are shown in Table 5. Simple regressions relating these calculated values to in vivo AMEn values produced residual values that did not differ between trials, except for equation (31). However, this effect remained limited with a difference between trials not exceeding 0.236 MJ/kg. Theoretical equations produced AMEn values showing satisfactory relationships with in vivo AMEn values, with strong improvement in precisions when RAV or wheat inclusion variables were introduced in equations (Table 5). The direct theoretical equations 30 and 36 (Table 5) showed similar precision compared with their regression counterparts (equations 18 and 21, Table 4). On the contrary, the indirect theoretical equations 39 and 42 (Table 5) showed lower precision than their regression counterparts (equations 24 and 26, Table 4). The theoretical equations fitted to in vivo AMEn values by a simple regression calculation adding RAV or wheat variables showed R 2 values (equations 31, 32, 34, 35, 37, 38, 40, 41, 43, 44, Table 5) close to those found for their multiple regression counterparts (equations 19, 22, 23, 25, 27, 29, Table 4).
Theoretical equationsFootnote 1 expressing AMEnFootnote 2 value of diets (MJ/kg DM) in 4-week broilers, with coefficientsFootnote 3 being based on mean in vivo digestibilities, and gross energy value (MJ/kg) of nutrients

CW = cell wall; WICW = water-insoluble cell-wall.
1 R 2 values are those of regressions with no intercept relating the calculated theoretical AMEn values to in vivo AMEn values. Their residual s.d. (RSD) ranged from 0.190 to 0.415. Residual values did not differ between trials, except for equation (31) (trial effects: 0.093, 0.050 and −0.143 MJ/kg DM, for trials 1, 2 and 3, respectively).
2 Apparent metabolisable energy value corrected to zero nitrogen retention.
3 Coefficients obtained from theoretical calculations were corrected (except those for RAV and wheat content) for fitting on in vivo AMEn values, using the following multiplying factors: 0.982, 0.985, 0.985, 0.985, 0.987, 0.987, 0.985, 0.985, 0.985, 0.978, 0.985, 0.985, 0.977, 0.984 and 0.984, for equations from (30) to (44), respectively.
4 Significance of parameters are shown in Table 4.
5 Direct equations are under the form of: ∑aixi – uxp (protein mean digestibility), where ai = (nutrienti gross energy) × (nutrienti mean digestibility); xi = nutrienti content; u = gross energy value of uric acid on the basis of a crude protein equivalent (5.5 MJ/kg crude protein); xp = crude protein content.
6 Coefficients of equations noticed as ‘a’ are based on means from all diets. Those noticed as ‘b’ or ‘c’ are based on means from diets devoid of wheat; then, RAV or wheat coefficients, and intercepts are calculated by fitting on in vivo AMEn values of all diets.
7 Indirect1 equations are under the form of: b GE + c xp + d WICW, where b = mean digestibility of the gross energy assigned to all nutrients except proteins and fibres; c = (metabolisable energy of 100% digested proteins) × (mean protein digestibility) – b (protein gross energy); d = −b (fibre gross energy).
8 Indirect2 equations are under the form of: E + f Lipids + g Ash + h WICW, with: I = mean digestibility of the gross energy assigned to all nutrients except fibres; E = I (carbohydrate gross energy) + I (mean protein content) × [(protein gross energy) – (carbohydrate gross energy)] − 5.5 (mean digestible protein content); f = I [(lipid gross energy) – (carbohydrate gross energy)]; g and h = – I (carbohydrate gross energy).
Coefficients of direct theoretical equations (Table 5) were often rather similar to those of their counterparts obtained by multiple linear regression without a constant (Table 4), except for CP that often showed a much higher coefficient in direct multiple regression calculations than in direct theoretical equations. The best agreement between coefficients of a theoretical equation and those of its regression counterpart was observed for the theoretical equation (31) (Table 5), as compared with the regression equation (19) (Table 4). Coefficients of indirect theoretical equations (Table 5) were often rather different from those of their regression counterparts (Table 4), especially for CP, ash and intercept.
Discussion
Regarding the ranges of diet compositions, it can be considered that domain of utilisation of regression equations obtained in the current study was rather large. Correlations between available nutrient contents (proteins, lipids, starch, sucrose + glucose and fermentable sugars) were rather low (Supplementary Table S3). Therefore, conditions should be appropriate for considering that coefficients appearing in direct regression equations with no intercept (Table 4) represented the mean AMEn value assigned to available nutrients.
AMEn value of diets depends both on nutrient contents and digestibilities. Therefore, if digestibility variations are associated with some nutrient contents, this can introduce some bias in the significance of coefficients appearing in multiple regression equations. Such associations were observed in the current experiment. For instance, high positive correlations were observed between CP content and digestibilities of starch and lipids (Supplementary Table S5). Thus, it was not surprising to observe high unexpected high value for CP coefficients in many regression equations (Table 4), as compared with their theoretical coefficient counterparts (Table 5). The RAV variable was strongly associated with reduced digestibilities (Supplementary Table S5). Therefore, its introduction in regression schemes not only improved the accuracy of predictions (Table 4), it also reduced the CP coefficients towards theoretical values (Tables 4 and 5).
It cannot be deduced from this experiment that in vitro viscosity (RAV or PAV) was the only cause of reduced digestibilities, as viscosity values only varied because of wheat introduction. Therefore, other wheat factors could be responsible as well, such as hardness (Carré et al., Reference Carré, Muley, Gomez, Oury, Laffitte, Guillou and Signoret2005). Wheat was a major factor of reduced digestibilities (Table 2) and AMEn (Supplementary Figure S1). A negative effect of peas was observed on starch digestibility (Table 2), in agreement with previous experiments (Carré et al., Reference Carré, Beaufils and Melcion1991), with a coefficient showing a similar magnitude compared with that observed for wheat (Table 2). The negative effect of meat meal on protein digestibility (Table 2) was in agreement with the observation of lower amino acid digestibilities for meat meal than for soya bean meal (Lessire et al., Reference Lessire, Leclercq, Conan and Hallouis1985).
Digestibility variations because of feedstuff introduction levels were a major problem for obtaining proper accuracies of AMEn prediction, similar to those found with adult cockerels (Carré et al., Reference Carré, Prévotel and Leclercq1984). However, introduction of the RAV variable in regression schemes reduced RSDs (Table 4) down to values close to those obtained in 1984 with adult cockerels (Carré et al., Reference Carré, Prévotel and Leclercq1984).
The fact that in vivo AMEn values were always lower than calculated values (Supplementary Figure S1) was not surprising, as calculated values were based on experiments conducted on adult cockerels (Fisher and McNab, Reference Fisher and McNab1987; Carré and Brillouet, Reference Carré and Brillouet1989) that always showed higher AMEn values, as compared with broiler chickens (Bourdillon et al., Reference Bourdillon, Carré, Conan, Francesch, Fuentes, Huyghebaert, Janssen, Leclercq, Lessire, McNab, Rigoni and Wiseman1990b).
Indirect equations based on a fibre parameter were only tested with the WICW parameter. Other fibre parameters showed lower correlations with in vivo AMEn values (Supplementary Table S5) and did not make possible the development of theoretical equations predicting AMEn values. In contrast with other fibre parameters, a precise nutritional significance can be assigned to the WICW parameter. WICW includes all cell-wall components that cannot be digested by poultry, namely, lignin, cellulose, water-insoluble hemicelluloses and water-insoluble pectic substances (Carré et al., Reference Carré, Derouet and Leclercq1990). Crude fibre does not include water-insoluble hemicelluloses and water-insoluble pectic substances, and NDF does not include water-insoluble pectic substances (Carré and Brillouet, Reference Carré and Brillouet1986). Accordingly, it was logical that the highest values of fibre contents were obtained with the WICW parameter.
Hence, WICW parameter can be introduced in theoretical AMEn predicting equations using the principle that WICW is a diluter of available nutrients (Carré et al., Reference Carré, Prévotel and Leclercq1984). A good agreement was previously observed between the regression and theoretical equations based on indirect approaches (Carré et al., Reference Carré, Prévotel and Leclercq1984). In the current experiment, the indirect1 scheme led to a satisfactory agreement between regression (Table 4) and theoretical equations (Table 5) when the RAV variable was introduced. However, regarding the indirect2 scheme, coefficients of regressions (Table 4) were rather far from theoretical values (Table 5). This could be explained by bias in the significance of parameters of the indiect2 regression scheme, as WICW and ash were associated between themselves and also with starch content and nutrient digestibilities (Supplementary Tables S3 and S5).
Regression coefficients of dietary components found for GE prediction were close to those found by Noblet and Perez (Reference Noblet and Perez1993), except for sugars (14.4 to 15.2 (Table 3) instead of 16.3 by Noblet and Perez). The great similarity generally observed between the regression coefficients of crude components (GE predictions) and those of digestible components (AMEn prediction, with a 5.5 correction for CP) (Table 3) shows the good reliability of data obtained in the experiment.
The interest of theoretical equations lies in the fact that the additivity principle, which is at the basis of their calculation, makes them possible to be used in a wide range of situations. Moreover, owing to the fact that the significance of their coefficients is known (see the ‘material and methods’ section), their coefficients can be changed according to knowledge about the feed to be evaluated.
Wheat coefficients of theoretical equations (Table 5) expressed the difference in wheat AMEn values between in vivo data and the calculated data that would be expected from the digestibility values observed with maize diets. Estimations of this difference ranged between 1.58 and 1.97 MJ/kg DM) (Table 5), which was rather high. An approximation of this difference was also given by wheat coefficients (1.33 to 1.51 MJ/kg DM; Supplementary Figure S1) observed in the regressions calculating differences between measured and calculated AMEn values, the latter values being obtained with equations from literature for adult cockerels (Supplementary Figure S1).
In this experiment, it could be observed that, in many cases, the use of theoretical equations (Table 5), instead of regression equations (Table 4), did not really change the accuracy of AMEn predictions, especially those using RAV or wheat parameters, which shows the reliability of theoretical equations. As discussed above, these theoretical equations, either transformed or not transformed, can be used widely because of their basic additivity principle. These equations can be applied to mixed diets using the same type of correction as that used for wheat introduction (Table 5) when a feedstuff is expected to produce low digestibility values compared with a standard maize–soya bean diet. Conversely, these theoretical approaches can also be used for evaluating the AMEn value of feedstuffs introduced in a maize–soya bean diet, avoiding the AMEn measurement of the basal maize–soya bean diet.
Water excretion is an important factor affecting litter humidity in broiler housing systems, and thus air humidity, ammonia production from litter fermentation and foot pad dermatitis. In addition to the measurement of available energy of diets, the experiment also made possible to measure water excreta losses. Therefore, associations between water excretion parameters and diet composition could be evaluated.
First of all, the regression calculating the relationship between water excretion and feed intake showed that the ratio of water excretion to feed intake increased when the feed intake increased. Hence, any factor decreasing feed intake, such as high energy level or mash given instead of pellets, should be very efficient for reducing total water losses and the [excreted water : feed intake] ratio. To distinguish effects different from these effects derived from feed intake variations, the residual water losses calculated from relationships between water losses and feed intake were calculated (Table 1).
Regression calculations confirmed some of the nutritional factors already identified as being responsible of water loss excess (see the review by Francesch and Brufau, Reference Francesch and Brufau2004), such as electrolytes or fibres (Table 1). The water-retention capacity of fibres was probably involved in the effect of fibres, as the most efficient equation predicting residual water losses used the ‘CW retained water’ parameter, not the WICW parameter (equation (7), Table 1). As a high negative correlation was observed between AMEn and WICW (Supplementary Table S5), it was not surprising to observe a strong negative effect of AMEn value on residual water losses (equation (6), Table 1). Fibre parameters were not observed to be associated with the water content of excreta (Table 1), probably because the diluting effect of fibres counteracted their effect on water losses.
As expected, the viscosity of water extract (RAV) was associated with water loss excess in some equations (equations 2 and 5, Table 1). However, the RAV variable was not associated with the water content of excreta (Table 1).
Sugars, especially fermentable sugars, were present in almost all equations as parameters associated with water loss excess (Table 1). Lactose, introduced in two diets (Supplementary Table S1ab), played a role in this response. Lactose, a fermentable sugar for poultry (Carré et al., Reference Carré, Flores and Gomez1995), was already observed to result in water loss excess (Carré et al., Reference Carré, Flores and Gomez1995), probably because of its high osmotic power associated with poor degradability and absorbability.
The significant effect of potassium on water excretion (equation (6), Table 1) was consistent with previous results showing increasing water excretion associated with increasing levels of potassium in diets for chickens (Francesch and Brufau, Reference Francesch and Brufau2004). However, the electrolyte component that resulted in the most significant responses was chloride (Table 1). Hooge et al. (Reference Hooge, Cummings and McNaughton1999) also observed that chloride induced a powerful effect on water excretion excess in broiler.
It was noteworthy that no association was observed between dietary protein level and water excretion, despite the fact that such an association is commonly believed to exist (Francesch and Brufau, Reference Francesch and Brufau2004). As already pointed out by Francesch and Brufau (Reference Francesch and Brufau2004), studies reporting such effects of proteins were conducted with varying levels of soya bean meal. In fact, several studies demonstrated that high levels of soya bean meal resulted in increased water losses (Wheeler and James, Reference Wheeler and James1950) or high incidence of foot pad dermatitis (Jensen et al., Reference Jensen, Martinson and Schumaier1970; Eichner et al., Reference Eichner, Vieira, Torres, Coneglian, Freitas and Oyarzabal2007), independently of the dietary level of proteins. According to the results of the current experiment, the effect of soya bean meal on water losses is probably the consequence of its high levels of WICW (Carré and Brillouet, Reference Carré and Brillouet1986), fermentable sugars (Karr-Lilienthal et al., Reference Karr-Lilienthal, Grieshop, Spears and Fahey2005) and potassium (Carré et al., 2008). The effect of WICW in soya bean meal is probably reinforced by its high water-retention capacity (Carré, Reference Carré2002).
Contents of fermentable sugars in soya bean meal are rather high among plant protein meals (Bach Knudsen, Reference Bach Knudsen1997). However, other plant protein meals, such as those from rapeseed or sunflower, also contain high levels of potassium (Carré et al., 2008) and chloride and even contain higher levels of WICW than soya bean meal (Carré, Reference Carré2002). Thus, the problem of high water losses not only concerns soya bean meal, it probably also concerns most plant protein meals. In agreement with this statement, the correlation (r) between individual residual water losses and the sum of plant protein meals (soya bean, rapeseed and sunflower meals) was observed to be +0.28 (P = 0.0001) in the current experiment. Also in agreement with this statement were the compositions of the worst and best diets regarding residual water losses, with the best containing meat meal and protein soya bean isolate and no wheat and no sunflower meal, and a reverse situation for the worst diet.
Regarding cereals, the correlation between maize and individual residual water losses was pronounced and negative (r = −0.34; P = 0.0001). Maize was mainly introduced at the expense of wheat (Supplementary Table S1ab). Therefore, this correlation represented the advantage of using maize instead of wheat.
In conclusion, this study showed that AMEn values of diets measured in broilers were lower than values predicted with equations from literature set in the past with adult cockerels. These differences were linearly increased with the inclusion level of wheat in diets. Regression calculations predicting AMEn value of broiler diets were efficient when they included a parameter associated with wheat level, namely, the in vitro viscosity of water extract (RAV). Theoretical equations based on available nutrients (direct equations), or using fibre and ash parameters (indirect equations), were practically as efficient as regression equations, provided they used a parameter associated with wheat inclusion level.
Measurements of water losses in excreta showed that excess water losses were mainly associated with low AMEn values, or high levels of WICW, sugars and electrolytes, or high levels of plant protein meals and wheat. The dietary protein level was not observed to be a major factor associated with water losses.
Acknowledgements
This study was supported by a grant from Fonds SYPRAM (funding coming from companies subscribing to ‘Association pour le Maintien de l'Elevage en Bretagne’ (AMEB), ‘Syndicat National des Industriels de la Nutrition Animale’ (SNIA) and ‘Fédération Nationale des Coopératives de Production et d'Alimentation Animales’ (SYNCOPAC)) (Broiler Net Energy project, October 1996 to October 1998).
Special thanks are expressed to the companies participating in the chemical analyses of diets: CCPA, Celtic, Sanders and UFAC.
Authors are grateful to Joelle Gomez and Jean-Marc Hallouis (INRA, Nouzilly) and to Jean-François Gobin and his team (INRA, Le Magneraud) for their excellent technical assistance.