INTRODUCTION
Grain yield (GY) is a complex trait that is conditioned by several biochemical and physiological processes taking place throughout the growth cycle of crop plants. The yield of a grain crop can be defined as the product of the average rate of grain production (dry weight increase per unit ground area per unit time) and the duration of grain formation (units of time) (Daynard et al. Reference Daynard, Tanner and Duncan1971). The relative importance of grain-filling parameters on GY determination has been studied extensively. Grain yield was found to be related to variation in the rate of grain filling in various crops, such as wheat (Nass & Reiser Reference Nass and Reiser1975; Van Sanford Reference Van Sanford1985; Bruckner & Frohberg Reference Bruckner and Frohberg1987), barley (Metzger et al. Reference Metzger, Czaplewski and Rasmusson1984; Ho & Jui Reference Ho and Jui1989), rice (Jones et al. Reference Jones, Peterson and Geng1979) and safflower (Koutroubas & Papakosta Reference Koutroubas and Papakosta2010). In addition, positive associations between the duration of grain filling and yield have been reported in wheat (Gebeyehou et al. Reference Gebeyehou, Knott and Baker1982; Penrose et al. Reference Penrose, Walsh and Clark1998), barley (Leon & Geisler Reference Leon and Geisler1994) and maize (Bolaños Reference Bolaños1995). For a given grain-filling rate, lengthening of filling period is the most promising avenue to higher yield (Egli Reference Egli2004). The contrasting results regarding the relative importance of grain-filling rate and duration on yield are probably related to the influence of the environment on both of these parameters, as several environmental factors are involved in the grain-filling process. Usually, high temperatures or drought stress after anthesis are the most important abiotic factors that influence grain filling and can result in yield reduction in small-grain cereals (Wardlaw & Moncur Reference Wardlaw and Moncur1995; Gooding et al. Reference Gooding, Ellis, Shewry and Schofield2003; Zahedi & Jenner Reference Zahedi and Jenner2003).
To obtain optimal yields, an adequate supply of essential nutrients is required. The efficiency of nutrient uptake and utilization by plants determines the structure of plant ecosystems and affects the profitability, sustainability and productivity of cropping systems. In herbaceous plant communities consisting of annual or perennial species, it has been found that the species that used limiting nutrients more efficiently tended to dominate (Mamolos et al. Reference Mamolos, Veresoglou and Barbayiannis1995; Koutroubas et al. Reference Koutroubas, Veresoglou and Zounos2000). High nutrient use efficiency by plants could reduce fertilizer input costs, decrease the rate of nutrient losses and enhance crop yields (Baligar et al. Reference Baligar, Fageria and He2001). Nitrogen (N) is the most important mineral nutrient, quantitatively, for plant growth (Engels & Marschner Reference Engels, Marschner and Bacon1995). Hence, the application of N fertilizer results in high biomass and protein yield, and also increases the N concentration in plant tissues (Blumenthal et al. Reference Blumenthal, Baltensperger, Cassman, Mason, Pavlista, Hatfield and Follett2008). Genotypic variation for N uptake and nitrogen utilization efficiency (NUtE) has been reported for many small-grain crops (May et al. Reference May, Van Sanford, Mackown and Cornelius1991; Le Gouis et al. Reference Le Gouis, Delebarre, Beghin, Heumez and Pluchard1999; Koutroubas & Ntanos Reference Koutroubas and Ntanos2003), and the possibility of improving NUtE through plant breeding has been investigated (Van Ginkel et al. Reference Van Ginkel, Ortiz-Monasterio, Trethowan and Hernandez2001; Ju et al. Reference Ju, Yamamoto, Wang, Shan, Dong, Yoshida and Miyazaki2006).
Spelt wheat (Triticum aestivum (L) Thell. ssp. spelta Thell) was one of the major feed and food grains in ancient Europe. However, spelt culture has been replaced progressively by that of common wheat (Triticum aestivum (L.) Thell. ssp. vulgare (Will) MK.), which out-yields spelt under high-input conditions (Bertin et al. Reference Bertin, Grégoire, Massart and De Froidmont2001). However, spelt has been receiving interest in recent years due to its high nutritional grain quality and its suitability for low-input farming systems (Gomez-Becerra et al. Reference Gomez-Becerra, Erdem, Yazici, Tutus, Torun, Ozturk and Cakmak2010). Field studies conducted in southern Italy showed that spelt yields were intermediate between einkorn (Triticum monococcum L.) and emmer (Triticum dicoccum Schübler) (Troccoli et al. Reference Troccoli, Codianni, Ronga, Gallo and Di Fonzo1997; Troccoli & Codianni Reference Troccoli and Codianni2005). In Croatia, spelt yields at three seeding rates (200, 300 and 400 seeds/m2) ranged from 4·3 to 6·9 t/ha depending on cultivar and year, but were not affected by the seeding rate (Pospišil et al. Reference Pospišil, Pospišil, Svečnjak and Matotan2011). In a recent study, Koutroubas et al. (Reference Koutroubas, Fotiadis and Damalas2012) reported that spelt could be used as alternative crop in cooler Mediterranean areas, such as those of northern Greece, giving satisfactory yields that ranged from 4·3 to 6·0 t/ha.
In spelt, information regarding intraspecific and seasonal variation in grain-filling patterns, NUtE and its relationship with various plant traits is limited. Thus, the purpose of the present study was to assess, under field conditions, the relative importance of grain-filling rate and duration on grain growth and to analyse the NUtE and biomass production efficiency (BPE) of spelt under Mediterranean conditions. The performance of spelt was evaluated in relation to a well-adapted bread wheat cultivar grown under the same field conditions. Such results are important for the successful introduction of the crop to a given cropping system. Additionally, they may be used to identify indirect selection criteria for improving adaptation, GY and NUtE of spelt.
MATERIALS AND METHODS
Three spelt cultivars, Ressac, Poème and Cosmos, and one bread wheat cultivar, Centauro, were used in the present study. The spelt cultivars were selected to represent differences in some agronomic traits and yield potential. Poème is considered an early-maturing cultivar that combines high productivity and resistance to lodging; Ressac is a late-maturing, high-yielding cultivar with resistance to lodging, and Cosmos combines high productivity, resistance to lodging and low N demands. Centauro is a high-yielding bread wheat cultivar, widely cultivated in Greece, with resistance to lodging.
Field experiments were conducted at the farm of Democritus University of Thrace in Orestiada, Greece (41°33′N, 26°31′E, 33 m asl) during the 2002/03 and 2003/04 winter wheat growing seasons (referred to hereafter as 2003 and 2004 seasons, respectively). The soil of the experimental field is silty clay with pH 7·5 (1 : 2 water), organic matter 20·5 g/kg, electrical conductivity 0·04 S/m, total N 1·11 g/kg, nitrate (N-NO3) 9 mg/kg, phosphorus (P; Olsen) 13·2 mg/kg, and available potassium (K) 178 mg/kg (0–30 cm soil depth). The climate is Mediterranean type.
The experimental design was a split-plot with four replications. Main plot treatments consisted of two N fertilizer rates (0 and 100 kg N/ha), and sub-plot treatments were the cultivars. Half of the N was applied just before sowing as ammonium sulphate ((NH4)2SO4) and incorporated into the soil, and half top-dressed as ammonium nitrate (NH4NO3) at the start of stem elongation, i.e. growth stage (GS) 30 (Zadoks et al. Reference Zadoks, Chang and Konzak1974) for wheat and at the start of tillering (GS 21) for spelt. In both years, 80 kg P2O5 was broadcast, applied as superphoshate and incorporated into the soil before sowing. Plots were 6 m long and consisted of eight rows spaced 0·25 m apart. Individual seeds were hand-sown on 4 November 2002 and 25 November 2003 at a rate of 500 seeds/m2 (recommended rate for the area) for wheat, and 280 seeds/m2 for spelt, a quantity that is considered suitable for Mediterranean environments (Codianni et al. Reference Codianni, Paoletta, Castagna, Li Destri and Di Fonzo1993). No artificial irrigation was applied throughout the growing season.
To monitor grain filling, 150 simultaneously flowering spikes per plot were tagged on the same day. Fifteen randomly selected tagged spikes from each plot were sampled every 5–8 days during the period between anthesis and maturity. Spikes were oven dried at 70 °C until constant weight and weighed. Grain growth curves were calculated separately for each plot by fitting the data of spike weight on a cubic polynomial model, assuming that no other organ of the spike grew. Grain-filling rates for any given time were calculated by the equation dy/dt=b 1+2b 2t+3b 3t 2, where y represents the spike weight, t represents the time, and b i (where i=1, 2, 3) is the estimate of regression coefficients by fitting the cubic polynomial model (Jones et al. Reference Jones, Peterson and Geng1979). The time to maximum grain weight (grain-filling duration) was derived by setting the above equation to zero, and the time to maximum filling rate was derived by finding the value of t in which the equation reaches its maximum. The maximum grain weight and the maximum filling rate were then obtained by inserting the corresponding time to maximum grain weight and time to maximum filling rate, respectively, into the polynomial model.
Plant samples consisting of a 1 m row were taken from each plot at anthesis and maturity. The plants were cut at ground level at anthesis and separated into leaf, culm and chaff. At maturity, the spikes were further separated into spike vegetative components (i.e. branches and rachis) and grain. All plant samples were oven-dried at 70 °C to constant weight, weighed and ground in a Wiley Mill to pass through a 0·4 mm screen. Nitrogen concentration in plant samples was determined by the standard macro-Kjeldahl procedure (Bremner Reference Bremner, Black, Evans, Ensminger, White and Clark1965).
Dry matter translocation (DMT, kg/ha) was calculated as the difference between the total aboveground dry matter (DM) at anthesis and the DM of vegetative parts at maturity. Dry matter translocation efficiency (DMTE) was calculated as the ratio of DMT to total aboveground DM at anthesis multiplied by 100 (Papakosta & Gagianas Reference Papakosta and Gagianas1991; Ntanos & Koutroubas Reference Ntanos and Koutroubas2002). Nitrogen translocation (NT)-related parameters were calculated in a similar way on the basis of N content in the corresponding plant parts (Cox et al. Reference Cox, Qualset and Rains1986). Nitrogen harvest index (NHI) was calculated as the ratio of total N in grain to total aboveground plant N at maturity (grain N/plant N). In comparing cultivars with respect to their efficiency in utilizing N to produce biomass and GY the following parameters were calculated (terminology according to Moll et al. Reference Moll, Kamprath and Jackson1982; Ortiz-Monasterio et al. Reference Ortiz-Monasterio, Sayre, Rajaram and Mcmahon1997; Muurinen et al. Reference Muurinen, Kleemola and Peltonen-Sainio2007):
1. Biomass production efficiency (plant DM (g)/plant N (g), BPE)=Plant total aboveground DM/plant total aboveground N at maturity.
2. Modified BPE (vegetative DM (g)/plant N (g), BPEvege)=Plant total aboveground vegetative DM/plant total aboveground N.
3. Nitrogen utilization efficiency (grain DM (g)/plant N (g), NUtE)=Grain DM/plant total aboveground N at maturity.
The following formulae were constructed and analysed according to the method suggested by Moll et al. (Reference Moll, Kamprath and Jackson1982) to describe the net contribution of each component variable both directly and indirectly through the other variable:
 $${\rm Maximum}\,{\rm spike}\,{\rm weight}\,\left( {{\rm mg}} \right) = {\rm mean}\,{\rm filling}\,{\rm rate}\,\left( {{\rm mg}/{\rm day}} \right) \times {\rm time}\,{\rm to}\,{\rm maximum}\,{\rm weight}\,\left( {{\rm day}} \right),$$
 $${\rm NUtE} = \left( {G_{\rm w} /N_{\rm g}} \right) \times \left( {N_{\rm g} /N_{\rm t}} \right),$$
where G w=grain DM at maturity, N g=grain total N at maturity, and N t=plant total aboveground N at maturity. The grain produced per unit of grain N (the inverse of grain N concentration) is represented by G w/N g and N g/N t represents NHI. This analysis involves linearizing the multiplicative relationships by taking logs and then determining the contribution of each component trait to the sum of squares of the resultant trait. The sum of cross-products of each component trait by the resultant trait (Σx iyi) divided by the sum of squares of the resultant trait (Σy i2) gives the relative contribution of each component variable to resultant variable (Moll et al. Reference Moll, Kamprath and Jackson1982).
Statistical analysis of the data was performed using methods described in Steel & Torrie (Reference Steel and Torrie1980). The homogeneity of variances was checked and all measured and derived data were subjected to a combined over years analysis of variance (ANOVA) using the computer program MSTAT-C version 1.41 (Michigan State University, East Lansing, MI, USA). There were several year×treatments interactions; thus, separate ANOVA were computed for individual years and data are presented by year. Standard statistical procedures were used for calculating simple correlation coefficients and linear regression equations.
RESULTS
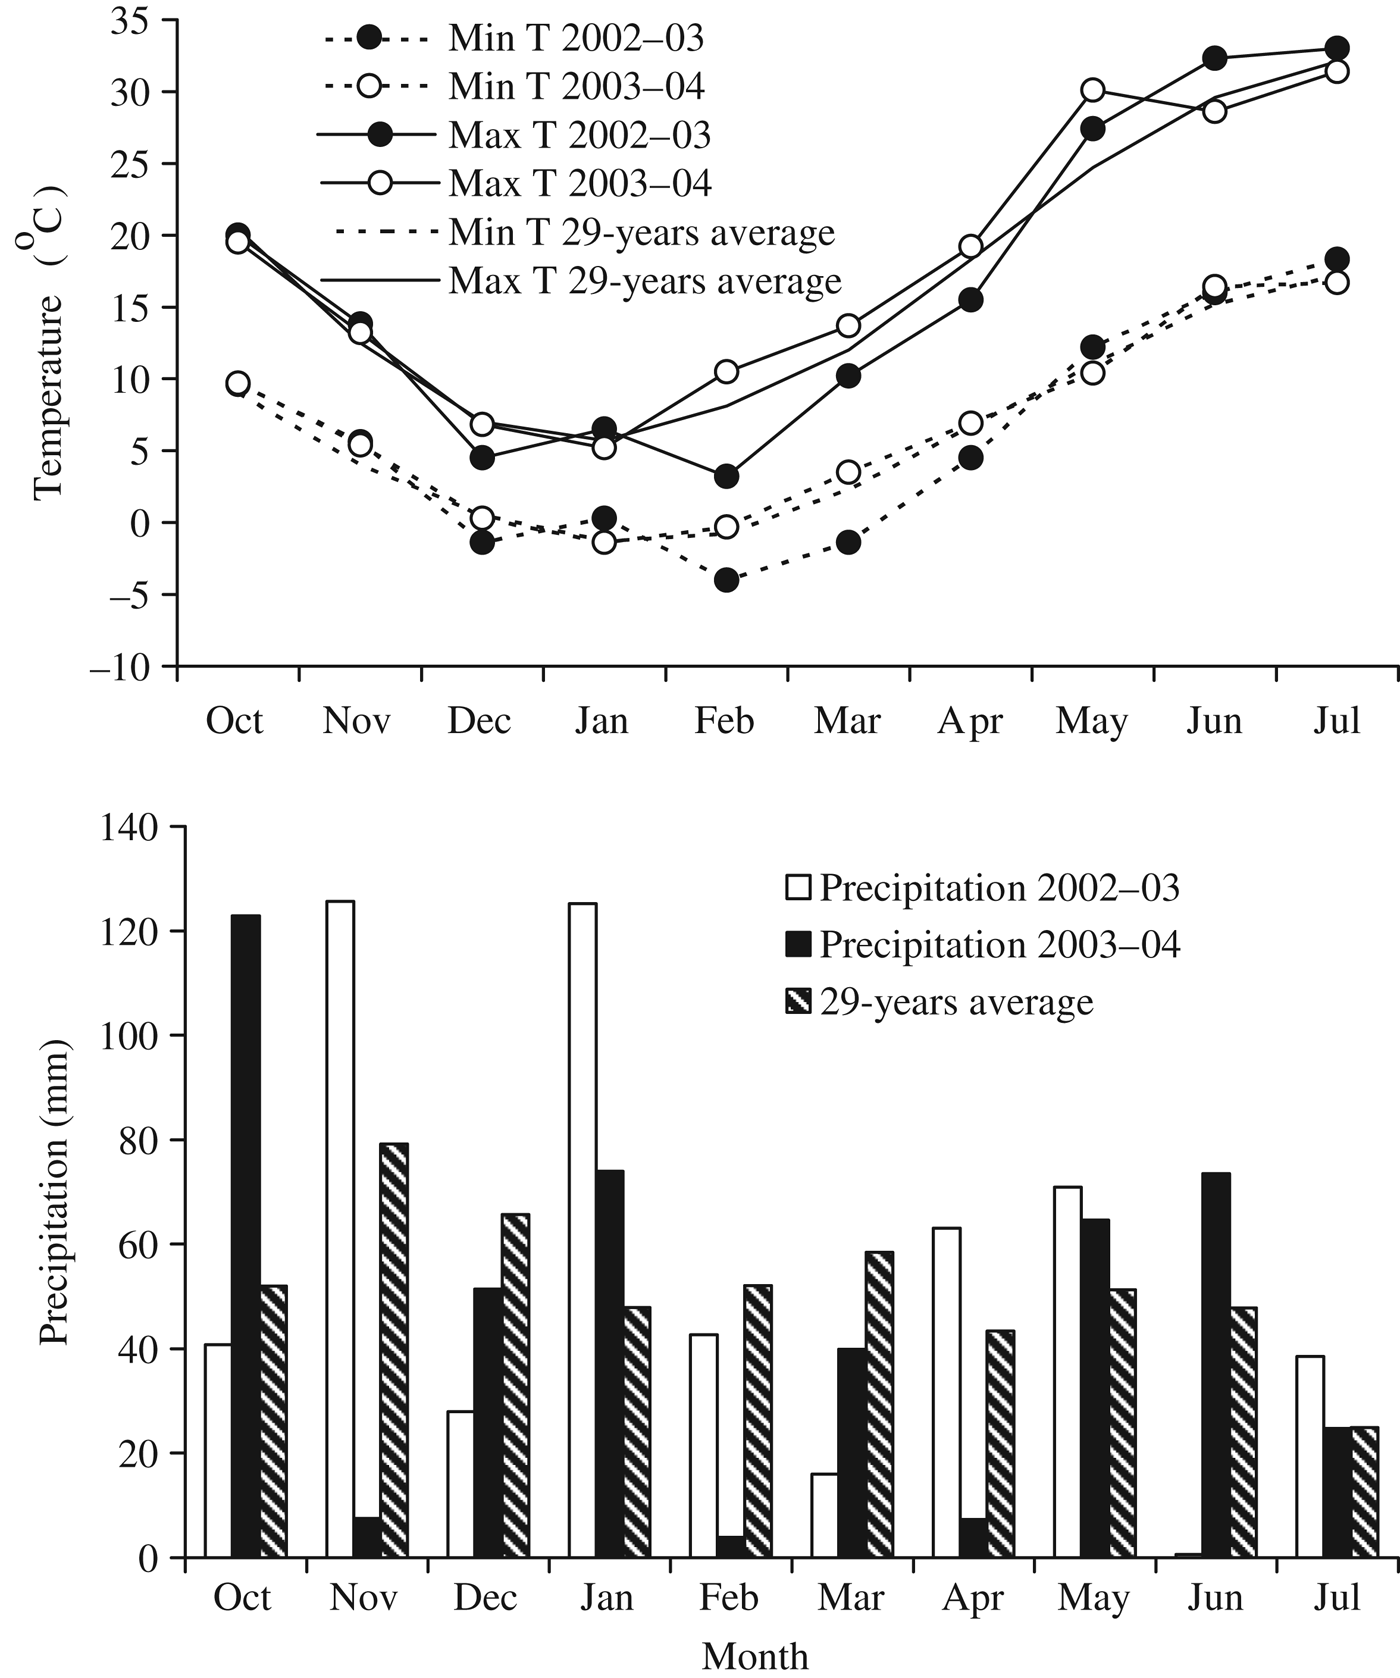
Total seasonal precipitation was 513 mm in 2003 and 450 mm in 2004, values that are quite similar to those of the 29-year average (498 mm) (Fig. 1). Rainfall during spring was 150 mm in 2003 and 112 mm in 2004. In addition, the temperatures recorded during spring in 2003 were lower compared with those in 2004. Grain filling took place mainly in June and coincided with dry and warm weather conditions in both years. No effective rainfall was recorded during the grain-filling period in 2003, while in 2004 75 mm of rainfall was distributed in 11 small events (<10 mm).
Monthly temperature (min and max) and precipitation during the growing season in 2002/03 and 2003/04, and the 29-year average for Orestiada, Greece.

Grain-filling parameters
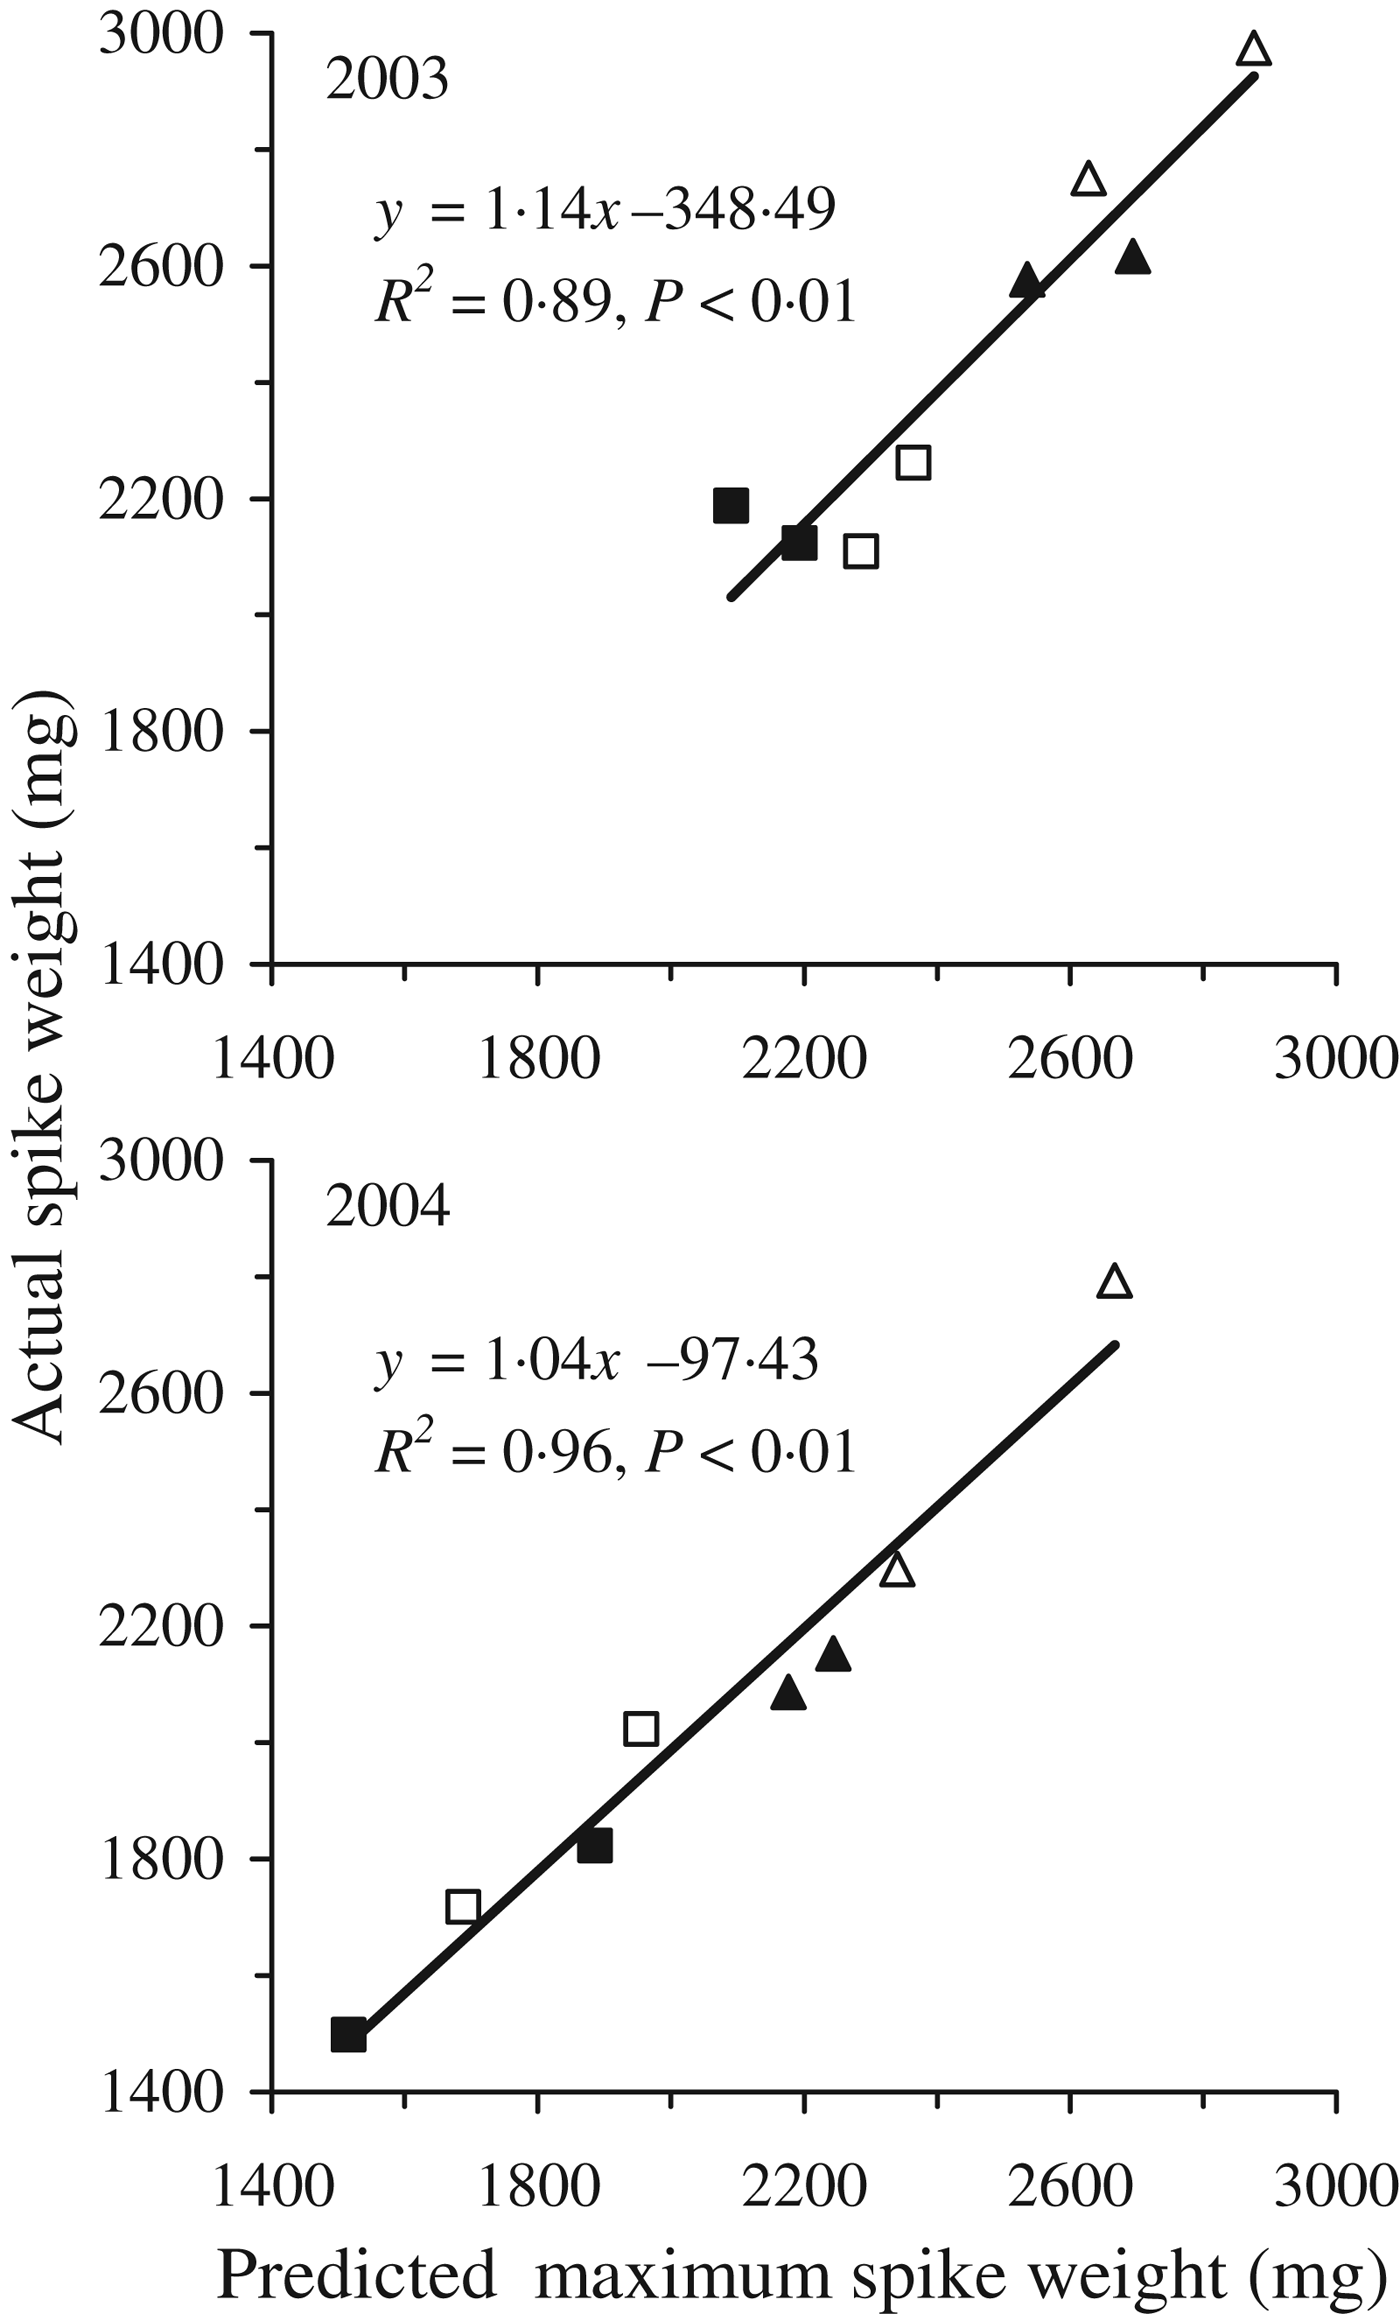
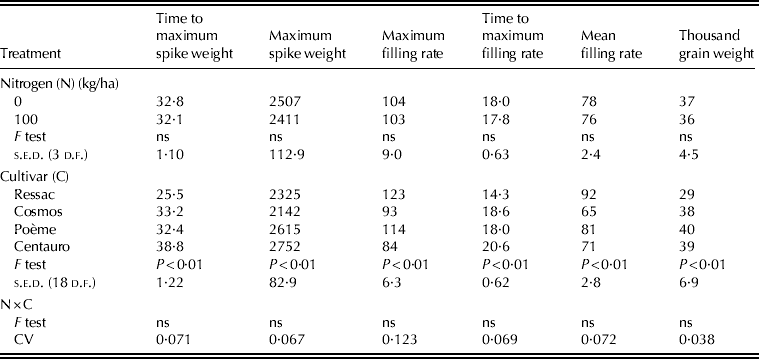
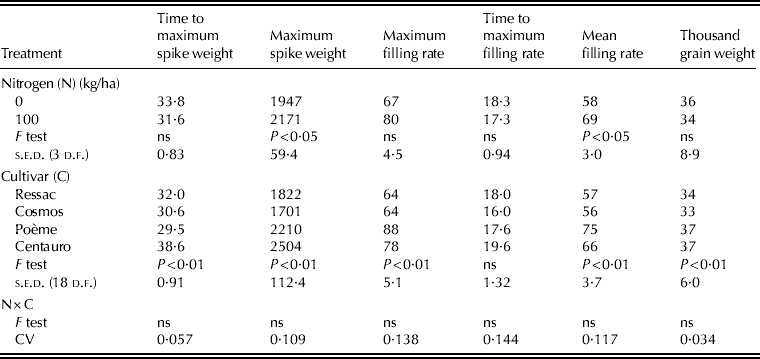
The grain-filling parameters calculated by fitting the data of the repeated spike weight determinations into the cubic polynomial model are given in Tables 1 and 2. The R 2 values for the fitted curve derived from the model were all high and ranged from 0·868 to 0·999 in 2003 and from 0·928 to 0·999 in 2004. The corresponding mean R 2 values for each cultivar ranged from 0·918 (Centauro) to 0·995 (Ressac) in 2003 and from 0·947 (Centauro) to 0·987 (Cosmos) in 2004 (data not shown). The actual values of spike weight at maturity were significantly (P<0·01) correlated with the predicted values of maximum spike weight estimated by the model (Fig. 2).
Relationships between actual spike weight at maturity and predicted maximum spike weight estimated using the cubic polynomial model for one bread wheat cultivar (Centauro, △) and three spelt cultivars (Ressac, □; Cosmos, ■; and Poème, ▲) grown in 2003 and 2004. Each relationship was based on means derived from the combination of four cultivars and two N application rates, n=8).
Mean values for time to maximum spike weight (day), maximum spike weight (mg), maximum filling rate (mg/day), time to maximum filling rate (day), mean filling rate (mg/day) and thousand grain weight (g) of spelt (Ressac, Cosmos and Poème) and bread wheat (Centauro) plants as affected by N application and cultivar in 2003
ns=non-significant.
Mean values for time to maximum spike weight (day), maximum spike weight (mg), maximum filling rate (mg/day), time to maximum filling rate (day), mean filling rate(mg/day) and thousand grain weight (g) of spelt (Ressac, Cosmos and Poème) and bread wheat (Centauro) plants as affected by N application and cultivar in 2004
ns=non-significant.
Grain-filling duration, as specified by the predicted time to maximum spike weight, was significantly (P<0·01) affected only by cultivar (Tables 1 and 2), which explained most of the variation for this trait (0·776 in 2003 and 0·695 in 2004) (data not shown). Across N application rates, the mean grain-filling duration was significantly (P<0·01) higher for the wheat cultivar Centauro (38·8 and 38·6 days in 2003 and 2004, respectively), which exceeded that of spelt by at least 6 days. In spelt, grain-filling duration ranged from 25·5 days (Ressac) to 33·2 days (Cosmos) in 2003 and from 29·5 days (Poème) to 32 days (Ressac) in 2004. When only spelt cultivars were included in the analysis, time to maximum weight was negatively correlated with mean filling rate (r=−0·642, P<0·05) and positively with time to maximum filling rate (r=0·861, P<0·01). Moreover, time to maximum weight was negatively correlated with DMT (r=−0·675, P<0·05) and DMTE (r=−0·674, P<0·05). No significant correlations were detected between time to maximum weight and predicted spike weight (r=−0·122) or actual spike weight (r=0·014).
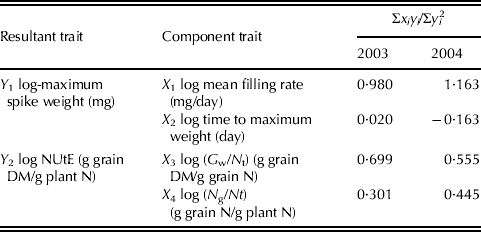
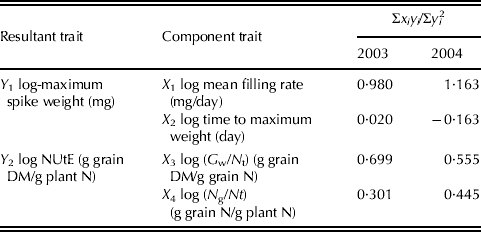
Averaged over treatments, the maximum spike weight calculated by the model was significantly (P<0·05) higher in 2003 than in 2004 (2458 v. 2059 mg). The predicted maximum spike weight was affected significantly (P<0·01) by cultivar in both years and N application (P<0·05) only in 2004, while the N×C interaction was not significant (Tables 1 and 2). Cultivar differences explained the highest proportion of the variation observed in maximum spike weight (0·615 in 2003 and 0·637 in 2004), while the corresponding contribution of N application was small (0·025 in 2003 and 0·079 in 2004). The wheat cultivar Centauro showed the highest maximum spike weight in both years. Among spelt cultivars, Poème had higher maximum spike weight compared with Ressac and Cosmos. The mean filling rate accounted for almost all the variation in maximum spike weight among spelt cultivars (Table 3). Averaged over cultivars, N application increased maximum spike weight significantly (P<0·05), by 11·5%, in 2004 but showed no significant effect in 2003.
Contribution of the component trait to the resultant trait of three spelt cultivars grown in 2003 and 2004
The values of maximum filling rate and mean filling rate calculated by the model were significantly (P<0·05) higher in 2003 than those obtained in 2004 (Tables 1 and 2). Nitrogen application increased the mean filling rate only in 2004 (from 58·145 mg/day at 0 kg N/ha to 68·820 mg/day at 100 kg N/ha), while it had no significant effect on maximum filling rate in either year. Cultivar showed a significant (P<0·01) effect on both filling rates. Actually, 0·54 of the variation in maximum filling rate and 0·792 of the variation in mean filling rate was explained by the differences among cultivars in 2003. The corresponding values for 2004 were 0·407 and 0·409, respectively. The highest values for both filling rates were obtained by Ressac in 2003 and Poème in 2004. In spelt cultivars, mean filling rate was correlated positively with the maximum filling rate (r=0·943, P<0·01), predicted spike weight (r=0·835, P<0·01) and DMT (r=0·634, P<0·05), and negatively with time to maximum weight (r=−0·642, P<0·05).
Thousand grain weight was affected significantly (P<0·01) by cultivar, while N application had no significant effect in either year. In 2003, the thousand grain weight of spelt cultivars was similar to that of wheat, except for Ressac, which had the lowest grain weight. In 2004, only the spelt cultivar Poème showed comparable thousand grain weight with that of wheat, while in Ressac and Cosmos the values of grain weight were significantly (P<0·05) lower. The thousand grain weight was correlated significantly with time to maximum weight (r=0·673, P<0·01).
Biomass production efficiency
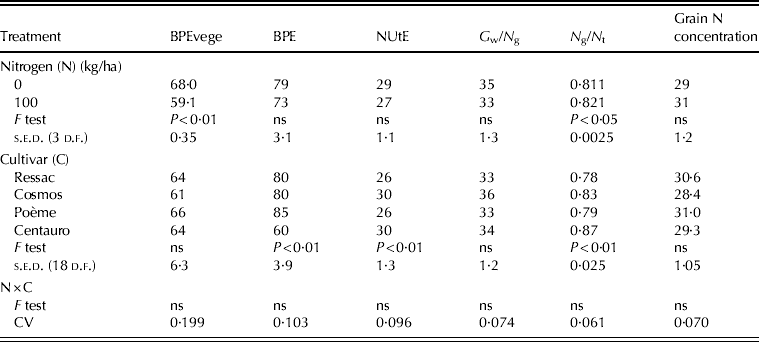
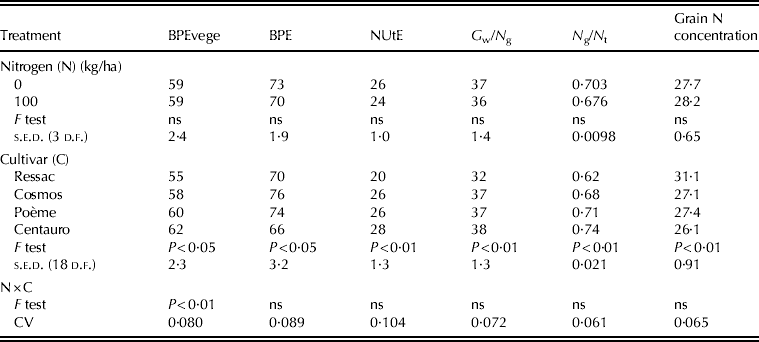
The values of biomass efficiency parameters calculated in the present study are given in Tables 4 and 5. In spelt, both BPEvege and BPE were higher in 2003 than in 2004. Spelt cultivars showed higher values of BPE compared with those of BPEvege in both years. Nitrogen application tended to reduce BPEvege and BPE, but the differences were significant (P<0·01) only for BPEvege in 2003. Across N application rates, cultivars showed similar mean BPEvege in 2003. In contrast, in 2004 the response of cultivars with respect to BPEvege depended on N application, as indicated by the significant (P<0·01) N×cultivar interaction. Cultivars had similar BPEvege when grown without N application, while when N was applied the wheat cultivar Centauro showed the highest value (66·67 kg DM/kg N) and the spelt cultivar Ressac the lowest value (52·155 kg DM/kg N) of BPEvege (data not shown). Only cultivar affected BPE significantly (P<0·01 in 2003 and P<0·05 in 2004). Across N application rates, spelt cultivars showed generally higher mean BPE compared with wheat.
Mean values for modified biomass production efficiency (BPEvege) at anthesis (g vegetative DM/g plant N), biomass production efficiency (BPE)(g plant DM/g plant N), nitrogen utilization efficiency (NUtE) (g grain/g plant N), grain yield per unit grain N (G w/N g)(g grain DM/g grain N), nitrogen harvest index (N g/N t)(g grain N/g plant N) and grain nitrogen concentration (g/kg) of spelt (Ressac, Cosmos and Poème) and bread wheat (Centauro) plants as affected by N application and cultivar in 2003
ns=non-significant.
Mean values for modified biomass production efficiency (BPEvege) at anthesis (g vegetative DM/g plant N), biomass production efficiency (BPE)(g plant DM/g plant N), nitrogen utilization efficiency (NUtE) (g grain/g plant N), grain yield per unit grain N (G w/N g)(g grain/g grain N), nitrogen harvest index (N g/N t)(g grain N/g plant N) and grain nitrogen concentration (g/kg) of spelt (Ressac, Cosmos and Poème) and bread wheat (Centauro) plants as affected by N application and cultivar in 2004
ns=non-significant.
Nitrogen utilization efficiency
Averaged over treatments, NUtE was similar across years (27·57 g grain/g plant N in 2003 and 25·02 g grain/g plant N in 2004), while G w/N g was significantly (P<0·05) higher in 2004 (36·138 g grain/g grain N) than in 2003 (33·76 g grain/g grain N) (Tables 4 and 5). The opposite was observed for N g/N t, which was higher in 2003 (0·816 g grain N/g plant N) compared with that in 2004 (0·689 g grain N/g plant N). Significant (P<0·01) cultivar differences in NUtE were observed in both years, while N application had no significant effect. Averaged across N application rates, the wheat cultivar Centauro showed the highest mean NUtE (29·6 and 28·3 g/g N in 2003 and 2004, respectively) and the spelt cultivar Ressac the lowest (25·5 and 20·1 g/g N in 2003 and 2004, respectively). When NUtE was analysed as a function of the GY per unit grain N (G w/N g) and the ratio of grain N content to the total aboveground N content (N g/N t), differences in the contribution of each particular component to the variation among spelt cultivars in NUtE were observed (Table 3). In both years, most of the variation among cultivars for NUtE was due to the variation in G w/N g (0·699 in 2003 and 0·555 in 2004). The corresponding contribution of N g/N t was 0·301 in 2003 and 0·445 in 2004.
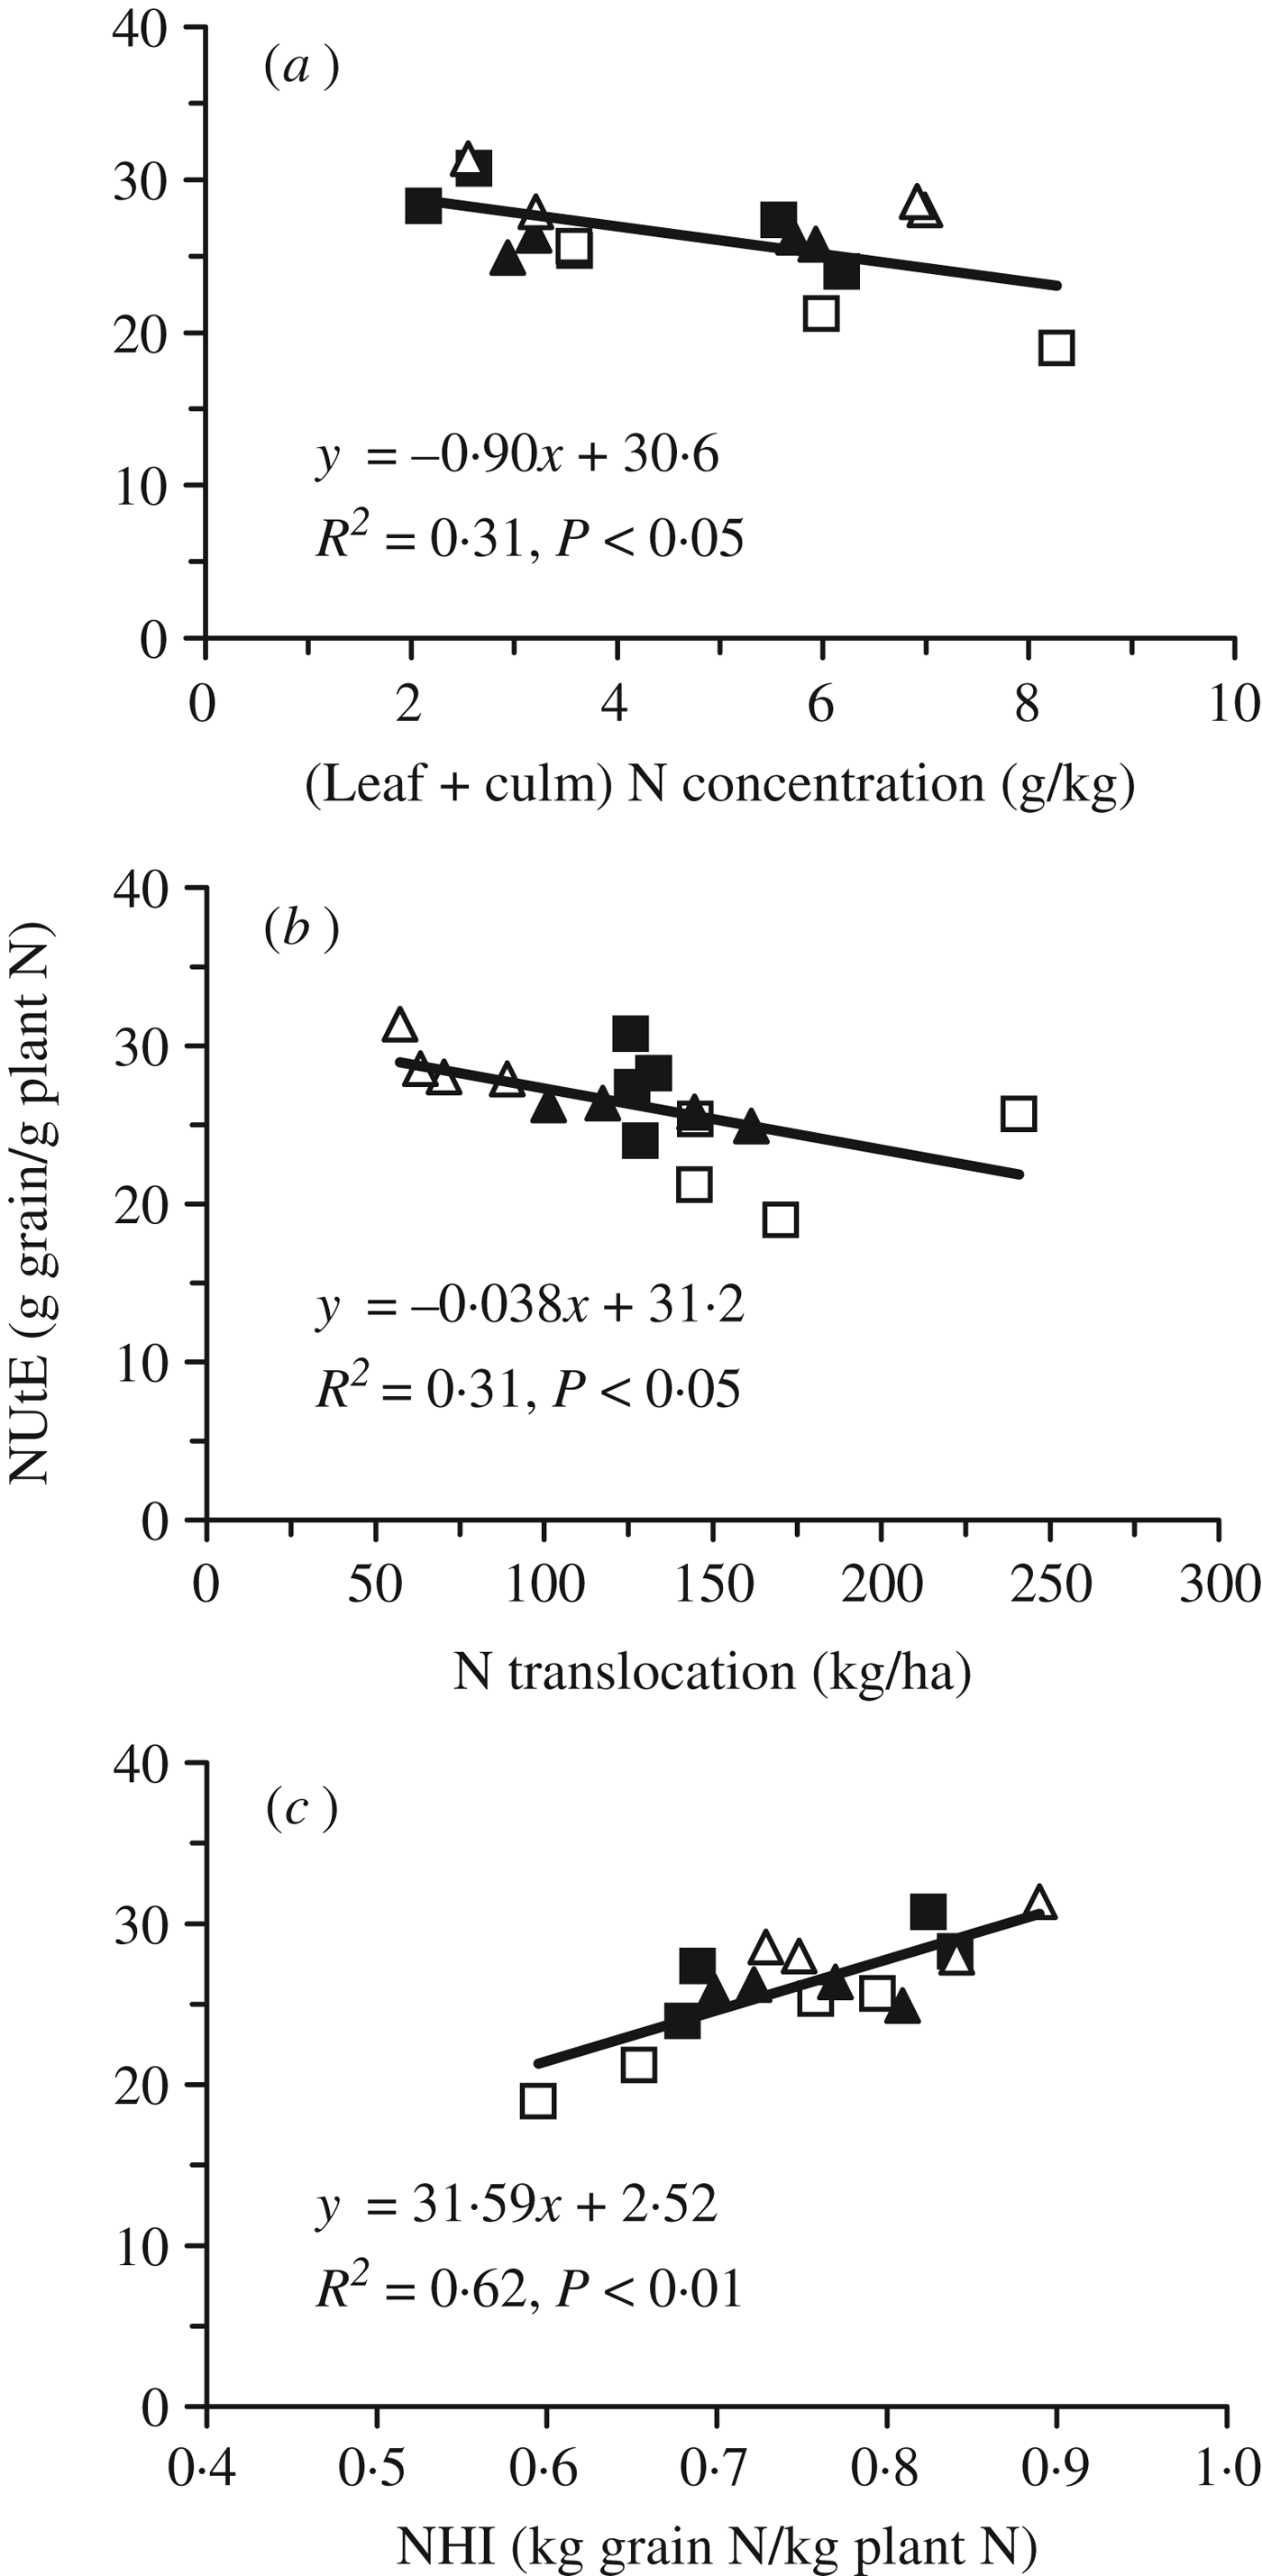
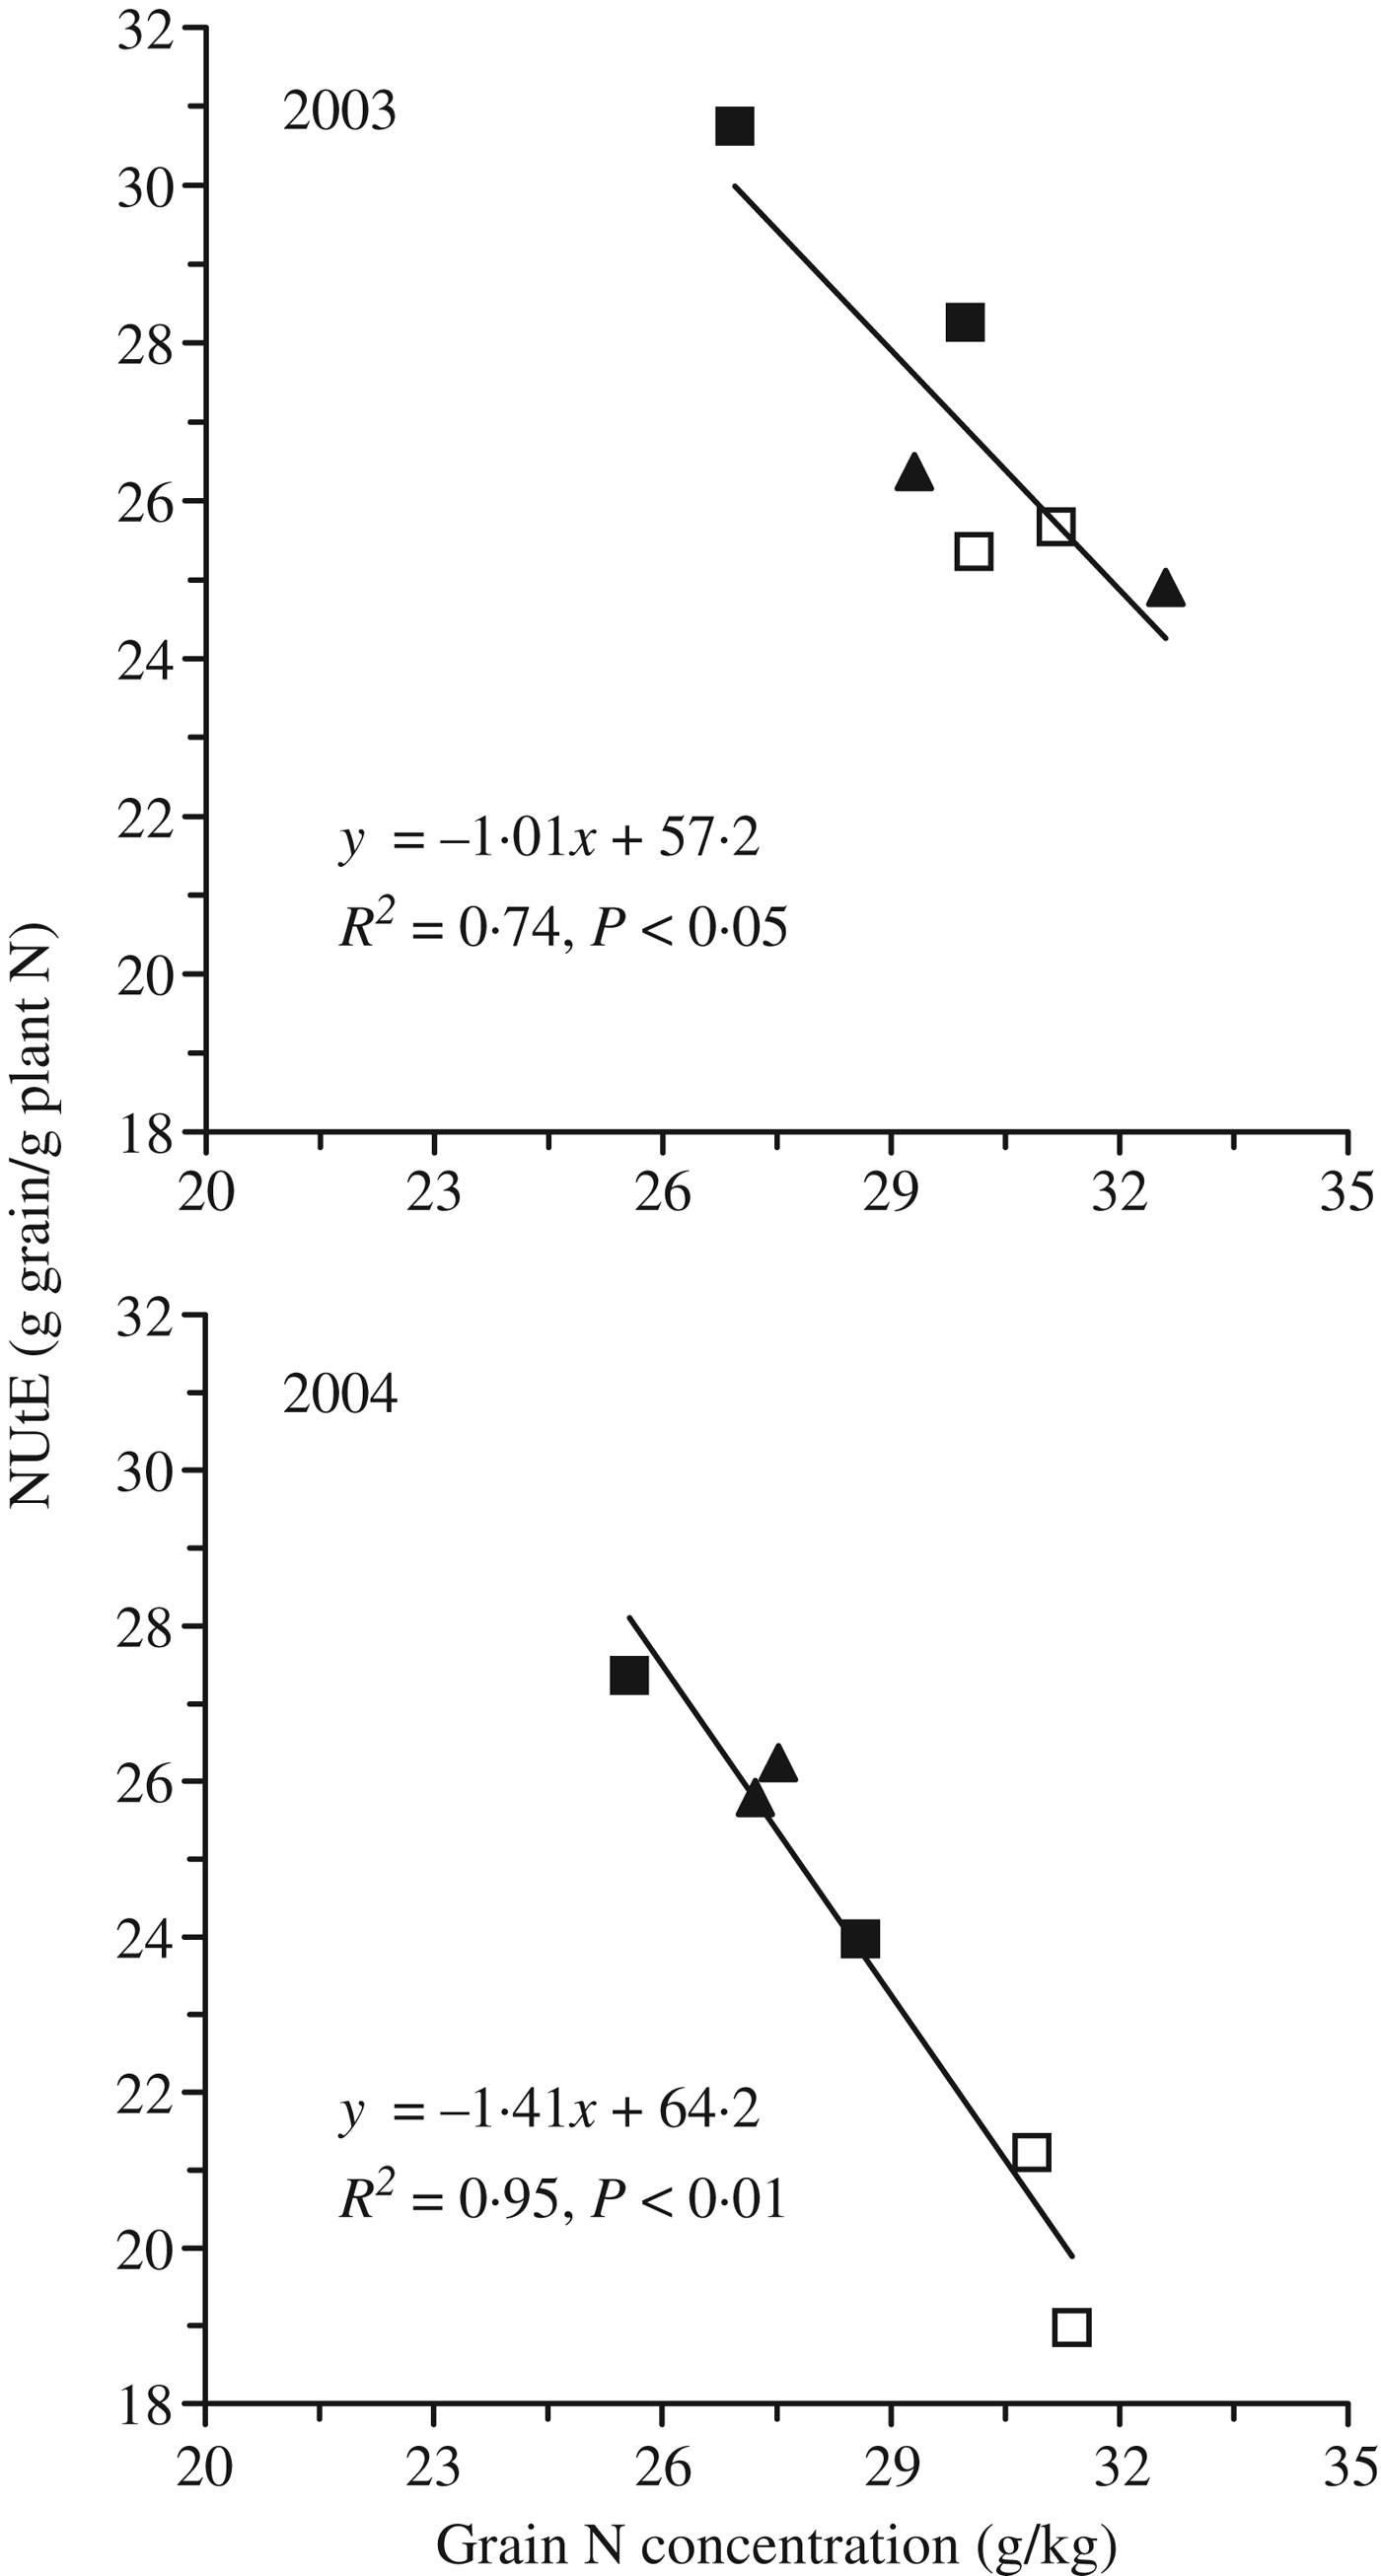
Nitrogen utilization efficiency was negatively correlated with (leaf plus culm) N concentration at maturity and NT, and positively with NHI (Fig. 3). Moreover, NUtE was negatively correlated with grain N concentration (r=−0·828, P<0·05 in 2003 and r=−0·971, P<0·01 in 2004). A similar relationship between NUtE and grain N concentration was also found when only the values of spelt cultivars were included in the analysis (Fig. 4).
Relationships between NUtE and (a) N concentration at maturity (leaf plus culm), (b) N translocation and (c) NHI for one bread wheat cultivar (Centauro, △) and three spelt cultivars (Ressac, □; Cosmos, ■; and Poème, ▲). Each relationship was based on means derived from the combination of four cultivars, two N application rates and two years of experimentation, n=16).
Relationships between grain N concentration at maturity and NUtE for three spelt cultivars (Ressac, □; Cosmos, ■; and Poème, ▲) grown in 2003 and 2004. Each relationship was based on means derived from the combination of three cultivars and two N application rates, n=6).
DISCUSSION
Grain-filling parameters
The determination of grain-filling parameters, such as duration and rate, is considered important for understanding the adaptation and yielding ability of a grain crop to a given environment. Several mathematical models have been used to describe the grain growth of various field crops. In the present study, the cubic polynomial model was used to estimate final spike weight, grain-filling rate and grain-filling duration of spelt grown under Mediterranean conditions. The cubic polynomial curve provided a good fit to the grain-filling data of all spelt cultivars in both years of the study, with high coefficients of determination (R 2). Additionally, the predicted maximum spike weight was found to be highly correlated with the actual values of spike weight, indicating that the predicted values of the model can be used accurately for estimates of the field results. The cubic polynomial model has been successfully used to describe the grain growth in many crops, such as rice (Jones et al. Reference Jones, Peterson and Geng1979), wheat (Gebeyehou et al. Reference Gebeyehou, Knott and Baker1982), barley (Leon & Geisler Reference Leon and Geisler1994) and safflower (Koutroubas & Papakosta Reference Koutroubas and Papakosta2010). However, this mathematical model is limited in that it tends to be predictive of the specific data set. The concept can be used elsewhere, but the actual model parameters usually cannot.
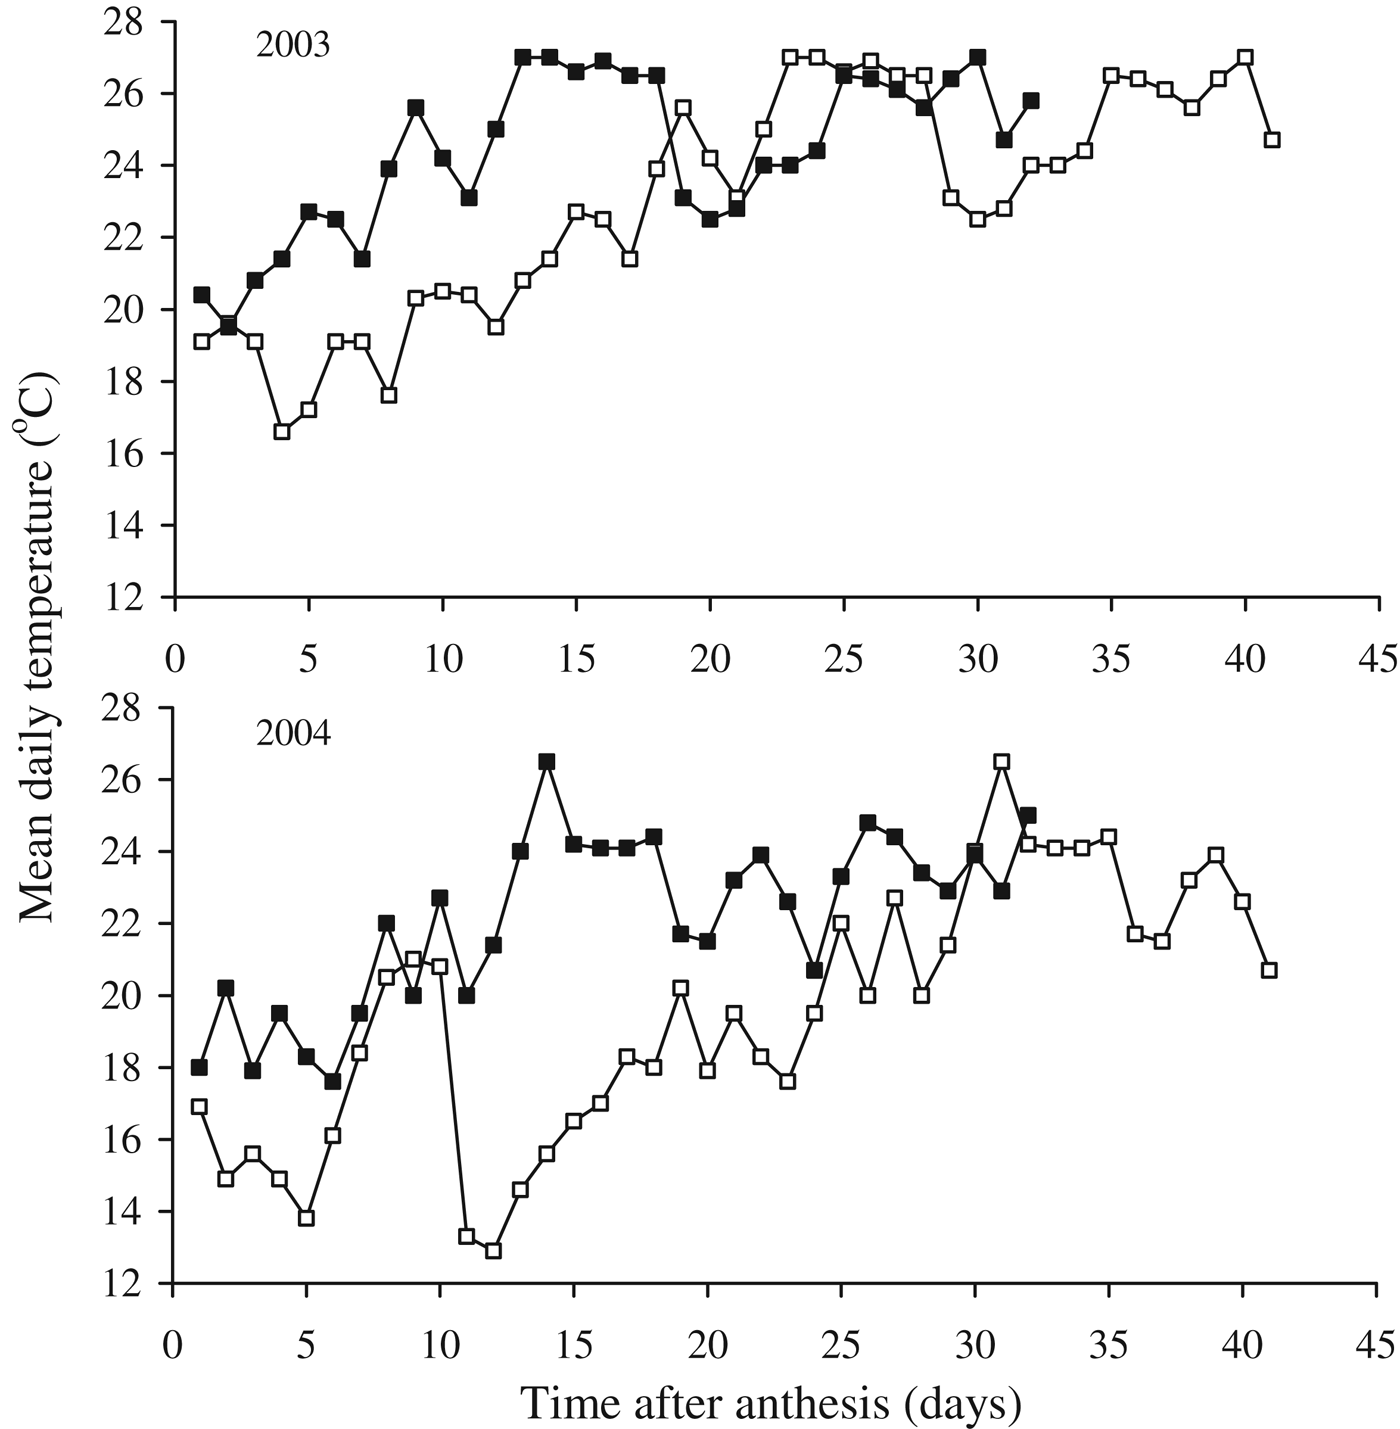
Cultivar differences were found for all grain-filling parameters studied. These differences accounted for most of the variation observed within each particular grain-filling component in both years. The predicted time to maximum spike weight, as calculated by the model, was used as an estimation of the grain-filling duration. Spelt showed shorter grain-filling duration compared with wheat in both years. The potential grain-filling duration is determined by the genetic composition of a cultivar, but the actual length is determined by the environment (Egli Reference Egli2004). Temperature during the post-heading period is considered to be one of the most important environmental factors affecting grain filling (Hunt et al. Reference Hunt, Van Der Poorten and Pararajasingham1991; Dias & Lidon Reference Dias and Lidon2009). In the present study, anthesis of spelt occurred at the end of May, 10–16 days later than wheat (Koutroubas et al. Reference Koutroubas, Fotiadis and Damalas2012). This means that spelt plants were subjected to higher temperatures during the grain-filling period than those of wheat. Indeed, mean daily temperature between anthesis and predicted time to maximum spike weight was on average 23·3 °C for spelt, which was 2·1 °C higher than that recorded for wheat (21·2 °C) (Fig. 5). Therefore, the short filling duration of spelt cultivars was probably a consequence of the high temperature during the grain-filling period. A shortage of grain-filling duration between 2·2 and 3·1 days per 1 °C increase in the mean daily air temperature during grain filling has been reported in wheat (Wiegand & Cuellar Reference Wiegand and Cuellar1981; Tewolde et al. Reference Tewolde, Fernandez and Erickson2006). To moderate the negative effect of temperature on grain filling and lengthen the grain-filling duration of spelt grown under Mediterranean conditions, early-flowering cultivars are required.
Daily mean temperature during the grain-filling period of spelt (closed symbols) and wheat (open symbols) in 2003 and 2004.
The short grain-filling duration of spelt had a more pronounced effect on individual grain weight, a fact that was confirmed by the positive correlation found between the two traits. Similar associations between grain-filling duration and grain weight have been reported in cereals (Gebeyehou et al. Reference Gebeyehou, Knott and Baker1982; Yang et al. Reference Yang, Peng, Dionisio-Sese, Laza and Visperas2008). The mean thousand grain weight of spelt reached up to 39·8 g, a value that is quite low when compared with those reported in other studies. Zanetti et al. (Reference Zanetti, Winzeler, Feuillet, Keller and Messmer2001) reported values of thousand grain weight between 40 and 55·2 g, and Pospišil et al. (Reference Pospišil, Pospišil, Svečnjak and Matotan2011) found values between 49·7 and 57·7 g depending on cultivar and year. Rüegger et al. (Reference Rüegger, Winzeler and Nösberger1990) found that the single grain weight of spelt was higher than that of wheat. The low grain weight of spelt observed in the present study suggests that spelt did not achieve its potential grain weight. This was probably due to the short grain-filling period, which was induced by the high temperatures and water stress after anthesis, since the benefit from small rain events recorded during grain filling was limited (Koutroubas et al. Reference Koutroubas, Papakosta and Doitsinis2004). Another factor that may have contributed to the low grain weight of spelt was the lodging of the plants that occurred during the grain-filling period. The lowest grain weight was found in cultivar Ressac, which was the spelt cultivar that showed the highest degree of lodging in the present study. The short grain-filling duration of spelt was accompanied by increased grain-filling rate compared with wheat, suggesting that compensation between the two variables took place. This is also supported by the negative correlation found between grain-filling rate and duration. Negative correlation between rate and duration of grain filling has been reported in various plant species (Le Gouis Reference Le Gouis1993; Mou et al. Reference Mou, Kronstad and Saulescu1994; Yang et al. Reference Yang, Peng, Dionisio-Sese, Laza and Visperas2008). However, the low values of grain weight obtained for spelt in the present study indicate that the influence of the short filling duration was severe enough to result in small-sized grains despite the increase in the growth rate of the grains. These results are in agreement with those reported for wheat by Tewolde et al. (Reference Tewolde, Fernandez and Erickson2006).
Grain filling in cereals depends on carbon being transferred directly to the grain from the current assimilates and on assimilates being redistributed from reserve pools in the vegetative tissues before or after anthesis (Kobata et al. Reference Kobata, Palta and Turner1992; Schnyder Reference Schnyder1993). The positive correlation between DMT and mean grain-filling rate in the present study confirms the crucial role of reserve assimilates in the vegetative tissues for the grain growth of spelt. Foulkes et al. (Reference Foulkes, Snape, Shearman, Reynolds, Gaju and Sylvester-Bradley2007) reported a positive linear relationship between stem water-soluble carbohydrate and GY in wheat. However, greater accumulation of stem water-soluble carbohydrate reserves may be beneficial, providing this does not compete with ear growth during the rapid ear-growth phase (Blum Reference Blum1998). The seasonal differences observed in the mean filling rate of grains seem to be associated with the corresponding differences in DM accumulation in the vegetative parts. In 2003, spelt plants accumulated higher DM up to anthesis compared with 2004 (Koutroubas et al. Reference Koutroubas, Fotiadis and Damalas2012). This means that more assimilates in reserve pools were available for translocation to the grain in 2003, resulting in higher grain-filling rate compared with that in 2004. The negative relationship detected between DMT and grain-filling duration could be explained by taking into account the physiological and environmental parameters involved in the grain-filling process. When plants are subjected to various stresses during the grain-filling period, current photosynthesis decreases, DMT increases and the grain-filling period is shortened (Papakosta & Gagianas Reference Papakosta and Gagianas1991; Kumudini et al. Reference Kumudini, Hume and Chu2002). Thus, the negative association between DMT and grain-filling duration probably resulted from the negative link between DMT and photosynthesis, and the impact of the latter on grain-filling duration.
Cultivar and seasonal differences in spike weight were observed. Mean filling rate was found to account for almost all the variation observed among the spelt cultivars for maximum spike weight. Wheat showed a higher value of maximum spike weight than spelt, suggesting a greater yielding ability under the conditions of these experiments compared with spelt. Several studies have shown that common wheat out-yields spelt under high input conditions (Rüegger & Winzeler Reference Rüegger and Winzeler1993; Stallknecht et al. Reference Stallknecht, Gilbertson, Ranney and Janick1996; Bertin et al. Reference Bertin, Grégoire, Massart and De Froidmont2001). The higher spike weight observed in 2003 resulted from the higher filling rate compared with 2004, because the time to maximum spike weight was similar across years.
Nitrogen utilization efficiency and biomass production efficiency
Various environmental factors during crop growth, such as temperature, solar radiation and precipitation have been reported to influence nutrient availability in the soil and the ability of plants to acquire and utilize nutrients (Baligar et al. Reference Baligar, Fageria and He2001). In the present study, the influence of the environment on N absorption and utilization is reflected in the seasonal differences found for the NUtE and BPE parameters. The more favourable spring temperatures in 2004 contributed to better plant growth than that in 2003, which was accompanied by increased N accumulation (Koutroubas et al. Reference Koutroubas, Fotiadis and Damalas2012). However, the increase observed in N accumulation was proportionally higher than that in DM, resulting in less biomass production per unit plant N (e.g. BPEvege and BPE) in 2004 than in 2003.
In spelt, the values of BPEvege were found to be lower than those of BPE. This means that the efficiency of plants in utilizing N to produce biomass during the grain-filling period was higher compared with that of the vegetative growth period. However, the values of BPE may be overestimated due to the N losses detected by spelt plants between anthesis and maturity (Koutroubas et al. Reference Koutroubas, Fotiadis and Damalas2012). Nitrogen losses reduced the total plant N measured at harvest and plants may seem to have greater efficiencies than is actually the case (Dawson et al. Reference Dawson, Huggins and Jones2008). Overall, spelt cultivars showed superiority in producing aboveground biomass per unit of N as suggested by the higher values of BPE compared with wheat. This could be attributed to the better vegetative growth and the greater height of spelt plants than those of wheat, because the GY was lower compared with that of wheat. These results are in agreement with those of Singh & Arora (Reference Singh and Arora2001), who reported that tall wheat cultivars had higher BPE compared with dwarf cultivars.
Nitrogen utilization efficiency could be expressed as a function of grain production per unit grain N (G w/N g) and the ratio of grain N content to the plant total aboveground N content (N g/N t, e.g. NHI). Although seasonal differences in the NUtE components occurred, the values of NUtE were similar across years. This was due to the fact that the increased G w/N g obtained in 2004 was accompanied by a reduction in NHI compared with 2003, resulting in similar values of NUtE in the 2 years. Cultivar differences in NUtE were observed in both years and G w/N g was found to contribute more to the total variation in NUtE among spelt cultivars compared with NHI (Table 3). The differences in NUtE observed between spelt and wheat may be attributed to differences in several traits related with NUtE. In accordance with the previous reports (Bonafaccia et al. Reference Bonafaccia, Galli, Francisci, Mair, Skrabanja and Kreft2000), spelt showed an overall mean grain N concentration of 29·3 g/kg, which was higher than that observed for wheat (27·7 g/kg). Thus, the lower NUtE values of spelt seemed to derive from its higher grain N concentration, as evident by the negative correlation found between the two variables. Similar associations between NUtE and grain N concentration have been reported for wheat (Górny et al. Reference Górny, Banaszak, Ługowska and Ratajczak2011) and rice (Koutroubas & Ntanos Reference Koutroubas and Ntanos2003). As can be calculated from the linear equation relating the NutE and grain N concentration in the present study, when the concentration of grain N in spelt decreased by 1 g/kg (1%), NUtE increased by only 1·01 g grain/g N in 2003 and 1·41 g grain/g N in 2004 (Fig. 4). Therefore, rigorous selection for grain N concentration is required to improve NUtE, suggesting a relatively high impact of NUtE improvement on grain nutritional quality. Low grain N concentration may reduce the suitability for milling markets, but represents a useful mechanism for increasing NUtE where the grain is primarily used as an energy source, for example, in animal feed (Foulkes et al. Reference Foulkes, Sylvester-Bradley and Scott1998; Kindred & Gooding Reference Kindred and Gooding2004).
The positive correlation found between NUtE and NHI suggests that the proportion of total plant N allocated to the grains at maturity was an important factor contributing to the formation of NUtE. This result is consistent with observations reported previously for other crops (Koutroubas et al. Reference Koutroubas, Papageorgiou and Fotiadis2009; Rahimizadeh et al. Reference Rahimizadeh, Kashani, Zare-Feizabadi, Koocheki and Nassiri-Mahallati2010) and indicates that the higher NUtE of wheat may be due to its higher NHI compared with spelt. High NUtE has also been attributed to better N translocation from the vegetative parts to the grain during the filling period (Delogu et al. Reference Delogu, Cattivelli, Pecchioni, De Falcis, Maggiore and Stanca1998). The negative relationship observed between N translocation and NUtE in the present study did not support this hypothesis. Indeed, spelt cultivars that showed higher N translocation compared with wheat (Koutroubas et al. Reference Koutroubas, Fotiadis and Damalas2012) had lower NUtE, probably because of the lower GY. It seems that in spelt, N translocation contributed to the increased grain N concentration, but it was not utilized to produce more GY, resulting in low NUtE. An indicator of improved NUtE in spelt may be the low straw N concentration at maturity, as evidenced by the negative relationship detected between the two variables (Fig. 3). Negative correlations between leaf and straw N concentration at maturity and NUtE have also been reported in rice by Swain et al. (Reference Swain, Bhaskar, Krishnan, Rao, Nayak and Dash2006), who concluded that the N content in plant organs could be the selection guide used to obtain efficient varieties.
In conclusion, the results of the present study indicated that the environment influenced both the duration and the rate of grain filling in spelt, as reported previously for other small grain cereals under Mediterranean conditions. Grain filling of spelt plants took place under high temperatures that led to a shortening of the grain-filling duration, which was not compensated by the increase in the grain-filling rate and eventually resulted in a reduction of final grain weight. To moderate the effect of the environment on grain filling and improve the adaptation of spelt under Mediterranean conditions, early-flowering cultivars are required. As for utilization of N, spelt showed higher BPE, but lower NUtE than wheat. Significant correlations between NUtE-related parameters and plant traits were detected. These results provide a better understanding of factors related with the adaptation, yielding ability and N utilization of spelt under Mediterranean conditions.
The authors are grateful to Dr Adrien Dekeyser, Centre de Recherches Agronomiques de Gembloux, Belgium for providing spelt seeds.