


Introduction
Mostly driven by the objective of lowering their carbon emissions, many European countries have increased their share of renewable energy production. For instance, in the 2005–2023 interval, the share of energy consumption from renewables in the European Union (EU) increased more than twofold, from 10.2% to 24.5% (European Environmental Agency 2025). Meanwhile, in the same period, the share of electricity consumption from renewables in the EU rose to 45.3%, with hydropower and wind energies accounting for two thirds of renewable energy provision (Eurostat 2025).
Despite these historically large deployments, the current rate of expansion of renewables is still lagging behind targets to reach emission goals. Not only is the current rate of expansion insufficient, but it has already generated some resistance and a fair amount of citizen backlash (Bosetti et al. Reference Bosetti, Colantone, De Vries and Musto2025; Milani et al. Reference Milani, Dessi and Bonaiuto2024). Considering that renewable energy deployment is increasingly contested but that its growth rate still needs to at least triple to align with 2050 net-zero emissions scenarios (Luo et al. Reference Luo, Sahadevan, Irfan, Moyer, Mason and Beynon2025, p. 15), the tension between citizen backlash and pressures to accelerate the deployment of renewable energy is only likely to grow.
We seek to contribute to a better understanding of citizens’ attitudes towards renewable energy deployment in two ways. First, we disentangle different types of renewable energy infrastructures. Indeed, in the eyes of citizens, not all renewables are equal, and some are preferrable to others. Second, the renewable energy question combines two issues: an “energy” issue and a “renewable” issue. Whilst the renewable issue relates to sustainability and decarbonization, the energy issue is much wider (e.g., Thaler and Hofmann Reference Thaler and Hofmann2022) and can be linked to broader concerns related to a country’s energy self-sufficiency, independence, sovereignty, or security, as well as economic concerns of price stability and industrial competitiveness.
To disentangle these dimensions, we implement a survey experiment assessing citizen attitudes towards three types of renewable energies: hydropower, onshore wind, and offshore wind. To evaluate different framing effects, we couch renewable deployment in terms of a strictly “energy” question to which we randomly assign an energy sovereignty attribute (with security and independence characteristics), an economic competitiveness attribute (with economic strength, price stability, and industrial competitiveness characteristics), and finally an additive green shift attribute (with climate change mitigation and renewable energy characteristics). This design enables us to evaluate the impact of adding a green dimension to a policy choice otherwise framed in strict energy terms, be it with an energy sovereignty or an economic competitiveness dimension (and a null framing as reference point). This design also enables us to assess whether these framing effects are homogenous across types of renewable energies.
Furthermore, building on the knowledge that climate questions are perceived differently by various groups within the citizenry (e.g., Barrez Reference Barrez2025), we analyze possible heterogenous effects regarding two types of citizens: those who worry less about climate change and those who are simultaneously rural and less-educated. Indeed, these two groups of citizens are often portrayed as most likely opposers of climate policies, either because they find these policies unjustified (in the case of the least worried by climate change) or because they feel these policies do not reflect their immediate concerns and are favoring urban élites who are perceived as dominating the policy process (in the case of the less-educated ruralites). We expect these general patterns to travel to the narrower question of renewable energy policies.
Using the case of Norway – which corresponds to a somewhat hard case for energy framing – we assess the effects of these energy sovereignty, economic competitiveness, and green shift frames. We carry out this analysis on a representative sample of adult citizens (n = 4,031) and conduct subpopulation analyses regarding the less worried by climate change and the less-educated ruralites (for a similar approach on fuel taxation, see Tatham and Peters Reference Tatham and Peters2023).
We find that traditional renewable energy infrastructures and prospective ones (hydropower and offshore wind, in the Norwegian context) benefit from most support, whilst those in the midst of proliferation are least popular (onshore wind). Framing effects are ineffective when analyzing the population as a whole. However, analyses across renewable types reveal that frames do actually affect levels of support for infrastructure where citizen preferences are more fluid (offshore wind) with skepticism towards both economic competitiveness and green shift arguments. In addition, the green shift frame significantly decreases support among the less climate-worried and among the low-educated ruralites. For these two groups, support will be higher in the absence of any green argument. In other words, if one wishes to heighten support for renewable energy infrastructure deployment, it is best to not mention anything about a green shift, climate change mitigation, or the renewable nature of these energies, as it will not increase support for the average citizen, and it will actually weaken support among the more difficult to convince: those who worry little about climate change and the less-educated ruralites. Our advice to policymakers if they wish to boost support for renewables is simple: don’t say it is green.
Renewables, framing, and a heterogenous citizenry
Climate change mitigation policies can take various forms, from fuel taxes to energy efficiency subsidies, all the way to the protection of emission sinks or the reduction of meat production. Among the array of existing policies, the expansion of renewable energy is considered a key ingredient in the policy mix to achieve net-zero goals by 2050. Renewable energies come in various forms, from tidal or wave energy to geothermal and solar energy. However, two sources dominate renewable electricity production in Europe: wind and hydro (Eurostat 2025). This article focuses on these two largest sources of renewable energy and further breaks down wind energy into its onshore and offshore variants.
Renewable energies are met with various reactions by citizens, from opposition to indifference to support. In addition, issues can be framed to trigger both positive and negative associations to which individuals may react. Generally, framing can be understood as a process by which people reorient their thinking about issues after a particular concept or narrative has been evoked (Chong and Druckman Reference Chong and Druckman2007). Research on framing underlines both the potential and limitations of climate policy framing, with some findings uncovering little effects of such framing (e.g., Aklin and Urpelainen Reference Aklin and Urpelainen2013; Bernauer and McGrath Reference Bernauer and McGrath2016) and others highlighting that benefits framing tend to have weaker effects than costs framing (Bayulgen and Benegal Reference Bayulgen and Benegal2019). Hence, existing work on climate policy framing has generated contrasted findings.
Beyond the study of frames’ direct effects, research on climate framing suggests that not all segments of the population are equally sensitive to the same kinds of frames (e.g., Bayer and Ovodenko Reference Bayer and Ovodenko2019; Stokes and Warshaw Reference Stokes and Warshaw2017). There might be variation within the citizenry in terms of who is responsive to what, i.e., which group reacts to what kind of frames. For example, studying the effect of framing in marginal constituencies in the UK, Lockwood (Reference Lockwood2011) found that support was higher for expanding renewable energy if framed in terms of providing energy security as opposed to connecting it to climate change or economic opportunities, although mentioning climate change still gathered more support than mentioning economic opportunities. Lockwood (Reference Lockwood2011, p. 1110) also found that particular subpopulations (in this case: women, younger respondents, or Labour and Lib-Dem sympathizers) responded much more strongly than other groups. Similarly, Gainous and Merry (Reference Gainous and Merry2022) have shown that different frames on climate change conceived as a national security issue have varying impacts on citizens, with a frame centered on energy dependence having the strongest effect, but that this effect actually ran in opposite directions according to partisan preferences (i.e. Democrats vs Republicans) hence highlighting deeply heterogenous framing effects.
These findings, as well as numerous others (e.g., Benjamin et al. Reference Benjamin, Por and Budescu2017), stress that the effect of various frames can be conditioned by respondent-specific characteristic, such as their beliefs or preferences, or even by their socio-economic circumstances. This article assesses the conditional effects of the proposed frames for two groups typically critical of climate policies: (a) those who feel less worried by climate change and (b) the less-educated ruralites, also sometimes likened to the “yellow vests,” as a reference to the French social movement which drew its citizens from the lower middle classes, often characterized by lower education and rural residence, in contrast to high-educated urbanites (Kipfer Reference Kipfer2019; Martin and Islar Reference Martin and Islar2021).
The least worried and the less-educated ruralites
These two groups of citizens, though distinct from one another, have drawn an increasing amount of academic interest when studying attitudes towards climate policies. Climate worry can be considered as an emotional state related to fear or anxiety about the consequences of climate change which are associated with damage, loss, or destruction and potentially causing existential angst and psychological distress (Ojala et al. Reference Ojala, Cunsolo, Ogunbode and Middleton2021). Bouman et al. (Reference Bouman, Verschoor, Albers, Böhm, Fisher, Poortinga, Whitmarsh and Steg2020) have found that Europeans who worry about climate change are likely to feel a greater sense of personal responsibility to reduce climate change and that they are more likely to support climate policies. In a comprehensive study, Smith and Leiserowitz (Reference Smith and Leiserowitz2014) compare the effect of 10 types of emotions (worry, interest, disgust, hope, helplessness, anger, sadness, fear, depression, and guilt) on a climate policy support indicator including 9 items (from preferences for renewable energy funding all the way to a fuel tax). They found that worry regarding climate change was not only correlated with the 9 other types of climate emotions (mean r = 0.50) but was also the strongest predictor of support on the 9-item climate policy measure, outperforming rival explanations related to party identification, political ideology, or gender, as well as all the other emotional reactions to climate change.
Climate worry is also an indicator which correlates well with more sophisticated measures of climate attitudes. Refined research using latent class methods tends to classify citizens into a handful of groups based on models relying on up to dozens of climate indicators. For instance, Barrez (Reference Barrez2025) uses 6 indicators of climate attitudes to classify Belgian respondents in 5 groups (alarmed, concerned, cautious, disengaged, and doubtful). Kácha et al. (Reference Kácha, Vintr and Brick2022) use 12 ESS indicators to divide citizens into 4 groups (engaged, pessimistic, indifferent, and doubtful), whist Leiserowitz et al. (Reference Leiserowitz, Roser-Renouf, Marlon and Maibach2021) use 36 measures of global warming beliefs, policy preferences, behaviors, and issue involvement to identify 6 groups of Americans (alarmed, concerned, cautious, disengaged, doubtful, dismissive). In these studies, indicators of climate worry are tightly associated with the more skeptical respondents. In this sense, although somewhat parsimonious and simplistic, climate worry seems to be a useful indicator to sort the more skeptical citizens from the rest, despite climate worry clearly being only one dimension of a more complex latent construct (Barrez Reference Barrez2025; Kácha et al. Reference Kácha, Vintr and Brick2022; Leiserowitz et al. Reference Leiserowitz, Roser-Renouf, Marlon and Maibach2021). Indicators of worry have therefore increasingly been used to predict energy preferences, including support for renewable energies (Arndt Reference Arndt2023; Lorteau et al. Reference Lorteau, Muzzerall, Deneault, Kennedy, Rocque, Racine and Bureau2024).
In this article, we assess how those who worry least about climate change react to different renewable types and different frames. Whilst those worried about climate change are easier to convince about the necessity of renewables expansion (a “preaching to the choir” effect), the less worried may well be more difficult to convince. It then becomes interesting to understand under what conditions this group of citizens may be more or less supportive of the deployment of further renewable energy infrastructure. We generally expect that the less worried will exhibit lower levels of support for renewables, but that they will react positively to non-green frames and negatively to a green frame. We outline these expectations in formal hypotheses in the sections below.
The second group of citizens often critical towards climate policies corresponds to the less-educated ruralites. Higher-educated citizens have been found to have more pro-environmental attitudes, to be more likely to support climate policies, and also more likely to accept renewable energy deployment (Beiser-McGrath and Huber Reference Beiser-McGrath and Huber2018; Segreto et al. Reference Segreto, Principe, Desormeaux, Torre, Tomassetti, Tratzi, Paolini and Petracchini2020). Research also highlights that education may not only have a direct effect but also a conditioning effect when interacted with other individual or policy characteristics (Hamilton Reference Hamilton2011; Harring and Jagers Reference Harring and Jagers2018). In a similar way to education, urban citizens are more likely to support climate policies than their rural counterparts (Borwein et al. Reference Borwein, Lucas, Romualdi, Taylor, Armstrong and McCoy2025; Howe et al. Reference Howe, Mildenberger, Marlon and Leiserowitz2015). A study across 186 West European regions has highlighted that individuals in rural areas (who often fear income losses and reduced purchasing power) are less supportive of climate change policies and that contexts of poverty and high unemployment (often elevated in rural areas) magnify opposition (Arndt et al. Reference Arndt, Halikiopoulou and Vrakopoulos2023). This rural-urban divide does not necessarily hold across the board and is stronger for some policies than for others. For instance, there are marked rural-urban differences regarding attitudes towards individual mobility (car taxation) or diet (vegetarianism), whilst other policies are unaffected by such a divide (e.g., ban on short flights) (see Tallent Reference Tallent2025).
The intersection of rurality and lesser education often resonates with concepts such as the “left behind” or “losers of globalization.” These concepts designate a segment of the population which feels its interests are too often overlooked, that they are neglected by the political establishment, and that they are not reaping the benefits from existing policies or economic growth (Lockwood Reference Lockwood2018). These “forgotten-ones” also dominated the yellow vest movement (Kipfer Reference Kipfer2019; Martin and Islar Reference Martin and Islar2021). The yellow vests was one of the most prominent social movements against a climate policy (a fuel tax increase) in one of the largest European countries (France), the logic of which has had echoes in other European countries (see Ortiz et al. Reference Ortiz, Burke, Berrada and Saenz Cortés2022: they identify protest movements explicitely inspired by the yellow vests in Ireland, Germany, Italy, and Canada, see their country-specific Annex C). Similarly to the least worried about climate change, it is analytically interesting to understand under what conditions this group of citizens may be more or less supportive of the deployment of further renewable energy infrastructure. We generally expect that the less-educated ruralites will exhibit lower levels of support for renewables and that they will react positively to non-green frames and negatively to a green framing.
In the sections below, we express our main expectations. In line with the above literature, we expect differentiated effects for the least climate-worried and less-educated ruralites.
Expectations – direct and conditional effects
We spell out expectations regarding renewable energy types and framing effects, as well as conditional expectations regarding the less climate-worried and the less-educated ruralites.
Types of renewable energy
Although the energy narrative often pits renewable energy sources against non-renewable ones, not all renewable energies are alike. Research highlights variation in the levels of support (and determinants thereof) for various renewables (Arndt Reference Arndt2023; Karlstrøm and Ryghaug Reference Karlstrøm and Ryghaug2014). There is not only variation across different energy types but also over time as renewables proliferate (or not) in a given country.
For instance, some literature outlines evidence for a 3-phase U-shaped acceptance curve, depicting initial enthusiasm, followed by recalcitrance and opposition, finally morphing into growing levels of acceptance (le Maitre et al. Reference le Maitre, Ryan and Power2024). This U-shaped conceptualization of support for the deployment of renewables varies in its precise operationalization, especially in terms of the different inflection points in the curve. For instance, Wolsink (Reference Wolsink2007) underscores how attitudes towards wind power can evolve from positivity prior to any concrete project announcement to criticism when a project is announced and being built to positivity again “some reasonable time after the construction” (2007, p. 1197). Of course, defining how long is a “reasonable time after the construction” is mostly an empirical question. However, pre/post studies have argued that some differences can be visible a decade and a half after construction. In an analysis of wind acceptance in Cornwall, Eltham et al. (Reference Eltham, Harrison and Allen2008) compared 1991 and 2006 attitudes towards a local windfarm and detected some changes in residents’ opinions regarding the positive impacts of the wind farm (2008, p. 27–9, changes regarding general views and negative impacts were insignificant). Another Cornish study considered a contested windfarm over the 2002–2013 interval and found stronger effects than in Eltham et al. (Reference Eltham, Harrison and Allen2008), documenting “that community opinion changes considerably over time (…) and that attitudes have generally become more favourable” (Wilson and Dyke Reference Wilson and Dyke2016, p. 287).
Building on these studies and others (e.g., le Maitre et al. Reference le Maitre, Ryan and Power2024), we propose a slightly different conceptualization of the U-shaped acceptance curve. We distinguish between renewable energies at three phases: (a) a still-prospective phase with few or no infrastructures built, (b) a midst-of-proliferation phase when the technology has already been upscaled and is in the thick of expansion, and (c) a generations-long established phase where propagation has already taken place some decades ago and is in a phase of consolidation, upgrade, and limited expansion. Which renewable is classified in each of these three phases is country-dependent, as technology has diffused differently in different countries and at various timepoints. We explain in the section on the case of Norway which renewable fits in which category in our case study. But in short, in Norway, the renewable in its prospective phase is offshore wind (start of operations planned around 2031), the midst-of-proliferation renewable is onshore wind (dramatic deployment in the late 2010s), and the long-established renewable is hydropower (large deployments in the 1950s–80s).
Following this U-shaped acceptance curve of renewable energies, we expect citizens to be more supportive of still-prospective and long-established renewables (offshore wind and hydropower, in this case) and less supportive of renewables in the midst of proliferation (here, onshore wind). Based on the above review of the least worried by climate change and of the low-educated ruralites, we expect these effects to be more marked among these two groups.
H1. Types of renewables
H1a. Citizens are more supportive of long-established or still-prospective renewable energies and less so of midst-of-proliferation renewables
H1b. The more so if they are less worried about climate change
H1c. The more so if they are less-educated ruralites (i.e., yellow vest profile)
Of course, we do not expect this U-shaped acceptance curve to alone determine citizen preferences towards renewables. Many factors affect these preferences, such as land-use and planning conflicts, negative externalities on nearby activities (tourism industry, agriculture, fishing, recreational activities), fauna and flora destruction, visual or acoustic discomforts for local residents, esthetic considerations, or more prosaically the market value of surrounding properties (e.g., Gibbons Reference Gibbons2015; Jikiun et al. Reference Jikiun, Tatham and Myrseth Oltedal2023; Roddis et al. Reference Roddis, Carver, Dallimer, Norman and Ziv2018). However, based on case study evidence, we expect a clear and detectable impact of development phase on acceptance, following a somewhat U-shaped curve (Eltham et al. Reference Eltham, Harrison and Allen2008; le Maitre et al. Reference le Maitre, Ryan and Power2024; Wilson and Dyke Reference Wilson and Dyke2016; Wolsink Reference Wolsink2007).
Energy sovereignty and economic competitiveness
Energy narratives often emphasize the needs of a country in terms of (a) guaranteeing energy independence and of (b) fulfilling the demands of various domestic industries. Regarding the first point, energy sovereignty often refers to a nation’s ability to control its energy resources and ensure a self-sufficient energy supply, hence also increasing the country’s energy security (Wetzel et al. Reference Wetzel, Gils and Bertsch2023). The concept has gained salience in the context of recent global geopolitical instabilities (e.g., Russian invasion of Ukraine) and the ensuing fluctuations in energy prices. Building renewable energy infrastructure can enhance energy sovereignty by utilizing domestically available resources (such as wind and water), thus reducing the overall dependence on imported energy and diversifying the domestic energy mix (Scholten and Bosman Reference Scholten and Bosman2016). And indeed, studies in the UK and US have found increased support for climate policies when energy security or energy independence frames have been used (Gainous and Merry Reference Gainous and Merry2022; Lockwood Reference Lockwood2011).
Following past findings on energy sovereignty and security, we expect citizens to be more supportive of renewable energy deployments if these are framed as benefiting the country’s energy sovereignty (evoking notions of security and independence). We expect these effects to be more marked among those less worried by climate change and those combining low education and a rural residence.
H2. Energy sovereignty
H2a. Citizens are more supportive of renewable energies if these are framed as benefiting the country’s energy sovereignty
H2b. The more so if they are less worried about climate change
H2c. The more so if they are less-educated ruralites (i.e., yellow vest profile)
Regarding the second point, perceived economic benefits from expanding renewables have been highlighted as a possible way to boost public acceptance (Segreto et al. Reference Segreto, Principe, Desormeaux, Torre, Tomassetti, Tratzi, Paolini and Petracchini2020, p. 9–10). This line of argumentation mirrors studies that have found that economic or material benefits at local scales can have a positive effect on community acceptance (e.g., Knauf Reference Knauf2022). Aggregated to the national level, economic benefits for one’s country might mitigate concerns about the costs and risks associated with renewable energy investments. Building on literature highlighting the various framings of renewable energies (Segreto et al. Reference Segreto, Principe, Desormeaux, Torre, Tomassetti, Tratzi, Paolini and Petracchini2020) and the tension between its portrayal in terms of additional costs as opposed to benefits (Bayulgen and Benegal Reference Bayulgen and Benegal2019; Wolsink Reference Wolsink2020), such as industrial expansion, energy reliability, energy costs, and the impact on the wider economy, we expect citizens to be more supportive of renewable energy deployments if these are framed as beneficial to the country’s economy (evoking a strengthening of the national economy, electricity price stability, and industrial competitiveness). We expect these effects to be more marked among those less worried by climate change and those combining low education and a rural residence.
H3. Economic competitiveness
H3a. Citizens are more supportive of renewable energies if these are framed as benefiting the country’s economy
H3b. The more so if they are less worried about climate change
H3c. The more so if they are less-educated ruralites (i.e., yellow vest profile)
The green shift
A key motive for renewable energy expansion is its greenness as an energy source which is both sustainable and low-carbon. This is the main reason public authorities have been keen to increase its deployment and the main argument used to counter opposition.
Studies, however, have found mixed results regarding the effect of a green frame on support for these large and intrusive infrastructures. As referenced earlier, Lockwood (Reference Lockwood2011) compared energy security, climate change, and economic opportunity frames to justify renewable energy expansion (in his case, wind and solar) and found that whilst the energy security frame resulted in the highest levels of support, the climate change frame outperformed the economic opportunities frame (Lockwood Reference Lockwood2011, p. 1103–6). As a counter example, Stokes and Warshaw (Reference Stokes and Warshaw2017) found little effect for 3 types of climate frames on attitudes towards renewables in the US. All 3 climate frames returned null effects, leading the authors to question whether messaging on climate change when promoting renewables is largely ineffective or whether citizens already associate renewables with climate change, making climate framing redundant. In a non-experimental setting, Hazboun et al. (Reference Hazboun, Briscoe, Givens and Krannich2019) evaluated citizens’ agreement with 7 renewable energy frames (from security to the economy to climate), citizens’ support for using renewables to generate electricity, and their support for a 20% renewable electricity quota standard. They found that agreement with the climate frame did not affect general renewables support but had a strong positive effect on support for the 20% renewable electricity policy (Hazboun et al. Reference Hazboun, Briscoe, Givens and Krannich2019, p. 8). Interestingly, they also found that non-Democrats disagreed most with the climate benefits of renewable energy (and inversely that metropolitan dwellers agreed most). This heterogenous effect of climate frames across subpopulations echoes conclusions by Lockwood (Reference Lockwood2011, p. 1105) who found – within an experimental setting – that women, younger respondents, and Lib-Dem/Labor supporters were much more positive towards a climate frame than their male, older, Conservative peers.
Building on this literature, we expect citizens to be more supportive of renewable energy deployment if it is framed as beneficial to the green transition (evoking notions of a green shift, of slowing down climate change, and increasing renewable energy production). However, following earlier research on the activation of green frames (e.g., Hazboun et al. Reference Hazboun, Briscoe, Givens and Krannich2019; Lockwood Reference Lockwood2011), we also expect that a green frame will actually depress support among those less worried by climate change and those combining low education and a rural residence.
H4. Green transition
H4a. Citizens are more supportive of renewable energies if these are framed as benefiting the green transition
H4b. The less so if they are less worried about climate change
H4c. The less so if they are less-educated ruralites (i.e., yellow vest profile)
The survey experiment
The case of Norway
Norway is an ideal case for assessing the effect of different renewable expansion phases, which is a central element in our experiment’s design. We hypothesized that support for different renewables follows a U-shaped curve, with greater citizen support for renewables which are at a still-prospective phase or are generations-long established, whilst midst-of-proliferation renewables would have least support. Crucially, Norway has renewables at all three phases.
Offshore wind in Norway is still in its infancy in terms of actual deployment, but it is a hotly discussed issue since the country has large ambitions to deploy about 30,000 Megawatt by 2040. Currently, Norway produces around 40,334 Megawatts of electricity, so these plans almost double Norway’s current electricity production capacity (+75%). However, Norway’s installed offshore wind currently consists of demonstration projects only. In 2023, the Norwegian Ministry of Energy announced a competition for a first site (Sørlige Nordsjø II) which was allocated in 2024 (to Belgian Ventyr SN II AS), with a possible start of operation of the turbines around 2031.Footnote 1 The Ministry later opened competition for projects for the second designated site (Utsira Nord) and announced in December 2025 that two major consortia (the Equinor/Vårgrønn partnership and the Harald Hårfagre joint venture) were formally awarded a project area each to begin site-specific impact assessments and thereafter apply for licences.Footnote 2
In stark contrast to offshore wind, Norway has a longstanding experience in hydropower, starting already in the late 19th century and undergoing large-scale deployment in the 1950s-1980s period. The upscaling of hydropower generated opposition, mostly related to nature protection concerns (including salmon migration) and indigenous rights (Sámi reindeer herding) (see Andersen and Midttun Reference Andersen and Midttun1985). Today, Norwegian hydropower is the country’s main source of electricity: it counts 1,791 hydropower plants providing about 88% of Norway’s annual electricity production with an installed capacity of about 33,947 Megawatts.Footnote 3 This makes Norway Europe’s biggest hydropower producer (ahead of France, Sweden, or Italy) with current discussions focusing on upgrading and extending its hydropower system.
Onshore wind corresponds to the midst-of-proliferation renewable. Onshore wind deployment grew dramatically in the second half of the 2010s in Norway, leading to a freezing of all new onshore wind farm licensing in 2019 and its reopening in 2022 under stricter rules requiring assent from the concerned municipality (Jikiun et al. Reference Jikiun, Tatham and Myrseth Oltedal2023, p. 4–5). In 2025, Norway counted 65 wind farms with a total of 1,392 turbines, accounting for about 5,082 Megawatts and about 11% of Norway’s total electricity production capacity.Footnote 4 Just as hydropower generated opposition, crystalized by the Alta controversy in the late 1970s/early 1980s (Andersen and Midttun Reference Andersen and Midttun1985), onshore wind deployment has also triggered its share of resentment culminating in the Fosen case, prompting questions of green energy justice, distributional justice, as well as green colonialism (Mósesdóttir Reference Mósesdóttir2024).
Norway, however, mixes least likely, most likely, and average features when it comes to climate policymaking styles and climate polarization, rural-educational divides, and climate worry, respectively. Norway is a somewhat “hard” case regarding its climate policymaking style. It has been depicted as “consensus-seeking” and “partnership-based” (Ćetković and Skjærseth Reference Ćetković and Skjærseth2019, p. 1044) which makes polarization and conflict less likely than in other political systems. Similarly, the high amount of energy produced through renewables (as discussed above) and hence Norwegians’ familiarity with renewables, makes them less likely to be manipulated by simple frames.
Norway does come across as a relatively likely case for exhibiting a “yellow vest” versus “urban élites” divide due to ongoing rural-urban tensions and educational disparities which have, in turn, impacted questions of policymaking and representation (e.g., Auerbach et al. Reference Auerbach, Eidheim and Fimreite2024; Mayne and Peters Reference Mayne and Peters2022) and affected attitudes towards some climate policies (Tatham and Peters Reference Tatham and Peters2023).
Regarding climate worry, Norway comes across as both relatively average in worry levels and a somewhat least likely case in terms of the potential impact of climate worry due to its weak cleaving nature. Indeed, Norwegian citizen panel data collected over the past decade regarding climate worry has been fairly stable and high (Gregersen Reference Gregersen2024). Comparative studies based on the European Social Survey (ESS) indicate that Norwegian attitudes are very much midrange. For instance, within a sample of 23 countries, Norwegians worry about climate change at sample average levels and almost identical levels to the British or the Dutch (T. Gregersen et al. Reference Gregersen, Doran, Böhm, Tvinnereim and Poortinga2020, p. 5). However, it seems that despite relatively average levels of climate worry, its effect does not impact existing cleavages – such as the left-right cleavage – but rather cuts across existing political divides (Lægreid et al. Reference Lægreid, Klemetsen and Aasen2025), thereby making the uncovering of heterogenous effects due to worry levels less likely.
Finally, Norway is a somewhat peculiar case when it comes to energy discussions. It is a large oil and gas producer, but these are mostly for export. Domestic discussions of energy needs revolve primarily around decarbonization and increasing electricity production. This production is predominantly hydroelectric, making it vulnerable to variation in rainfall and snowmelt (impacting reservoir levels) and occasionally forcing Norway to become a net electricity importer from neighboring countries like Sweden, Denmark, Germany, or the UK. Much of the domestic energy debate is hence focused on interconnections to the European energy market (a source of energy security, but also of price inflation due to higher prices in adjacent countries) and on future electricity demands from industry (either due to its intended decarbonization through electrification or due to a lack of available electricity for new industrial demands). This makes the Norwegian context quite different from that of the UK (e.g., Lockwood Reference Lockwood2011) or the USA (e.g., Bayulgen and Benegal Reference Bayulgen and Benegal2019; Gainous and Merry Reference Gainous and Merry2022; Hazboun et al. Reference Hazboun, Briscoe, Givens and Krannich2019; Stokes and Warshaw Reference Stokes and Warshaw2017), which have more varied energy mixes and different import/export dynamics.
Multifactorial survey experiment
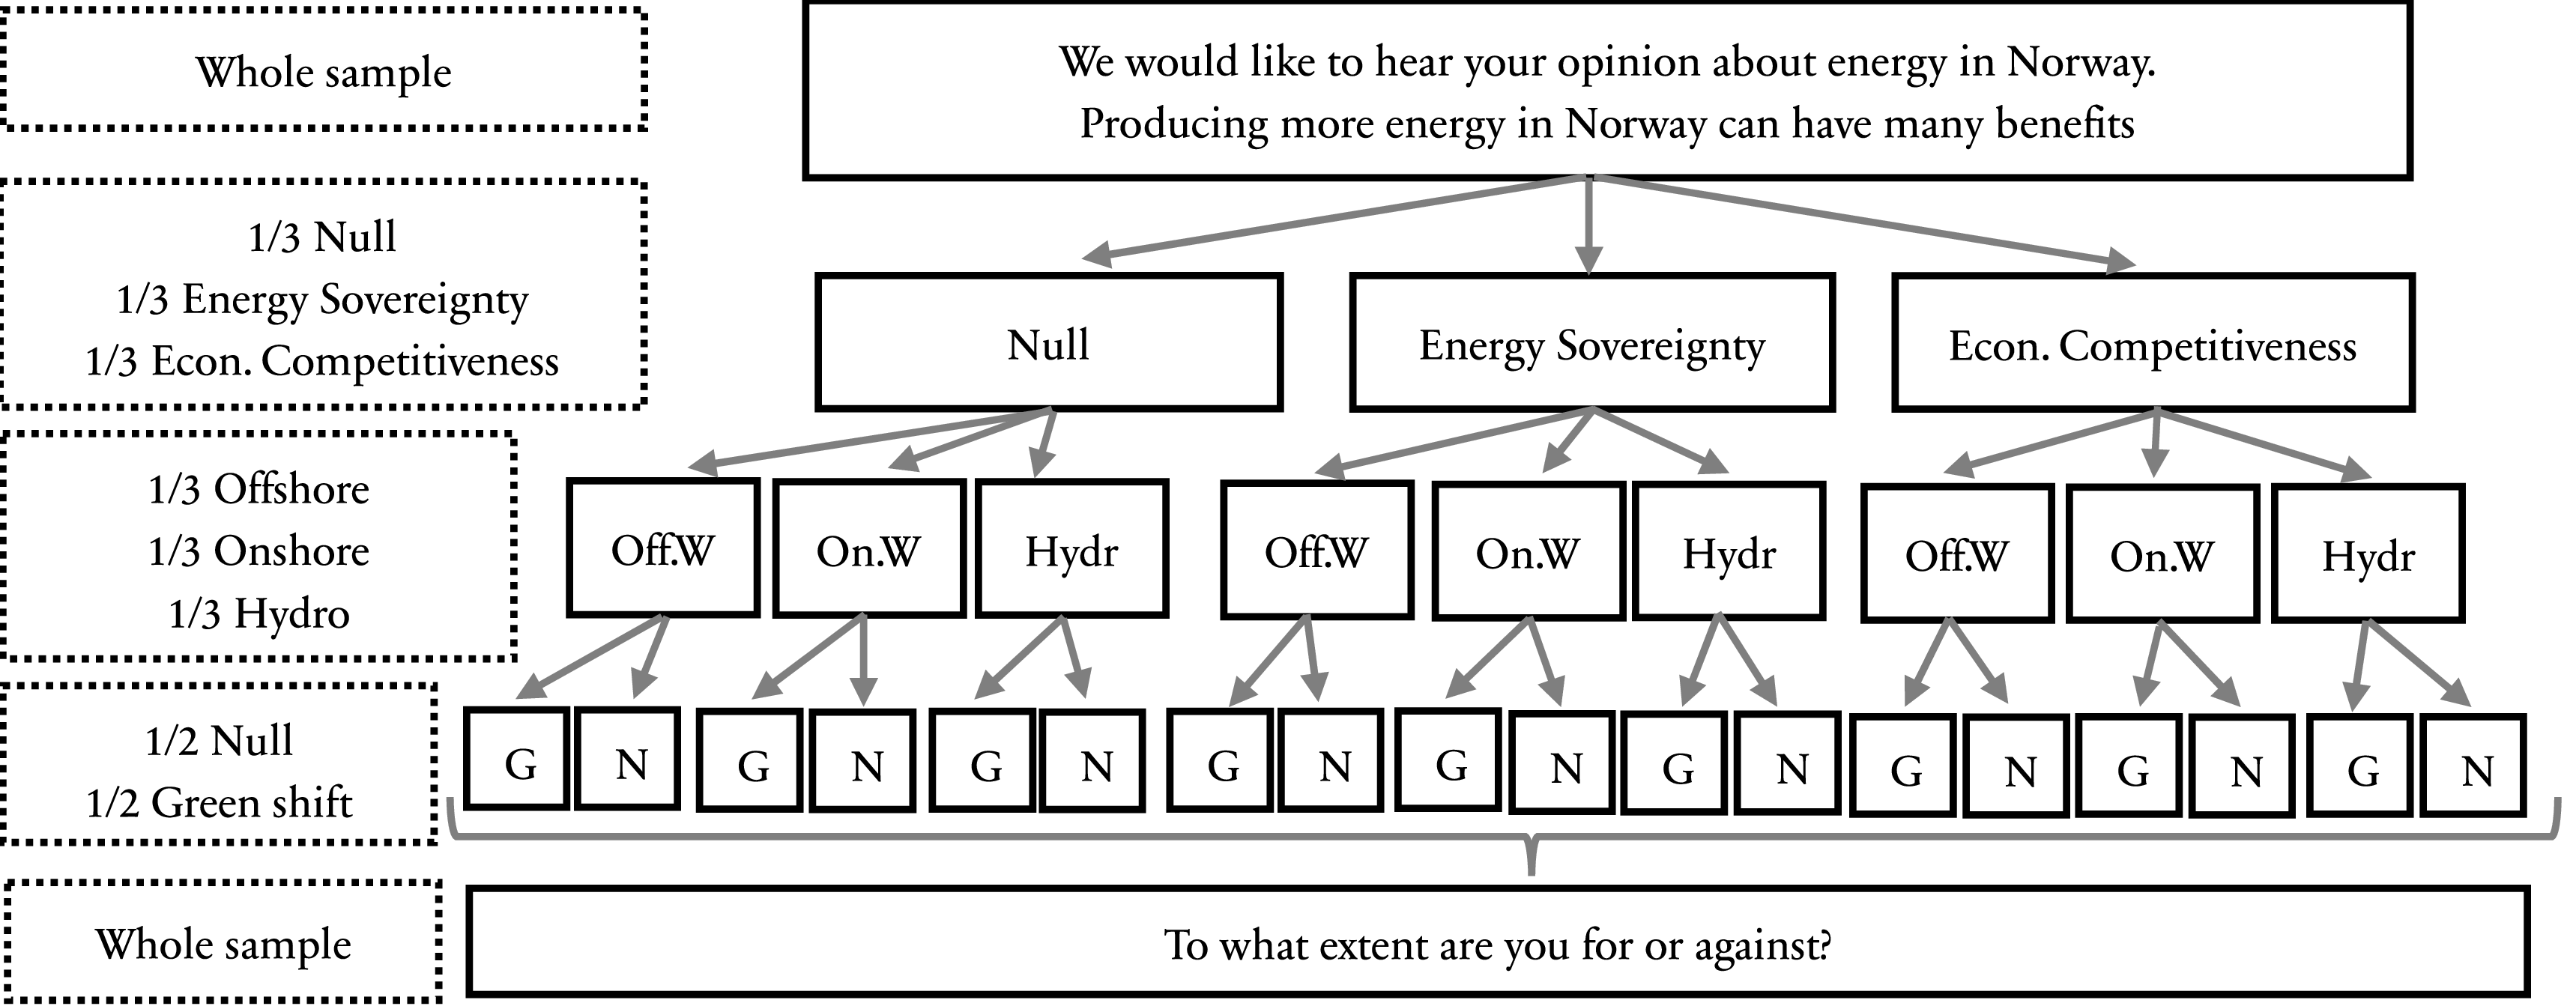
To test our hypotheses, we designed a multifactorial, between-subject, vignette survey experiment. We summarize the vignette’s design in Figure 1. We first indicate to respondents that we would like to have their opinion on energy issues. We inform them that producing more energy can have many benefits. We then introduce the first attribute and randomly split the sample in three. One group gets no further information (no frame). Another group is informed that one such benefit is that it could increase the country’s security of supply, making it less dependent on the European energy market and therefore increasing its energy independence (energy sovereignty frame, H2). The third group is informed that greater domestic energy production could strengthen the country’s economy by preventing electricity price increases, which could make the country’s industry more competitive on the global market (economic competitiveness frame, H3).
Design of the multifactorial vignette experiment.
Notes: The vignette counts three attributes with three levels for the first two and two levels for the final attribute. Independent random sampling for each attribute. Econ. Competitiveness = Economic competitiveness; Off.W = Offshore wind; On.W = Onshore wind; Hydr = Hydropower; G = Green shift; N = Null. Full experiment and vignette variants are available in the online Appendix.

Thereafter, we again randomly divide respondents in three groups and inform them that producing more energy in Norway can be achieve by building more offshore wind power (still-prospective renewable, H1), more onshore wind power (midst-of-proliferation renewable, H1), or more hydropower (long-established renewable, H1). The experiment’s third attribute splits the sample in two, with half of the respondents informed that the energy infrastructure in question would contribute to the green shift and slow down climate change because more renewable energy would be produced (green transition frame, H4), whilst the other half received no information (no frame), implying that for half of the entire sample, the vignette was focused solely on the energy dimension, without any mention of a climate or “green” dimension.
The experiment concludes by asking respondents to what extent they would be for or against the construction of more of the proposed renewable on a 7-point scale ranging from “strongly for” to “strongly against” with a “neither for nor against” middle point (the scale was reversed in the analysis). This is the study’s dependent variable. The original survey experiment is reported in full in the online Appendix (A).
To assess heterogeneous treatment effects, we collected data on three background indicators. First, we enquired about how worried respondents are about climate change on a 5-point scale ranging from “not at all worried” to “very worried.” We then considered those who are not worried (i.e., “not at all worried” + “not very worried”) as opposed to those who are (i.e., “somewhat worried” + “worried” + “very worried”), so as to isolate the least worried from the rest of the citizenry. In our sample, about 21% of respondents are not particularly worried by climate change, whilst 30% are somewhat worried, 29% are worried, and 20% are very worried. These 21% represent a similar slice of the citizenry to that identified by other studies – through more sophisticated latent class models – as most climate skeptic. Indeed, using various indicators, including climate worry/concern, Barrez (Reference Barrez2025) identifies a group of about 19% of the Belgian population being climate “disengaged” or “doubtful,” Leiserowitz et al. (Reference Leiserowitz, Roser-Renouf, Marlon and Maibach2021) label 18% of Americans as “doubtful” or “dismissive,” whilst Kácha et al. (Reference Kácha, Vintr and Brick2022) categorize 21% of Europeans as “doubtful.” Hence, in terms of group size, our sample’s least climate-worried seem to correspond quite well to the typical climate-skeptical subpopulation identified by existing scholarship.
Second, to assess the effect of being a less-educated ruralite, we divide respondents in three groups: (a) those who are low educated and have rural residence (yellow vest profile), (b) those who are high educated and have urban residence (urban élite profile) and c) the remainder of the sample: rural with high education and urban with low education (neither). This approach follows that used by Tatham and Peters (Reference Tatham and Peters2023) when studying attitudes towards fuel taxation. Low-educated ruralites were defined as living in a sparsely inhabited area, a village, or a small or medium-sized town and having no university or college education. High-educated urbanites were identified as having completed at least two years of university/college and living in a city, a suburb or the outskirts of a city. In our sample, about 31.5% of respondents are low-educated ruralites, 20.5% are high-educated urbanites, and 48% are neither.
Hence, our two conditioning profiles, those who worry less about climate change and the less-educated ruralites, correspond to 21% and 31.5% of our sample, respectively. Though these two groups are often portrayed as skeptical towards climate policies, they are actually quite distinct from one another, with limited overlap in membership. Indeed, a simple crosstabulation shows that the less-educated ruralites are quite evenly spread across the first three categories of worry: 28.5% are “not very/at all worried”, 35.1% are “somewhat worried,” 24% are “worried,” and 12.4% are “very worried.” Logically, being a less-educated ruralite and least climate-worried only correlate at a low level, be it when worry is operationalized as a continuous or as a dummy variable (continuous worry: r= −0.18***; least worried dummy: r = 0.12***). These two profiles therefore identify relatively distinct groups within society (Appendix, tables F1, F2, and F3). Further exploratory analysis highlights that these two groups share little in terms of age, gender, or left-right self-placement, but do converge when it comes to economic concerns: they have a negative perception of their country’s economic situation and would prioritize economic growth over environmental interests (Appendix G).
Data collection was funded by the SANE-Clim project which financed the purchasing of some question time in the 28th wave of the Norwegian Citizen Panel (NCP) fielded in late 2023 (Ivarsflaten et al. Reference Ivarsflaten, Dahlberg, Storelv, Løvseth, Auerbach, Bjånesøy, Broderstad, Bye, Böhm, Gregersen, Knudsen, Nordø, Schakel and Tvinnereim2024). The NCP is a probability-based national survey infrastructure running since November 2013 that serves as one of the main sources for academic research on Norwegian public opinion. Its participants are sampled directly from the Norwegian national population register and invited via personalized letters.Footnote 5 Our sample consists of answers from 4,031 citizens weighed to ensure representativeness (regarding education, gender, age, and geography). This large number of observations ensures sufficient power for subpopulation analyses whilst keeping the sample nationally representative for comparison with the rest of the population (see further below and Appendix H). The vignette experiment was located at the front end of the NCP wave to avoid possible contamination effects from other survey items (Appendix A.4). Respondents took around 17 minutes to complete the entire survey. Further details on the technicalities of the survey are discussed in the methodology reports of the NCP (Skjervheim et al. Reference Skjervheim, Bjørnebekk, Wettergreen, Gendal and Stokke2023). The survey experiment was not pre-registered, however, it follows past work regarding the conditioning effect of the yellow-vest profile on climate policy preferences (see Tatham and Peters Reference Tatham and Peters2023) complemented by one of the literature’s main indicator of citizens’ attitudes towards climate policies (i.e., climate worry) to identify citizens often portrayed as skeptical of climate policies. It is highly possible that many other interesting subpopulations could also have a relevant effect (see conclusion for suggested further research).
In the discussion below, we present predicted marginal effects derived from regression models. We plot these marginal effects with 95% and 84% confidence intervals. The latter is recommended by Julious (Reference Julious2004) for the comparison of point estimates within experimental settings where non-overlapping 84% confidence intervals indicate that estimates are significantly different at the 0.05 level (see also Cumming Reference Cumming2009, p. 206; Greenland et al. Reference Greenland, Senn, Rothman, Carlin, Poole, Goodman and Altman2016, p. 344). Conditional effects are assessed through interaction terms: mostly two-way (Figures 4–6) and in one instance three-way interactions (Figure 3). Interaction effects can sometimes be pushed for power. We conducted a power analysis in the online Appendix to assess these concerns (Appendix H). Regarding the conditional effects on specific subpopulations, even our smallest group, the least worried (weighted n = 850), provides sufficient power to detect substantively meaningful effects (Cohen’s d ≥ 0.24), although there is a risk of false negative (i.e. Type II error) for very small effects (i.e., Cohen’s d ≤ 0.18, see Appendix H.2). We additionally conduct corrections for multiple hypotheses testing applying the Benjamini-Hochberg (BH) False Discovery Rate (FDR) procedure to each model. Our main results are unaffected (see Appendix I). All original models and predicted margins are reported in full in the Appendix (D & E).
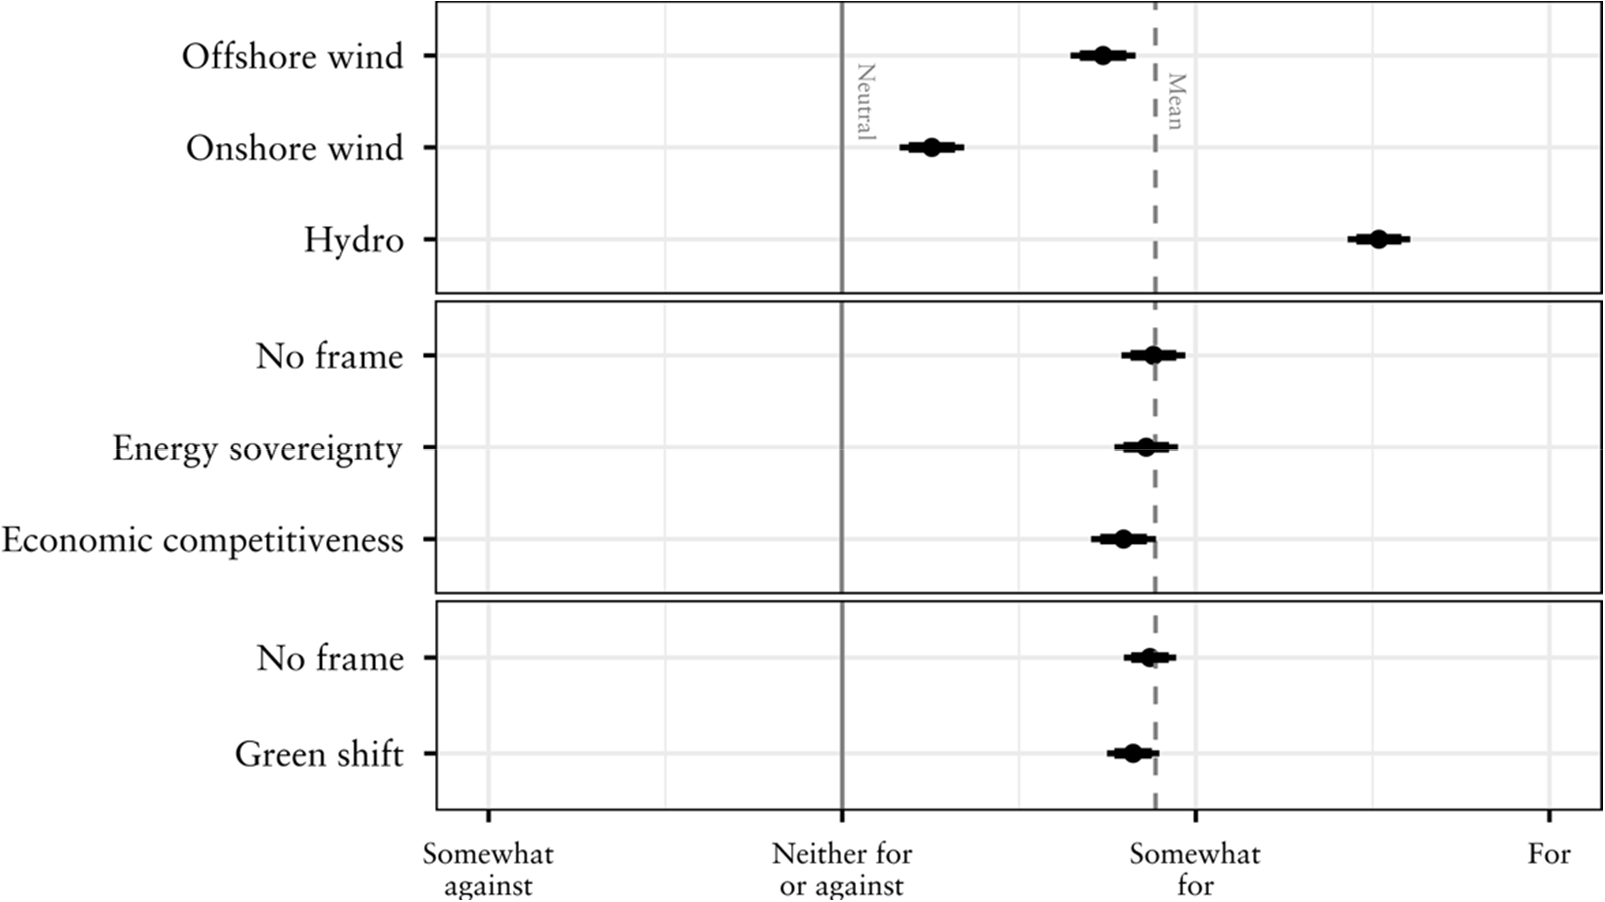
Support for renewables expansion – aggregate effects.
Notes: Predicted marginal effects with 84% and 95% confidence intervals where non-overlapping 84% confidence intervals indicate differences significant at the 0.05 level (Cumming Reference Cumming2009, p. 206; Greenland et al. Reference Greenland, Senn, Rothman, Carlin, Poole, Goodman and Altman2016, p. 344; Julious Reference Julious2004). N = 4,031. Table output is available in the supplementary materials (D1 and D2).

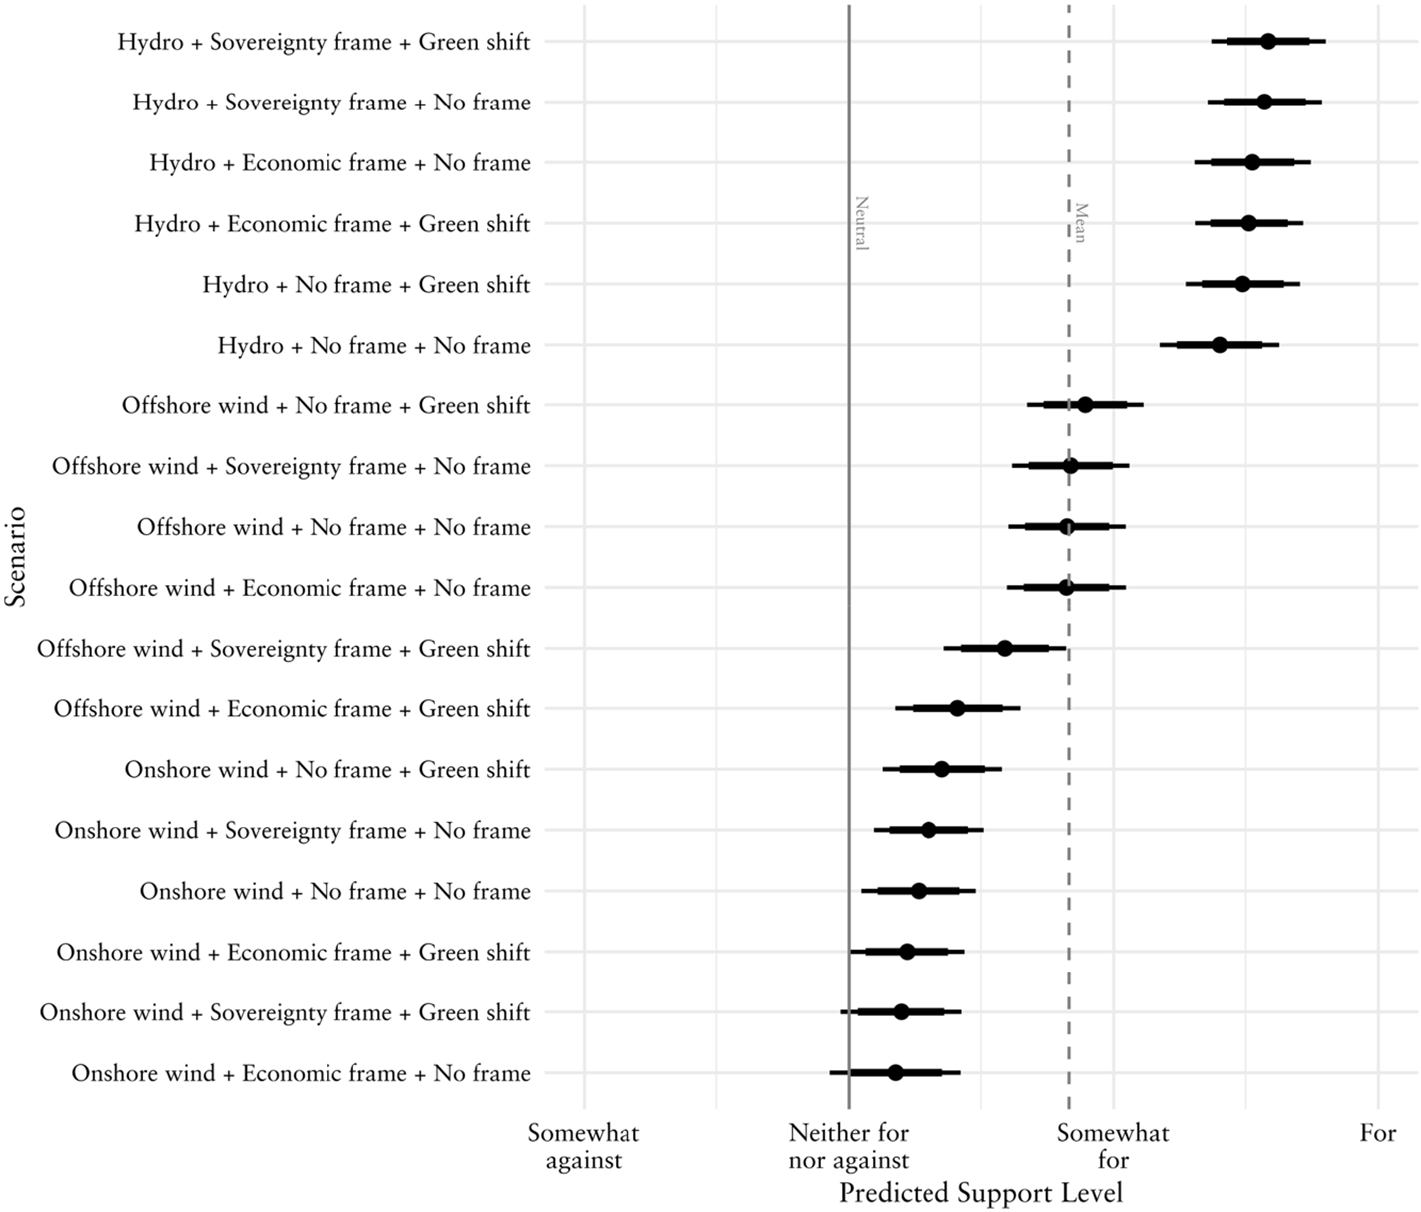
Support for renewables expansion – 18 unique combinations.
Notes: Predicted marginal effects with 84% and 95% confidence intervals where non-overlapping 84% confidence intervals indicate differences significant at the 0.05 level (Cumming Reference Cumming2009, p. 206; Greenland et al. Reference Greenland, Senn, Rothman, Carlin, Poole, Goodman and Altman2016, p. 344; Julious Reference Julious2004). N = 4,031. Table output is available in the supplementary materials (E1 and E2).

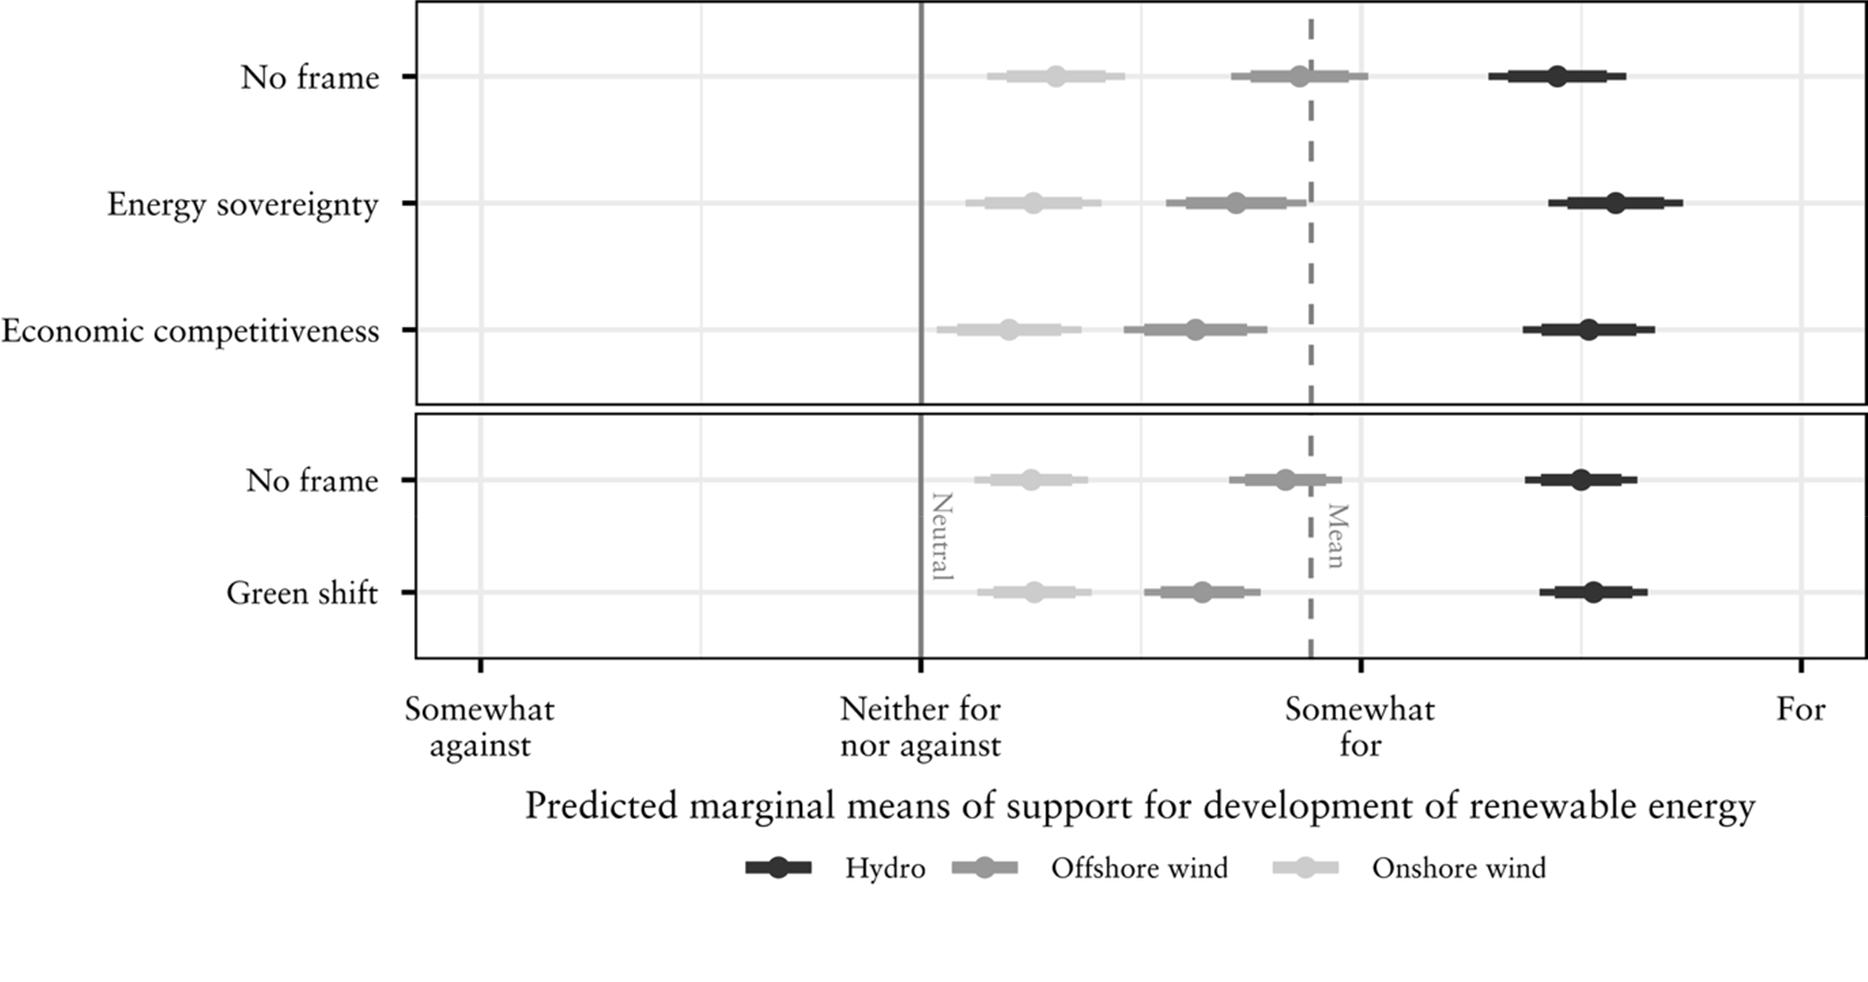
Support for renewables expansion – conditioned by energy type.
Notes: Predicted marginal effects, conditioned on energy source, with 84% and 95% confidence intervals where non-overlapping 84% confidence intervals indicate differences significant at the 0.05 level (Cumming Reference Cumming2009, p. 206; Greenland et al. Reference Greenland, Senn, Rothman, Carlin, Poole, Goodman and Altman2016, p. 344; Julious Reference Julious2004). N = 4,031. Table output is available in the supplementary materials (D3 and D4).

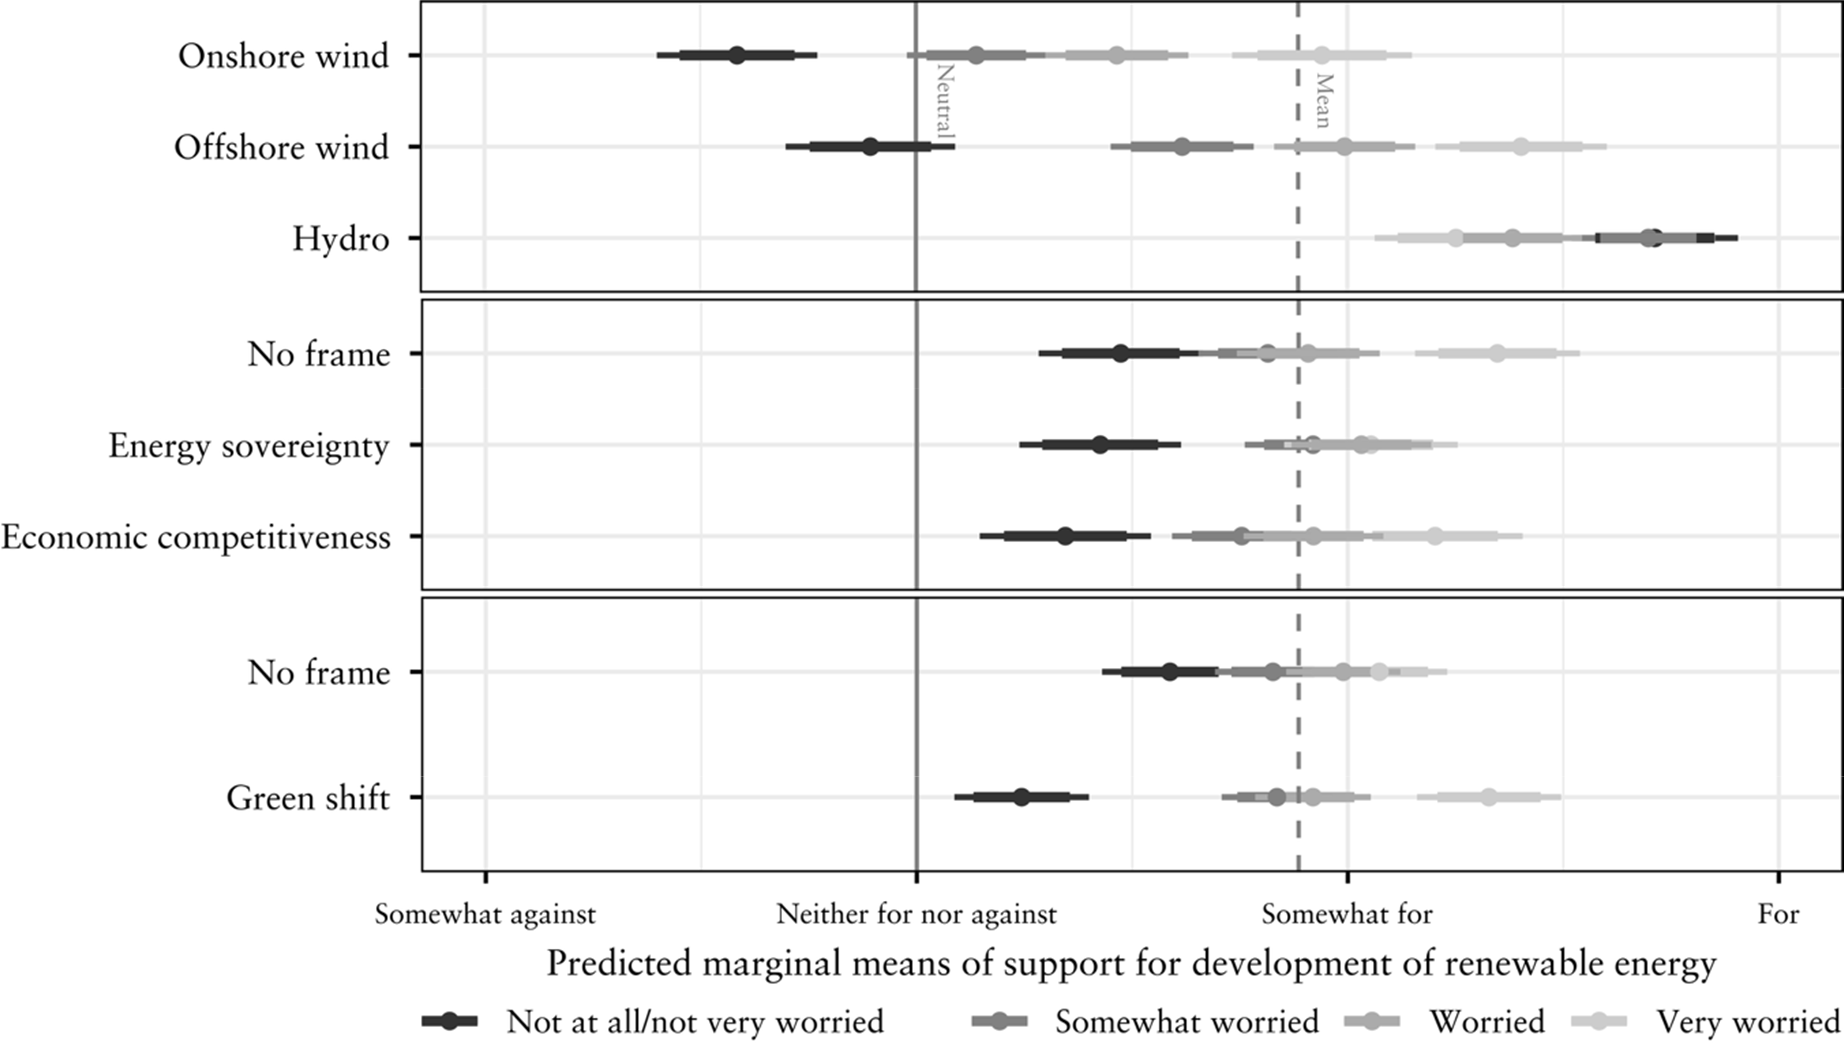
Support for renewables expansion – conditional on climate worry.
Notes: Predicted marginal effect of the treatments, conditioned on worry about the climate, with 84% and 95% confidence intervals where non-overlapping 84% confidence intervals indicate differences significant at the 0.05 level (Cumming Reference Cumming2009, p. 206; Greenland et al. Reference Greenland, Senn, Rothman, Carlin, Poole, Goodman and Altman2016, p. 344; Julious Reference Julious2004). N = 4,031. Table output is available in the supplementary materials (D5 and D6).

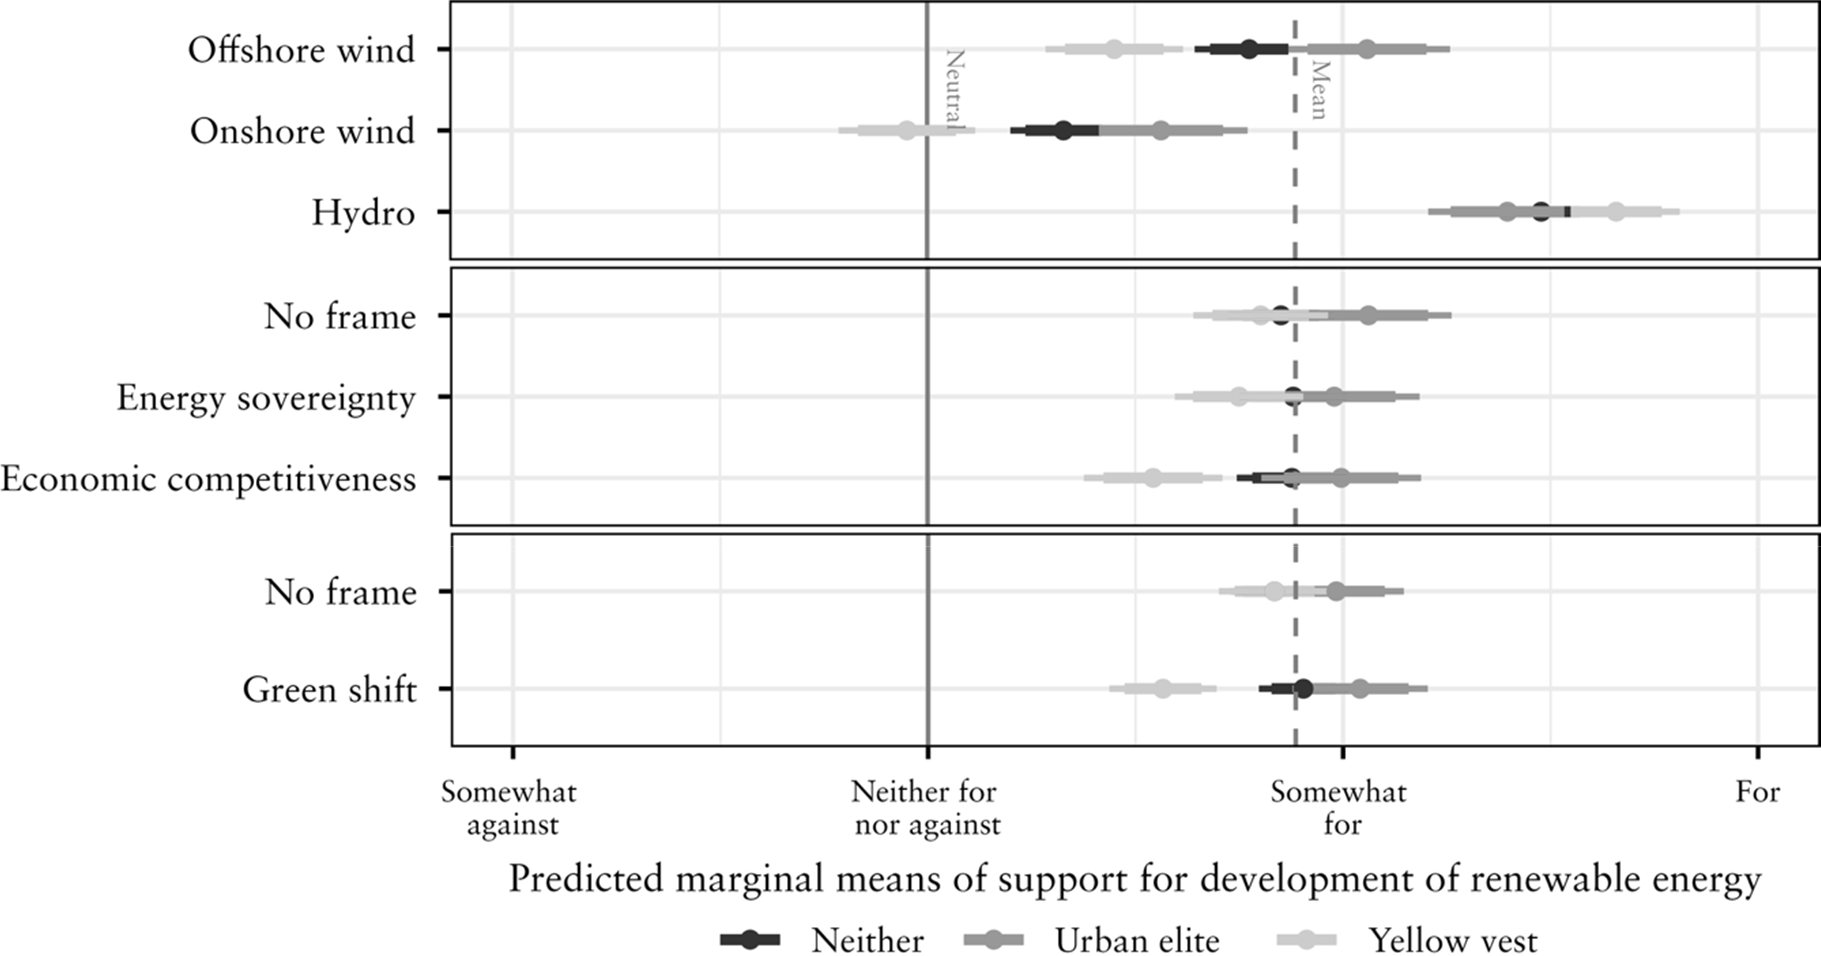
Support for renewables expansion – conditional on “yellow vests” vs “urban élites” vs “neither.”
Notes: Predicted marginal effect, conditioned on three profiles (yellow vests, urban élites, neither), with 84% and 95% confidence intervals where non-overlapping 84% confidence intervals indicate differences significant at the 0.05 level (Cumming Reference Cumming2009, p. 206; Greenland et al. Reference Greenland, Senn, Rothman, Carlin, Poole, Goodman and Altman2016, p. 344; Julious Reference Julious2004). N = 4,031. Table output is available in the supplementary materials (D7 and D8).

Aggregate effects – the prevalence of renewables type
Respondents are, on average, mildly supportive of building more renewable energy infrastructures. This is maybe not entirely surprising considering the experiment was exclusively framed in terms of benefits. With a mean of 4.84 on a 1–7 scale, respondents situate themselves close to being “somewhat for” (coded 5) and clearly above the indifference line (“neither for nor against,” coded 4). However, the width of the standard deviation (σ = 1.75) suggests a relatively high degree of variability in citizen views. Indeed, the standard deviation indicates that over two thirds of respondents are situated between values of 3.09 and 6.59, which correspond to “somewhat against” (coded 3) and between “for” and “strongly for” (coded 6 and 7 respectively).
When looking at aggregate patterns, reported in Figure 2, the type of renewable energy infrastructure comes across as the most important factor. Respondents sway towards neutrality regarding the construction of more onshore wind (
 $\hat \beta$
= 4.25, neutral coded 4) but are closer to mild support regarding offshore wind (
 $\hat \beta$
= 4.74, “somewhat for” coded 5) and are clearly in favor of expanding hydropower infrastructure (
 $\hat \beta$
= 5.52, between “somewhat for” and “for,” coded 5 and 6). These findings align with the expectation (H1a) of higher support for still-prospective and long-established renewables (offshore wind and hydropower, respectively) compared to midst-of-proliferation renewables (onshore wind). The preference curve we uncover does not strictly correspond to a U-curve but rather a truncated U or a J-curve, in the sense that offshore wind is significantly less popular than hydropower but still more popular than onshore wind.
These results broadly echo past findings on the phase-dependent preferences of citizens towards renewables (Eltham et al. Reference Eltham, Harrison and Allen2008; Wilson and Dyke Reference Wilson and Dyke2016; Wolsink Reference Wolsink2007). The results also corroborate observed historical trends in Norway, as hydropower triggered some opposition during its expansion phases (Andersen and Midttun Reference Andersen and Midttun1985) which is reminiscent of today’s opposition to onshore wind (Mósesdóttir Reference Mósesdóttir2024), whilst offshore wind’s popularity has recently dwindled as its deployment nears (Faleide Reference Faleide2023).
The various framings, however, fail to significantly affect aggregate preferences. There are no significant differences between any of the frames and null-frames. Furthermore, invoking benefits related to economic competitiveness or the green transition actually seem to slightly depress support for the construction of more renewables, albeit in a non-statistically significant way.
Contradicting our expectations, these null findings instead echo some past research which found little effect of framing regarding climate policy (Bernauer and McGrath Reference Bernauer and McGrath2016; Aklin and Urpelainen Reference Aklin and Urpelainen2013), little effect of climate framing on renewable portfolio standards (Stokes and Warshaw Reference Stokes and Warshaw2017), and weak effects of framing in terms of benefits (as in this study, which focuses on benefits only), in contrast to greater framing effects in terms of costs (Bayulgen and Benegal Reference Bayulgen and Benegal2019).
However, even at the aggregate level, there are two nuances to this null finding. Both concern offshore wind. First, when studying the 18 unique policy combinations reported in Figure 3, a negative effect of double framing occurs for offshore wind. Indeed, Figure 3 underscores the powerful effect of renewable type. Renewable-type systematically rank orders citizen preferences. The top 6 combinations all include hydropower, the bottom 6 are all onshore wind, and the intermediate 6 are all offshore wind. However, while all hydropower and onshore wind scenarios are tightly clustered together, there is a clear disruption in the distribution of preferences between the top-4 offshore wind scenarios (which overlap almost perfectly around the grand mean) and the remaining 2 offshore wind combinations, which slide towards levels of support typical of onshore wind. These two deviant offshore wind scenarios happen to have a double-framing. Of those two, the one combining the economic frame and the green frame results in citizen support which is significantly (at the 0.05 level, noted p < 0.05) lower than for all the other non-double-framed offshore wind combinations. In other words, whilst any framing of hydropower or onshore wind hardly affects aggregate citizen preferences, the double-framing of offshore wind leads to a break in the distribution of support, triggering significantly weaker support for offshore wind in the case of the economic-green double framing.
This finding suggests two things: (a) support for a still-prospective renewable (offshore wind) is more malleable and more susceptible to framing effects (compared to long-established or midst-of-proliferation renewables), and (b) citizens seem to suffer from “framing overload”: by this we mean that double-benefits framing actually depresses offshore wind support instead of boosting it. This is especially striking since the null framing of offshore wind generates significantly more support than the double (economic and green) benefits framing.
This unexpected finding led us to inductively analyze framing effects by renewable type. These explorative results are reported in Figure 4. They highlight the backlash effect of the economic and green frames for offshore wind specifically. Whilst none of the frames have a significant effect on the other renewables (all estimates overlap), the green and economic frames depress support for offshore wind (compared to the null-framing, p < 0.05). This more targeted analysis confirms the inductive findings from Figure 3: framing the expansion of offshore wind in terms of green benefits and enhanced economic competitiveness will actually weaken support. Although the importance of these findings should not be overstated (the frames only dampen support but fall short of triggering opposition), it is remarkable that benefits framing can weaken support in the population as a whole.
A green backlash? Activating the least-worried and the less-educated ruralites
Experimental survey research highlights the potential for heterogenous treatment effects, conditional upon respondents’ beliefs or socio-economic situation (e.g., Bayer and Ovodenko Reference Bayer and Ovodenko2019; Gainous and Merry Reference Gainous and Merry2022; Lockwood Reference Lockwood2011). We have hypothesized that two such groups may deviate from the rest of the population: the least worried by climate change and the less-educated ruralites (Hamilton Reference Hamilton2011; Harring and Jagers Reference Harring and Jagers2018; Lorteau et al. Reference Lorteau, Muzzerall, Deneault, Kennedy, Rocque, Racine and Bureau2024; Tallent Reference Tallent2025; Tatham and Peters Reference Tatham and Peters2023). We here seek to answer two related questions: (a) whether certain frames open a “support gap” within society (understood as increased distance between groups’ preferences) and (b) whether certain frames alter a group’s level of support (understood as significant differences within a single group).
Figure 5 provides information on the conditioning effect of climate worry. We draw three main findings from this analysis. First, the type of renewable opens significant support gaps regarding wind energy, but hydropower closes such a gap. Indeed, support for onshore and offshore wind is significantly lower among the least worried (
 $\hat \beta$
= 3.59 and 3.89) than among any other group, including its most proximate group, the “somewhat” worried (
 $\hat \beta$
= 4.14 and 4.62). However, hydropower closes this preference gap: all groups converge in their support for building more hydropower irrespective of their levels of climate worry, and the least worried and somewhat worried actually out-support their more worried peers for that particular technology. Hence, assuming that the least worried are necessarily less supportive of renewable energies overlooks that some renewables are actually championed by these less concerned citizens, although probably due to other reasons than their climate benefits. Thus, we do find some support for the expectation (H1b) that less climate-worried citizens will favor long-established renewables (such as hydropower) and will show less support for midst-of-proliferation renewables (such as onshore wind). However, expectations regarding the still-prospective renewable (offshore wind) are not supported, as this technology opens a clear support gap between the least worried and the rest.
The second finding from Figure 5 is that energy sovereignty and economic competitiveness only contribute to widen the gap between the least worried and the rest of the citizenry. This gap is already present in the absence of these frames (Δ in predicted margin with the most proximate group = 0.342, p < 0.05), it widens when economic competitiveness is introduced (Δ = 0.409, p < 0.05), and even further when energy sovereignty is introduced (Δ = 0.493, p < 0.05). Hence, we do not find support for the expectation that the least worried will be convinced by energy sovereignty and economic competitiveness frames (H2b and H3b), instead we find evidence that such frames will actually widen the support gap between the least worried and the rest of the citizenry.
Whilst counter to our economic and sovereignty expectations, these findings echo those of “backfire” and “boomerang” effects which some of the survey experiment literature has documented. In these instances, framing can have the opposite effect than intended for certain subpopulations (Hart and Nisbet Reference Hart and Nisbet2012; Zhou Reference Zhou2016) and the same frames can have diverging effects according to respondents’ beliefs or background characteristics (Bayer and Ovodenko Reference Bayer and Ovodenko2019; Gainous and Merry Reference Gainous and Merry2022). Hence, even positively intended benefits framing may end up widening existing preference gaps in society instead of closing them down.
These backfire and boomerang effects are even more noticeable in the case of a green frame (H4b). This is our third finding regarding the least worried. Not only will a green frame widen the preference gap between them and the rest, but it will significantly lower their own levels of support. Indeed, in the absence of a green frame, the preference gap is relatively small (Δ = 0.239, p < 0.05), but it more than doubles when introduced (Δ = 0.595, p < 0.05), also leading to a significant drop among the least worried themselves (Δ = 0.344, p < 0.05). Although the substantive effects are relatively small, they are doubly significant in the sense that they provide evidence that a green framing of energy questions will widen the gap between the least worried and the rest, whilst also significantly lowering support among the least worried.
Our findings regarding the less-educated ruralites are strikingly similar. This was no forgone conclusion since these two groups (the least worried and the less-educated ruralites) represent distinct segments of society which are only weakly related to one another (see Appendix F & G ). As illustrated in Figure 6, onshore and offshore wind open a preference gap between them and the rest of the citizenry (Δ = 0.376 and Δ = 0.324, all p < 0.05), which hydropower closes (overlapping confidence intervals), hence providing partial support for expectations regarding types of renewables (H1c). Economic competitiveness not only opens a gap between the less-educated ruralites and the rest of the citizenry (Δ = 0.334, p < 0.05) but also significantly lowers their own levels of support compared to the no frames scenario (Δ = 0.259, p < 0.05). This contradicts our expectations about sovereignty and economic frames boosting yellow vest support (H2c and H3c) but points instead towards backfire and boomerang effects (Gainous and Merry Reference Gainous and Merry2022; Hart and Nisbet Reference Hart and Nisbet2012; Zhou Reference Zhou2016). Finally, and more importantly, a green frame both opens a gap with other groups (Δ = 0.338, p < 0.05) and depresses their own levels of support (Δ = 0.269, p < 0.05). Hence, we find some support for the expectation of a green backlash among the less-educated ruralites (H4c) affecting the preference gap between them and other groups and lowering support among them too.
Conclusion
This article makes two main points. First, not all renewables are equal. Some are much more popular than others. Long-established renewables come across as most popular, whilst those in the midst-of-proliferation much less so. Still-prospective renewables (in this case offshore wind) occupy an intermediate position and are also those where citizens’ preferences are most malleable, but with an important caveat: framing offshore wind in terms of additional benefits regarding the economy or the green transition actually depresses support instead of heightening it.
Second, these effects are even more pronounced for two segments of society: the least climate-worried and the less-educated ruralites. Although distinct, these two groups react in similar ways. They are much more sensitive than their peers to the type of renewable being proposed, and different frames not only open a support gap between them and the rest of the citizenry but also depress support among them. This backfire or boomerang effect (Hart and Nisbet Reference Hart and Nisbet2012; Zhou Reference Zhou2016) is particularly important when one considers the green framing of renewable energy projects. This has been the dominant justificatory frame for the construction of these infrastructures. However, this research shows that a green frame can depress support in the population (as a whole) for certain energy types (here, offshore wind) and within certain segments of the population, such as the least climate-worried or the less-educated ruralites. If policymakers wish to boost support for these infrastructures, leaving them unframed as a strict energy question seems the best option. Our advice to policymakers is therefore simple: don’t say it is green.
These findings contribute to a body of research highlighting the fickle nature of framing effects. Indeed, it is remarkable that framing in terms of benefits can leave the average citizen unmoved but can also (a) open support gaps between groups along traditional divides such as rurality, education, or climate worry, and (b) depress support within these groups. This reinforces previous insights regarding the importance of heterogenous treatment effects (e.g., Bayer and Ovodenko Reference Bayer and Ovodenko2019; Lockwood Reference Lockwood2011) and regarding the double-edged nature of benefits frames with clear backfire and boomerang effects within particular segments of society (e.g., Gainous and Merry Reference Gainous and Merry2022; Hart and Nisbet Reference Hart and Nisbet2012; Zhou Reference Zhou2016).
This study suffers from many limitations (e.g., single-country case study, underpowering for smaller effects, general limitations of survey experiments). Some of these could be addressed by further research. We recommend further work in at least five different directions. First, one needs a better understanding of why relatively distinct groups react in similar ways to a given policy. We have here focused on the least climate-worried and the less-educated ruralites as expressions of a prominent climate divide (worry) and the intersection of two traditional friction lines (the rural-urban divide and the educational divide). The correlation and degree of overlap between these two groups is relatively low (Appendix F). Similarly, they share little in terms of gender, age, or left-right positioning. But they do share economic concerns about the state of the national economy and prioritizing economic growth (Appendix G). We therefore recommend further research exploring the communalities between groups who come across as relatively distinct but are typically critical of climate policies and who together contribute to a wider green backlash (Bosetti et al. Reference Bosetti, Colantone, De Vries and Musto2025).
Second, one needs to broaden our understanding of whether similar divides play out similarly across national contexts. The two divides studied here (climate worry and education-rurality) are rather straightforward and one may expect that they play out similarly in many advanced democracies. Other divides might be more context dependent (e.g., partisanship in polarized systems) or still emerging (e.g., toxic masculinity or anti-wokism). We therefore encourage further research to assess to what extent dynamics observed in some countries can(not) travel to others, and if so, which ones.
Third, climate policies are varied. Just as we found some renewables to be more popular than others (hydropower vs. onshore wind), other climate policies may display as much variation, ranging from those impacting food (e.g., meat tax, veganism subsidies, CO2 taxes on agriculture) to those affecting transportation (e.g., bans on short flights, low emissions zones). We encourage research analyzing a plurality of climate policies (e.g., Smith and Leiserowitz Reference Smith and Leiserowitz2014; Tallent Reference Tallent2025) to explore their effects on subpopulations within the citizenry, such as those at the intersection of existing conflict lines (e.g., gender, generational, peripheries). Some policy mixes might be more acceptable than others to these groups.
Fourth, within the energy domain, we recommend greater research on still-prospective energy infrastructures: our research shows that many citizens have relatively fixed preferences regarding midst-of-proliferation and long-established infrastructures. However, still-prospective technologies, which have yet to be upscaled, are more malleable in terms of citizen preferences. In this sense, knowing more about the sensitivity of citizen preferences towards Carbon Capture Storage (CCS), hydrogen (as an energy carrier), or battery mega-factories would be relevant.
Finally, we encourage further research within the field of framing studies regarding the occurrence of boomerang and backfire effects (Hart and Nisbet Reference Hart and Nisbet2012; Zhou Reference Zhou2016) and regarding what we identified as “framing overload”: when adding positive frames decreases support. We are not aware of specific literature on “framing overload” and even less so in terms of generating backfire effects. Some literature highlights information and choice overload which may overwhelm respondents and generate cognitive fatigue, hence neutralizing framing effects. However, our research used a maximum of two short frames, hence making cognitive overload unlikely. We encourage research on whether a reasonable cumulation of positive frames (e.g., 2 or 3) may trigger skepticism (due to perceived sugarcoating and suspicion of being manipulated) or may simply act as a counter-mobilization trigger (e.g., Schuck and de Vreese Reference Schuck and de Vreese2009).
Supplementary material
The supplementary material for this article can be found at https://doi.org/10.1017/S0143814X2610138X.
Data availability statement
Replication materials are available in the Journal of Public Policy Dataverse at https://doi.org/10.7910/DVN/FKIFUA. The raw Norwegian Citizen Panel (NCP) data file used in the analysis is not bundled with the replication package because it is distributed under the NCP’s own data-access terms. Readers can download it from Sikt (Norwegian Agency for Shared Services in Education and Research): https://doi.org/10.18712/NSD-NSD3189-V2. Once downloaded, the file can be used with the replication code as described in the Dataverse documentation.
Acknowledgements
The authors thank the anonymous reviewers for their constructive feedback, which greatly improved this manuscript. The authors would also like to thank numerous colleagues for feedback at the ECPR and NOPSA conferences, as well as the DIGSSCORE and Solstrand seminars.
Funding statement
SANE-Clim project (grant ID: 102235107).
Competing interests
The authors declare that they have no known competing financial interests or personal relationships that could have appeared to influence the work reported in this paper.


 Open access

