


INTRODUCTION
The aggregation of macroparasites among hosts is common in natural host-parasite systems, such that a few hosts harbour heavy infections while most hosts have few or no parasites (Shaw and Dobson, Reference Shaw and Dobson1995; Wilson et al. Reference Wilson, Bjornstad, Dobson, Merler, Poglayen, Randolph, Read, Skorping, Hudson, Rizzoli, Grenfell, Heesterbeek and Dobson2002). The variation in parasite abundance in a population of hosts is consistently greater than the mean and follows Taylor's power law (Taylor, Reference Taylor1961), which states that the variance of the abundance of individuals per habitat (parasite per host, intensity) scales with mean abundance of individuals as an exponent of abundance, b: the degree of aggregation. The intriguing feature of Taylor's power law is that the degree of aggregation is remarkably consistent among taxa, in both parasitic and free-living species, suggesting that similar constraints drive the degree of aggregation regardless of life-history traits (Taylor and Taylor, Reference Taylor and Taylor1977; Taylor and Woiwod, Reference Taylor and Woiwod1980; Shaw and Dobson, Reference Shaw and Dobson1995; Morand and Guegan, Reference Morand and Guegan2000). Parasitic infections exhibit a similarly consistent variance to mean relationship, within and between parasite species, such that most species exhibit a degree of aggregation: b=1·55±0·04 s.d. (Shaw and Dobson, Reference Shaw and Dobson1995). The causes of aggregation within host-parasite relationships have been attributed primarily to variation in host exposure, host susceptibility and environmental conditions (Anderson and Gordon, Reference Anderson and Gordon1982) although, in a more general sense, the degree of aggregation can be generated via stochasticity in the vital population rates (birth, death, immigration, emigration) within heterogeneous habitats (Anderson et al. Reference Anderson, Gordon, Crawley and Hassell1982).
Nematode parasites in the family Oxyuridae (referred to hereafter as pinworms) are gastrointenstinal parasites with a direct life cycle wherein females deposit eggs in the intestinal tract and eggs pass into the environment with host feces. In addition, females of many pinworm species infecting mammalian hosts can exit the intestine and deposit eggs on the perianal region of the host, allowing for host-self-infection during grooming behaviour (Prince, Reference Prince1950; Schad, Reference Schad1957; Adamson, Reference Adamson1989, Reference Adamson1994; Anderson, Reference Anderson2000). In general, pinworms are considered benign relative to other parasitic nematodes, as they have no extra-intestinal migration and do not feed on tissue or host food but consume bacteria in the posterior gut of their hosts (Adamson, Reference Adamson1994); as opposed to nearly all other parasitic nematodes that have at least one life-stage involving migration through or consumption of host tissue.
The pinworm reproductive strategy of host-self-infection suggests that the intensity of infection in hosts already infected would increase faster than the rate of infection in uninfected hosts, resulting in a highly aggregated intensity distribution. Whereas, conventional nematode parasites are subject to the population processes of death (natural senescence and host mediated) and infection (immigration), pinworms have the additional host-self-infection process, which equates to within-host birth. Pinworm host-self-infection rates also vary with the level of infection, further suggesting the potential for high aggregation: host harbouring higher pinworm intensities are subject to higher self-infection rates. The consequence of pinworm life-history for aggregation within a population of hosts is that the variance in intensity per host may be greater compared to conventional nematodes because of the addition of a birth process.
However, there are costs associated with being too aggregated: as parasite numbers per host increase, forces such as host immune response to increased virulence and intraspecific competition for energy or space will act to reduce intensity per host via increased parasite death rate. At the extreme, parasite-induced host mortality removes an entire patch of parasites at parasite intensity-dependent rates. Such forces constrain the upper limit of the variance to mean ratio by reducing intensity within, or removing, the few hosts that harbour the most parasites, as well as decreasing the potential for transmission and creating an evolutionary compromise between parasite intensity (transmission, immigration/emigration) and host fitness (Read, Reference Read1994; Gandon et al. Reference Gandon, van Baalen and Jansen2002).
The unique aspects of pinworm life-history provide an interesting case to study the trade-offs between direct-reproduction within hosts (birth rates), transmission (immigration and emigration), and death (parasite death rate and host death rate) on generating the widely observed patterns of aggregation of parasite populations. We asked the question: does pinworm life-history lead to greater aggregation across host species compared to other orders of nematode parasites? Specifically, we empirically examined the differences among pinworm (genus: Syphacia) aggregation within and between 2 wild rodent hosts with similar ecology, Apodemus flavicollis from Trento, Italy and Peromyscus leucopus from Pennsylvania, USA. We also examined aggregation patterns in a non-pinworm nematode parasite, Heligmosomoides polygyrus, in A. flavicollis hosts. In addition, we combined our data with other published reports of abundance and variance of pinworms and compared the pinworm variance-mean relationship to the previously reported variance-mean relationship across a wide range of nematode parasites (Shaw and Dobson, Reference Shaw and Dobson1995). We predicted that the self-infecting characteristic of pinworms leads to a greater variance versus mean relationship than nematode parasites with a direct life cycle that do not host self-infect. Finally, to further investigate the effects of pinworm life-history characteristics on generating the observed variance-mean relationship, we present a stochastic simulation model that compares simulated variance versus mean relationships under a range of host-self-infection, parasite death, and transmission rates.
MATERIALS AND METHODS
Rodent – macroparasite data
Yellow-necked mice were collected from mixed broadleaf woodland of the Italian Alps (Magla Campo, Trentino) at 6 sites separated by at least 500 m. Trapping was carried out for 3 consecutive nights at each site, during July 2002. White-footed mice were collected from open-forested habitat in central Pennsylvania, USA across 11 sampling sites: sampled from 2005 to 2007. All sites were separated by at least 1 km and sampled once. All parasites were identified and counted by dissection of the host intestinal tract. All host collections were carried out under the approval of the appropriate animal care and use oversight (Pennsylvania State University Institutional Animal Care and Use Committee approval numbers 16061 and 23268).
Additional reports of mean and variance were assembled from reports of dissections from the literature for Apodemus sylvaticus (the wood-mouse) – H. polygyrus and A. sylvaticus – Syphacia stroma (Behnke et al. Reference Behnke, Lewis, Mohd Zain and Gilbert1999; Muller-Graf et al. Reference Muller-Graf, Durand, Feliu, Hugot, O'Callaghan, Renaud, Santalla and Morand1999; Abu Madi et al. Reference Abu-Madi, Behnke, Lewis and Gilbert2000; Fuentes et al. Reference Fuentes, Saez, Trelis, Galan-Puchades and Esteban2004), as well as for P. leucopus – S. peromysci (Grundman et al. Reference Grundman, Warnock and Wasson1976; Vandegrift and Hudson, Reference Vandegrift and Hudson2009).
Analysis of parasite intensity and variance
We calculated mean intensity per host, variance around the mean intensity, and prevalence at each trapping site for S. frederici and H. polygyrus in A. flavicollis from the Trentino sites and for S. peromysci in P. leucopus from the Pennsylvania sites. We fitted the number of parasites per host to the negative binomial and Poisson distribution using direct maximum likelihood estimation and evaluated the goodness-of-fit using the deviance of the maximum likelihood estimate according to the methods of Shaw et al. (Reference Shaw, Grenfell and Dobson1998). We then tested for differences in mean parasite abundance (negative-binomial mean, μ) and aggregation (negative-binomial, k) as described in the analysis of dispersion test by Shaw et al. (Reference Shaw, Grenfell and Dobson1998) between host sex in A. flavicollis – S. frederici, A. flavicollis – H. polygyrus, and P. leucopus – S. peromysci, as well as between H. polygyrus – S. frederici in A. flavicollis and between S. frederici – S. peromysci in their respective hosts. We tested for differences in prevalence among each host-parasite relationship using odds ratios and 95% confidence intervals around the odds ratios between each pair of host and parasite and considered prevalence different if the odds ratio CI did not overlap one.
We evaluated the relationship between mean intensity per host and variance around that mean for the parasite samples along with our additional literature values from other host species according to Taylor's power law (Taylor, Reference Taylor1961):

where, μ, is the mean abundance of parasites per individual, s2 is the variance, and a and b are parameters that describe the power relationship. We used each spatially independent sample of A. flavicollis – S. frederici, A. flavicollis – H. polygyrus, and P. leucopus – S. peromysci as separate data points and included each additional host-parasite report from the literature as a single data point. We fitted linear regressions to the natural log-transformed variance as the dependent variable and the natural log-transformed mean of each population sample as the independent variable. We compared 95% confidence intervals around the slope parameter, b, between the regression lines fitted with pinworm parasites and non-pinworm parasites, as well as to the previously reported b for host-macroparasite interactions, 1·55+/−0·037 s.d. (Shaw and Dobson, Reference Shaw and Dobson1995). We considered the slopes significantly different if the confidence intervals around (log b) did not overlap.
Simulation model
To explore the population processes that generate aggregation, we created a stochastic model to simulate the number of parasites per host based on infection (immigration), death, and birth (host-self-infection) processes. Our aim was to simulate the processes that may lead to aggregated patterns of macroparasite intensity in a population of hosts as a result of a conventional transmission mode of macroparasites and contrast these aggregation patterns with a transmission model where: (i) a birth process is present (i.e. direct reproduction within a host, host-self-infection), (ii) predisposition to infection is increased (i.e. no migration through host tissue) and (iii) parasite death is decreased and intensity-dependent death rate is weakened (i.e. no consumption of tissue or other intimate host interactions that invoke strong immune responses). These 3 aspects of the transmission process correspond to the aspects of pinworm life-history that differ from most other families of vertebrate parasitic nematodes. Our approach was to contrast general trade-offs in population processes that may generate high levels of aggregation without invoking any mechanisms specific to nematode life-history (e.g. nothing specific about the genus Heligmosomoides was reflected in our baseline models), except for host-self-infection.
The model for the conventional nematode infection process described the number of parasites, P, in a host, i, based on stochastic force of infection, ρ, the probability that a host is exposed to a parasite infective stage and that infective stage establishes (predisposition to infection), φ, and parasite death rate d (Equation 1a). A parasite-intensity dependence, ψ, was included as a modifier to the death rate (d maxψ, equation 1a) based on the current intensity of parasites and a carrying capacity, k; such that death rate approached zero when there was very low intensity of infection (P→0, ψ→0), and increased linearly to the maximum death rate, d max, as the intensity of infection approached k (P→k, ψ→1). The models for simulated pinworm transmission processes included infection-death processes without intensity-dependent death (Equation 1b) and infection-death processes with host-self–infection, with (Equation 2a) and without intensity-dependent death rates (Equation 2b). Host-self-infection was parameterized by the proportion of total fecundity a female deposits for host-self-infection, τ, the sex ratio of parasites, π, and the current number of parasites per host P (Equation 2a,b).


Force of infection, ρ, was modelled as a stochastic process with the number of potential infective stages that a host could be exposed to drawn from a Poisson distribution with mean=ρ, representing an environmental pool of infection. We assumed that the mean force of infection was an endemic number of infective stages for each model realization and ran a series of simulations at ρ=3, 5, 10, 20, 100. The predisposition to infection, φ, was modelled as a host characteristic: the probability that an infective stage is encountered and subsequently established in a host, such that most hosts had a low predisposition to infection and few hosts had a high predisposition to infection. This predisposition distribution was chosen to represent heterogeneities in exposure and susceptibility that have been proposed to generate aggregated distributions of parasites in host populations, but are not explicitly modelled because they are beyond the scope of this simulation (Anderson and Gordon, Reference Anderson and Gordon1982; Shaw et al. Reference Shaw, Grenfell and Dobson1998; Wilson et al. Reference Wilson, Bjornstad, Dobson, Merler, Poglayen, Randolph, Read, Skorping, Hudson, Rizzoli, Grenfell, Heesterbeek and Dobson2002). This distribution was represented by a gamma distribution (shape=3, rate=1) adjusted to range from 0 to 1, and fixed for each host at the beginning of a simulation. Based on initial simulation results we assumed that, in the absence of intensity-dependent death, the parasite death rate was fixed at d=0·2 and in the presence of intensity-dependent death, the maximum death rate was, d max=0·5. The strength of the intensity dependence (the intensity where d ψ=d max) on the death rate was determined by varying the carrying capacity, k, relative to the maximum mean exposure, ρ max. The strongest intensity-dependence was set at k=ρ=100 and weaker intensity-dependence was explored over several orders of magnitude (k=2ρ max, 5ρ max, 10ρ max, 50ρ max, 100ρ max, 500ρ max, 1000ρ max).
For each simulation, we simulated 50 hosts with birth rate equal to death rate. We assumed that host death is independent of parasite intensity and hosts that die are replaced by an uninfected host at a fixed rate of 0·02. At the beginning of each simulation, all hosts were uninfected and at each time-step they were subject to a force of infection, drawn from a Poisson distribution with mean, ρ. We assumed that there was no time delay for parasite maturation and any parasite that established became an adult at the next time-step. Parasite sex ratio was, π=0·5. We measured our model output using the degree of aggregation parameter from Taylor's power law, b, based on a set of simulations run with mean force of infection, ρ=3, 5, 10, 20, 100. We report the middle 95% of b values from 10 000 realizations at the 5 mean force of infection values.
The effect of intensity-dependent death on parasite aggregation was examined by contrasting model realizations based on Equation (1a) and Equation (1b) with the strength of parasite intensity-dependent death rates varying with k=2ρ max, 5ρ max, 10ρ max, 50ρ max, 100ρ max, 500ρ max, 1000ρ max. We also explored the effect of the maximum death rate in model realizations of Equation (1a, k=50ρ max) with d max=0·1, 0·2, 0·3, 0·4 0·5, 0·6, 0·7, 0·8, 0·9. We further explored the effect of decreased parasite death rate on aggregation by contrasting 2 sets of realizations, one based on Equation (1a) with parasite death rate decreasing proportionally at 0·9–0·1 of d max=0·5, at 0·1 intervals and the strength of intensity dependence set with k=50ρ max. The second set contrasted model realizations based on Equation (1b, no intensity-dependent death rate) as described above from a reference death rate, d=0·2.
The effect of increased predisposition to infection was examined by contrasting 2 sets of realizations, one based on Equation (1a) with predisposition values proportionally increased 1·1–3 times at 0·1 intervals from a reference φ distribution, as described above, and the strength of intensity dependence set with k=50ρ max. The second set contrasted model realizations based on Equation (1b, no intensity-dependent death rate, d=0·2) as described above.
The effect of direct reproduction via host-self-infection was examined by contrasting 2 sets of model realizations based on Equation (2a, d max=0·5, k=500ρ max) and Equation (2b, d=0·2) with host-self-infection rate, τ=0·001, 0·002, 0·003, 0·003, 0·004, 0·005, 0·006, 0·007, 0·008, 0·009, 0·010, 0·011, 0·0125, 0·015, 0·0175, 0·02, 0·03, 0·04, 0·05. We further explored a potential trade-off between host-self-infection and the force of horizontal transmission by comparing model realizations based on Equation (2a, d max=0·5, k=50ρ max) and Equation (2b, d=0·2) across the range of host-self-infection rates described above, with mean force-of-infection, ρ, decreasing proportionally from 0·9–0·1 of ρ, at 0·2 intervals.
RESULTS
Empirical parasite abundance and variance
The abundance distribution of each host-parasite combination was an adequate fit to a negative binomial distribution and was not described well by a Poisson distribution (Table 1). We tested for differences in mean, μ, and aggregation, k, between host sexes within each parasite-host relationship and found no evidence for differential mean parasite burden between males and females in any host-parasite relationship (Table 2). There was a trend for parasites to be more aggregated in female hosts in the A. flavicollis – H. polygyrus relationship (analysis of dispersion P=0·02) and a weak trend for parasites to be more aggregated in female hosts in the P. leucopus – S. peromysci relationship (analysis of dispersion P=0·06). There was no evidence for a difference in aggregation of S. frederici in male and female A. flavicollis hosts (analysis of dispersion P>0·1). Prevalence was not different between the pinworm infections in P. leucopus and A. flavicollis (odds ratio=1·32, 95% CI [0·74, 2·36]). Prevalence was greater in H. polygyrus infection of A. flavicollis compared to S. frederici – A. flavicollis (odds ratio=2·72, 95% CI [1·89, 3·91]) and compared to S. peromysci – P. leucopus (odds ratio=3·59, 95% CI [2·23, 5·78]).
Parameter estimates and goodness of fit (GOF) statistics for Poisson and negative binomial (NB) distributions fitted to parasite abundance distribution of Syphacia-Apodemus and Heligmosomoides-Apodemus from northen Italy and Syphacia-Peromyscus from eastern United States
(N is the number of host individuals,  and û are fitted parameters of the NB distribution, ū is the observed mean parasite abundance, and the GOF p-value refers to the significance of the deviance goodness-of-fit test.)

a Prevalence of pinworms did not differ between hosts.
b Prevalence of H. polygyrus was greater that prevalence of either pinworm.
Summary comparing mean, û, and aggregation, , parameters from the negative binomial distribution for various host subsets fit to parasite abundance data from Syphacia-Apodemus and Heligmosomoides-Apodemus from northen Italy and Syphacia-Peromyscus from eastern United States
(û cp-value is the significance of the analysis of dispersion test for a common mean assuming a common k,  p-value is the significance of the analysis of dispersion test for a common k and is only performed if there is no evidence that u is different for the subsets.)

Analysis of the mean and variance of intensity using Taylor's power law revealed that the log variance versus log mean slope was significantly greater for host-pinworm relationships (b=2·82, 95% CI [2·4 4, 3·22]) compared to host-H. polygyrus relationships (b=1·82, 95% CI[1·41, 2·23]) and the previously reported b for ca. 260 host-macroparasite relationships (b=1·55+/−0·037 s.d.; Shaw and Dobson, Reference Shaw and Dobson1995) (Fig. 1).
Taylor's power law relationship indicated that the slope, b [95% CI], of the log variance to log mean abundance of parasites per host was consistently greater for pinworm parasites (open points, dashed line) compared to Heligmosomoid parasites (filled points, solid line). The dotted line indicates the log variance versus log mean slope of a wide range of host-macroparasite distributions, b=1·55 (from Shaw and Dobson, Reference Shaw and Dobson1995).

Simulation model
Simulation output of the log variance versus log mean slope, b, demonstrated that host-self-infection is necessary to increase the degree of aggregation, b, to levels that exceed the range reported for macroparasites (Shaw and Dobson, Reference Shaw and Dobson1995), as well as many other taxa (Taylor, Reference Taylor1961). Simulations that included a parasite intensity-dependent death rate showed that aggregation is constrained to levels that reflect a random distribution (b=1) of parasites per host when the intensity-dependence was very strong (Fig. 2A). The values of b rose significantly when the strengths of intensity-independence were weakened within an order of magnitude and reached b values matching the empirically range (b=1·5–1·6) when the intensity dependence was weakened by 1 or more orders of magnitude. Adjusting the maximum parasite death rate did not influence b (Fig. 2B) and all subsequent simulations including intensity-dependent death rates were run with the strength of intensity-dependence fixed at k=50ρ max and d max=0·5. Decreased parasite death rate (Fig. 2C, D) did not cause a significant change in b. Increasing predisposition to infection without intensity-dependent parasite death (Fig. 2E) resulted in a relatively slow increase in aggregation, with b becoming significantly increased over the reference simulations when predisposition to infection was 2 times greater. The increase in aggregation reached an asymptote as the relative predisposition to infection approached a 3-fold increase from the reference simulations, but at a lower value of b than simulations including host-self-infection. Increasing predisposition to infection with intensity-dependent parasite death did not significantly increase b (Fig. 2F).
Simulation realizations of the log variance versus log mean slope (b, y-axis) across a range of intensity-dependence strength, ψ k, P, parasite death rate, d, and predisposition to infection, φ, for a simulated infection (immigration) – death model of macroparasite intensity per host. The model outputs are median (lines) and 95% confidence values (shaded regions) for the aggregation parameter, Taylor's power law b, from simulations where the parameter of interest (dark shading, dashed lines) is adjusted in relation to a fixed value (light shading, dotted lines). (A) Strong intensity-dependent parasite death rates reduce aggregation and decreasing strength of intensity dependence (increasing carrying capacity, k) increases aggregation. The strength of intensity dependence (x-axis) is represented by the carrying capacity of worms per host relative to the maximum simulated force of infection, ρ max; with the strongest intensity dependence at k=1=ρ max. (B) The maximum death rate in simulations with intensity-dependent death has no effect on aggregation (ψ k=50ρmax). (C) Decreasing the relative death rate has no effect on aggregation without intensity-dependent dependence (dashed line relative to d=0·2). (D) Decreasing the relative death rate has no effect on aggregation with intensity-dependent death (dashed line relative to d max=0·5, ψ k=50ρmax). (E)–(F) Increasing predisposition to infection, φ, increased aggregation, b, in simulations without intensity-dependent parasite death (E, d=0·2), but not in simulations with intensity-dependent death rates (F, d max=0·5, ψ k=50ρmax).

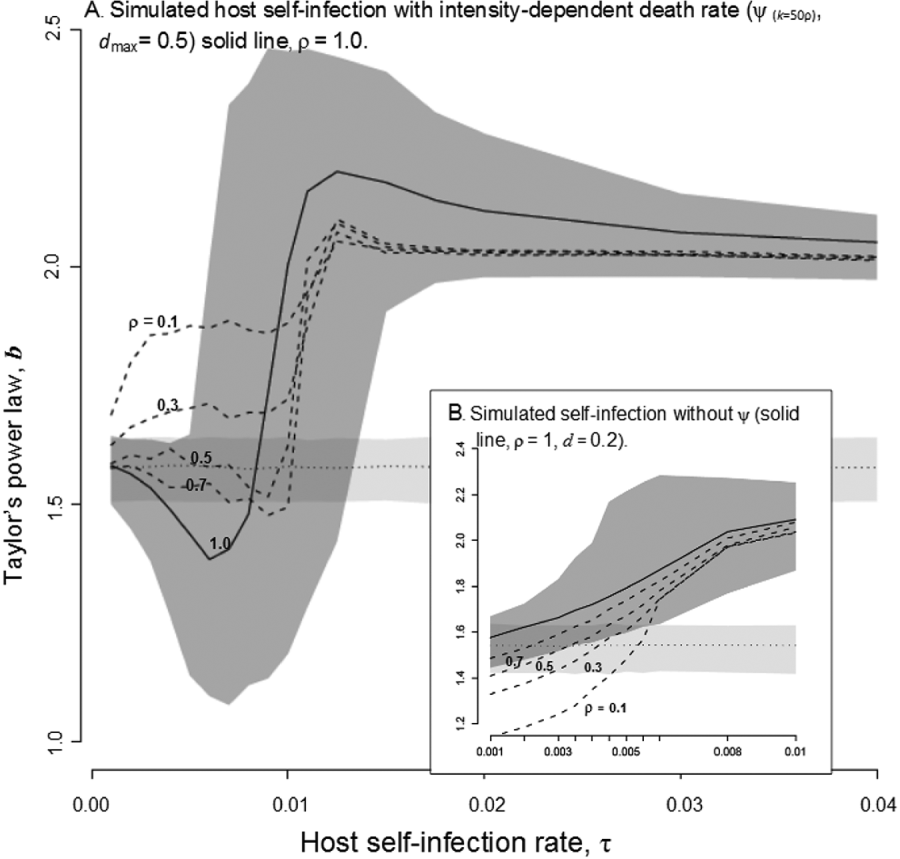
Simulations that included host-self-infection yielded the highest aggregation levels, provided that host-self-infection rate exceeded 0·01 (Fig. 3A) or 0·006 in the absence of intensity-dependent death (Fig. 3B). In simulations with intensity-dependent death rates, low-levels of self-infection decreased aggregation slightly but, as host-self-infection increased, b increased and significantly exceeded the level of aggregation of simulations without host-self-infection (Fig. 3A). As the relative force-of-infection decreased, the initial decrease in b with self-infection was dampened and, at the lowest relative force-of-infection, b increased significantly over reference simulations at host-self-infection rates approximately one order of magnitude lower compared to simulations with equal force-of-infection (Fig. 3A). Without intensity-dependent death rates, host-self-infection generated high levels of aggregation at host-self-infection levels that were an order of magnitude weaker than simulations with intensity-dependent death (Fig. 3B). The rate of host-self-infection necessary to increase b over reference simulations without intensity-dependent death increased as the relative force-of-infection decreased, but did not change the shape of host-self-infection versus b relationship (Fig. 3B).
Simulation realizations of the log variance versus log mean slope (b, y-axis) across a range of host-self-infection rates, τ. The model outputs are median (lines) and 95% confidence values (shaded regions) for of the aggregation parameter, b, from simulations that include a host-self-infection process (dark shading, solid lines) compared to the 95% confidence values around b for a reference simulation with no host-self-infection (dotted line, light shading). (A) Model simulations that included parasite-intensity-dependent death (k=50ρ max, d max=0·5) with median b outputs from simulations with decreasing force of infection (dashed lines, ρ=0·1, 0·3, 0·5, 0·7). (B) Model simulations without parasite-intensity-dependent death (d=0·2) with median b outputs from simulations with decreasing force of infection (dashed lines, ρ=0·1, 0·3, 0·5, 0·7).
DISCUSSION
The empirical data for mouse gastrointenstinal parasites falls within the degree of aggregation reported by Shaw and Dobson (Reference Shaw and Dobson1995), although the degree of aggregation was consistently greater in the pinworm-rodent relationships; both within host samples and between two ecologically similar rodent hosts. The consistently greater aggregation in pinworm species is an exception to the general constraints on aggregation in parasites and provides an opportunity to explore the mechanisms that drive aggregation patterns through examination of life-history characteristics. We proposed 3 possible mechanisms related to pinworm life-history that could drive larger increases in variance with increasing mean (Taylor's b): (1) host self-infection, (2) increased host predisposition to infection and (3) decreased strength of parasite intensity dependence and decreased absolute parasite death rate. We used stochastic simulations to evaluate what life-history characteristic or combination of characteristics could lead pinworm aggregation to be an exception to Taylor's power law and also mimic empirical pinworm aggregation. In line with our prediction, host self-infection had the strongest effect on generating high aggregation and was the only characteristic that resulted in the slope of the log-variance versus log-mean, b, in our simulations increasing at a magnitude that was similar to the relative empirical difference between aggregation of pinworm and non-pinworm nematodes. Strong intensity-dependence parasite death decreased aggregation and decreased parasite death rate had no significant effect. Increasing predisposition to infection had a small effect at the greatest relative predisposition levels we simulated, but that b value still did not approach the levels of aggregation empirically measured from pinworms. Host-self-infection is dependent on the current parasite population size and, thus, creates heterogeneous rates of within-host population growth over a collection of hosts. The other mechanisms that we tested, decreased death rate and increased predisposition to infection, did not increase the variance to mean slope, even when combined with intensity-dependent parasite death rates; which creates heterogeneous rates of population decline. In using pinworm life-history as a template for our simulation, we feel that our assumption is reasonable given that pinworm parasites do not have the type of interaction with host tissues that evoke strong immune responses (Parker et al. Reference Parker, Ball and Chubb2009).
We were also able to obtain insights into the degree of host-self-infection that is needed to increase aggregation to the high levels we observed. Shortly after Talyor et al. (Reference Taylor, Woiwod and Perry1978) established the constancy of the variance to mean relationship, others determined that stochasticity in population vital rates could lead to the observed aggregation patterns, with the exact level of aggregation being a balance between the variability in these population processes (Anderson et al. Reference Anderson, Gordon, Crawley and Hassell1982). Our simulation revealed that only a small proportion (1–2%) of fecundity devoted towards host self-infection is required to increase b above the expected aggregation levels and then aggregation quickly asymptotes with additional host self-infection rates. When the relative force of infection (immigration) of self-infecting parasites was reduced, b decreased at the smallest values of host-self-infection rates, but the degree of aggregation still increased over the expectations at higher rates of host-self-infection. Regardless of the relative decrease in force of infection, the level of host-self-infection required to increase b, was small, indicating that even a small additional source of within-host population growth can increase aggregation of individuals.
The characterization of an aggregated macroparasite distribution is no surprise given the vast number of epidemiological reports indicating such a similar degree of aggregation using statistical distributions and Taylor's power law (Shaw and Dobson, Reference Shaw and Dobson1995; Shaw et al. Reference Shaw, Grenfell and Dobson1998). Indeed, the expectation that any distribution of organisms is aggregated, within a relatively narrow degree, is hardly surprising according to Taylor's power law (Taylor, Reference Taylor1961). The aggregated distribution of individuals within populations is usually attributed to a balance of population processes that have evolved within a species. The generally narrow range of aggregation among macroparasites, suggests that the underlying evolutionary processes that constrain the degree of aggregation are similar across many different host-parasite relationships (Shaw and Dobson, Reference Shaw and Dobson1995). Generally, the constraint on the upper limit of aggregation is attributed to parasite virulence or host response to parasites, where the tail of the aggregated distribution is removed when parasites at high intensities kill their host or evoke an immune response that increases parasite mortality. Indeed, our simulations revealed that aggregation can be greatly reduced with strong intensity-dependent parasite death rate. One of the presumed benefits of virulence is increased body size and fecundity, primarily attributed to tissue migration in macroparasites (Read and Skorping, Reference Read and Skorping1995). Pinworms do not require migration through host tissues and are relatively small-bodied compared to other parasitic nematodes infecting the same host, and hence less fecund. Reports of female pinworm parasites (genus, Syphacia) of other mouse species are ca. 2–4 mm (Chan, Reference Chan1952; Hussey, Reference Hussey1957), while H. polygyrus females are ca. 20–30 mm. in similar-sized hosts (Luong et al. Reference Luong, Perkins, Grear, Rizzoli and Hudson2010). Pinworm parasites appear to have been able to escape the cost of high aggregation via life-history traits that reduce their impact on hosts, and their evolutionary independence from other parasitic nematodes suggests that the pinworm's life-history and resulting aggregation is indeed an exception among macroparasites (Adamson, Reference Adamson1994).
In examining the patterns and processes of pinworm aggregation, we present one mechanism that can generate higher than expected aggregation. The addition of a within-host birth process, even at a small magnitude, to a conventionally immigration-death population dynamic appears sufficient to increase aggregation. Previous attempts to elucidate a general mechanism that generates the narrow range of aggregation in animal populations have evoked complex explanations such as spacing behaviour (Taylor and Taylor, Reference Taylor and Taylor1977), dispersal (Hanski, Reference Hanski1980), and inter-specific community interactions (Kilpatrick and Ives, Reference Kilpatrick and Ives2003). While such complex explanations are able to characterize the general constancy of empirical variance-mean relationships, we offer an explanation based on basic life-history characteristics that can explain the general observed aggregation patterns, as well as an exception to the rule.
ACKNOWLEDGEMENTS
This project was funded by NSF grant EF-0520468 and collection of parasites from Italy by the Autonomous Province of Trento, under grant ECODIS. We thank A. Rizzoli and the staff at the Centre for Alpine Ecology in Trentino for Apodemus data collection and S. Perkins for data and helpful discussions about mouse worms. We thank K. Vandegrift for collection of much of the Pennsylvania data and C. Stack for help with simulation coding.



