INTRODUCTION
The tiger puffer Takifugu rubripes (Harada and Abe, Reference Harada and Abe1994) is an important cultured fish in Japan, where it is a prized delicacy. Puffer fish have evolved impressive defences against predators, including a tough skin, the ability to expand its size several fold when threatened, and the production of the deadly nerve poison tetrodotoxin (Koizumi et al. Reference Koizumi, Levine and Brooks1967). However, the tiger puffer has a high mortality rate in aquaculture (Hirazawa et al. Reference Hirazawa, Ohtaka and Hata2000) from attack by the specific monogenean parasite Heterobothrium okamotoi (Ogawa, Reference Ogawa1991). The body mucus pH of tiger puffer is low compared with other fishes; this unique pH of the tiger puffer has been recognized as an important factor to identify hosts by H. okamotoi oncomiracidia (Hirazawa et al. Reference Hirazawa, Oshima, Mitsuboshi and Yamashita2003). H. okamotoi is problematic because of its obvious pathogenicity and low susceptibility to chemicals (Ogawa and Yokoyama, Reference Ogawa and Yokoyama1998). Free-swimming oncomiracidia hatch 6–10 days after laying at 20°C, attach to the gills and grow on the gill filaments, then mature on the branchial cavity wall (Ogawa and Inouye, Reference Ogawa and Inouye1997). Maturation of H. okamotoi takes approximately 49 days from attachment to the gill at water temperature 16·8 to 26·8°C, with an average of 21·1°C. This parasite feeds on the host's blood, causing death of the fish by anaemia (Ogawa and Inouye, Reference Ogawa and Inouye1997).
Specific antibodies against adult H. okamotoi in naturally infected tiger puffer have been detected (Wang et al. Reference Wang, Kim, Sameshima and Ogawa1997; Nakane et al. Reference Nakane, Ogawa, Fujita, Sameshima and Wakabayashi2005). However, whether humoral antibodies can protect the fish from re-infection by the parasites remains unknown.
This study investigated if infection by H. okamotoi induces production of specific antibodies against oncomiracidia and their cilia, larvae on the gills and adults on the branchial cavity wall. It also investigated if specific antibody production induced by immunization with H. okamotoi oncomiracidium antigens participates in protection against H. okamotoi.
MATERIALS AND METHODS
Fish rearing
Rearing methods were used to establish the flow rate, aeration and feeding rate at our laboratory (Hirazawa et al. Reference Hirazawa, Oshima, Mitsuboshi and Hata2001). An aerated tank (100 litre, 200 litre or 20-metric tons) containing tiger puffer was supplied with seawater (approximately 1·2 litre/min/100 litre volume of tank) that was filtered through sand and was ultraviolet (UV)-irradiated (Flonlizer 4 litre unit; approximately 50 000 μw·s/cm2, Chiyoda Kohan, Ltd, Japan). The mean saline content, pH and chemical oxygen demand of seawater were approximately 34 ppt, 8·1 and 1·0 mg/litre, respectively, throughout the year. The fish were fed a normal expanded 3 mm pellet diet (basal diet; Nippon Suisan, Japan) twice a day at a feeding rate of 3% body weight daily.
Uninfected fish
Tiger puffer (500 individuals), weighing approximately 66 g hatched at our laboratory were maintained in a concrete tank with 20-metric tons capacity. The gills and skin surface of 10 fish were sampled randomly and were examined under a microscope to confirm the fish were not infected by parasites before each experiment.
Parasites
The source of H. okamotoi and its propagation on the tiger puffer has been described previously (Hirazawa et al. Reference Hirazawa, Oshima, Mitsuboshi and Hata2001). Parasite eggs found attached to the drainpipe and the aeration tube of a tank in which tiger puffer were maintained were removed from the tank and were incubated in a 300 ml plastic beaker containing seawater filtered through sand at 20°C for 8–10 days in the dark. The seawater used for incubation was changed every day. Oncomiracidia that hatched within 12 h were used for the experiments. To collect larvae, excised gills of infected fish were put into a tissue culture dish (diameter 9 cm) with 50 ml of seawater and were incubated for 3 h at room temperature and the larvae (body length: 2–4 mm) released from the gills were collected by using a Pasteur pipette, and then transferred to a 1·5 ml microfuge tube. The larvae were centrifuged at 1000 g for 2 min at 4°C to remove seawater and were washed 3 times with seawater filtered through a 450 nm membrane. The collected larvae were stored at −80°C until used for the experiments. Adult parasites were removed from the branchial cavity wall of the infected tiger puffer, were placed in a tissue-culture dish (diameter 9 cm) containing seawater filtered through sand and were washed 3 times with the filtered seawater. The parasites were wiped off, were collected into a 1·5 ml microfuge tube and were stored at −80°C until used for the experiments.
Preparation of experimentally infected fish with H. okamotoi to analyse parasite specific antibodies and infection levels
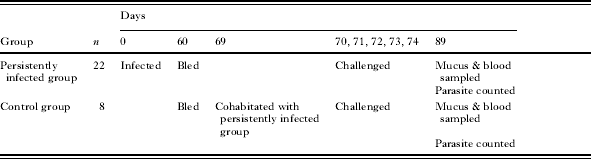
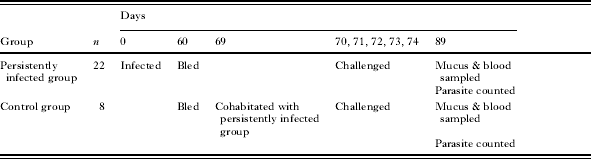
Thirty uninfected fish were randomly divided into 2 groups: 1 group of 22 fish (named persistently infected group after infection) was transferred to a tank of 200 litres capacity, and a group (naïve fish: control group) of 8 fish was transferred to a tank of 100 litres capacity (Table 1). The fish were tagged to recognize them individually. A column-shaped transponder (TX1400L: Electronic ID, Inc., USA), pre-programmed with an individual ID code and of length 11 mm and thickness of 2·1 mm, was injected into the back side muscle of each fish. When the transponder was activated by a low-frequency radio signal, it transmitted the ID code to a reader (Mini portable reader MPR: Electronic ID, Inc., USA). The fish were acclimated for a week. The tanks were aerated and were supplied with sand-filtered and UV-irradiated seawater. The fish were fed the diet, and the temperature was maintained at 24±1°C by using a heating device, throughout the experiment. After acclimation, 10 000 oncomiracidia were put into the tank of the persistently infected group, and the seawater supply was discontinued for 1 h, to complete the infection. To prevent autoinfection by the next generation of parasites, spawned parasite eggs found attached to the drainpipe and the aeration tube were removed from the tank of the persistently infected group every 3 days after the parasites reached maturation and had started to spawn (30 days after the fish were exposed to oncomiracidia). The eggs are connected together at both ends through the filament and form a long egg string. (Ogawa, Reference Ogawa1997) and easily entangle with the drainpipe and the aeration tube. All fish in both groups were bled from the caudal vein 60 days after exposure to oncomiracidia. The fish in the control group were then transferred to the tank of the persistently infected group on day 69 and the 2 groups were then co-habitated. At 70, 71, 72, 73, 74 days after start of the experiment, 8000 oncomiracidia were put into the tank every time, and the seawater supply was discontinued for 1 h. On day 89, a sample of cutaneous mucus was collected from each fish by gently rubbing the surface of the fish, a blood sample was taken, and then the number of larval parasites on the gills and the number of adult parasites on the branchial cavity wall in all fish were counted. The collected sera were heat-inactivated at 56°C for 30 min, and the mucus was stored at −80°C until used for the experiments. The number of larval parasites on the gills was tested using the T test between the persistently infected group and the control group. A probability level of P<0·05 was considered significant. All calculations were done by using the StatView statistical software version 4.5 (Abacus Concepts, Inc., USA).
Time-line diagram of preparation of experimentally infected fish with Heterobothrium okamotoi to analyse parasite-specific antibodies and infection level
Effect of fish serum on oncomiracidia
The assays were performed essentially using the method of Clark et al. (Reference Clark, Dickerson and Findly1988). Sand-filtered and UV-irradiated seawater (990 μl) containing approximately 100 oncomiracidia was added to each well of a 24-well tissue-culture plate. Fish serum (10 μl) was added to each well. The behaviour of the oncomiracidia was observed under a reversed-microscope for 1 h at 25°C, after which, the number of non-motile oncomiracidia was counted in each well. Formalin (50 μl) was added to each well and the total number of oncomiracidia was counted. The proportion of non-motile oncomiracidia was calculated as n1/n2×100%, where n1 is the number of non-motile oncomiracidia after 1 h incubation and n2 is the total number of oncomiracidia. The fish serum in each well was assayed in triplicate to calculate the degree of agglutination.
Antigen preparation for ELISA
The oncomiracidia (body length: approximately 200 μm) were concentrated by using a nylon filter (Millipore, USA), at 4·7 cm diameter and 20 μm mesh opening; the oncomiracidia were trapped when seawater containing the hatched parasites was passed through the nylon filter. The collected oncomiracidia were washed 3 times with seawater filtered through a 450 nm membrane filter, transferred to a 1·5 ml microfuge tube and centrifuged at 2000 g for 5 min at 4°C to remove seawater. Approximately 50 000 oncomiracidia in 500 μl of phosphate-buffer saline (PBS) containing 0·1% sodium dodecyl sulfate (SDS) were sonicated for 5 min on ice by using an ultrasonic processor (7040 Ultrasonic Processor; Seiko Instruments, Inc., USA). The homogenate was stored at −80°C until used for enzyme-linked immunosorbent assay (ELISA) and immunization of fish. To obtain cilia from the oncomiracidia, the nylon filter containing collected oncomiracidia was transferred to a culture dish (diameter 9 cm) with 25 ml of 10% seawater (3·4 ppt salinity) for 1 h. The captured oncomiracidia shed their ciliated epidermal cells and only ciliated epidermal cells passed through the mesh of the nylon filter. The 10% seawater containing ciliated epidermal cells, as confirmed by observation under a microscope, was transferred to a 2 ml microfuge tube and centrifuged at 16 000 g for 5 min at 4°C to remove the 10% seawater. The ciliated epidermal cells were stored at −80°C until used for ELISA. Larvae (118) in 500 μl of PBS containing 0·1% SDS and 18 adults in 500 μl of PBS containing 0·1% SDS were sonicated. The procedures for these homogenates were the same as for the oncomiracidia.
Measurement of protein concentration
Sample protein concentrations were measured using the method of Bradford with a Bio-Rad Protein Assay kit (Bio-Rad Laboratories, Germany) (Bradford, Reference Bradford1976). Bovine serum albumin (BSA; Sigma-Aldrich, USA) was used as the protein standard to construct a calibration curve.
SDS-polyacrylamide gel electrophoresis (SDS-PAGE)
SDS-PAGE using a discontinuous buffer system was used with several types of gradient gels (Daiichi Pure Chemicals, Japan) (Laemmli, Reference Laemmli1970). Gels were stained with Coomassie brilliant blue. The molecular masses were estimated by comparing the migrations of the protein of interest with commercial molecular weight size standards (Bio-Rad Laboratories, Germany).
Preparation of rabbit anti-tiger puffer IgM
Pooled sera from pre-immune and uninfected tiger puffer were fractionated by ammonium sulfate precipitation and were dialysed against 10 mm PBS. Crude Ig fractions were loaded onto a Sephacryl S-300 HR (Amersham Pharmacia Biotech, USA) gel filtration chromatography, were eluted with 10 mm PBS (pH 7·2) at a flow rate of 0·216 ml/min and were monitored at absorbance 280 nm. Fractions thought to contain IgM heavy chains, judged from the molecular mass (approximately 75 kDa) of the protein band and IgM light chains judged from the molecular mass (approximately 25 kDa) by using SDS-PAGE were collected. The 25 and 75 kDa excised bands were collected and were used for rabbit immunization.
Rabbit immunization
Antisera against tiger puffer IgM were produced in female Japanese White rabbits. Five inoculations each of 400 μg (first time only) or 200 μg of tiger puffer IgM were given subcutaneously with Freund's incomplete adjuvant (FCA; BD Diagnostic Systems, USA) in multiple dorsal-lumbar sites at 2-week intervals. Blood was drawn at 8 weeks after the initial injection, coagulated at 4°C and was then centrifuged at 300 g for 5 min at 4°C. The sera were collected, inactivated by heating at 56°C for 30 min and stored at −80°C.
ELISA
ELISA was done essentially by using the method of Wang et al. (Reference Wang, Kim, Sameshima and Ogawa1997). Each prepared antigen was thawed and suspended in PBS and the protein concentration was adjusted to 30 μg/ml. The antigen solution was added to each well of 96-well ELISA plates (Greiner Labortechnik, France) and the plates were incubated at room temperature for 2 h. After blocking non-specific protein-binding sites with Block Ace (Dainippon Pharmaceutical Co. Ltd, Japan) at room temperature for 2 h, fish serum (1:80) or mucus (protein concentration: 5 mg/ml) diluted in Block Ace containing 0·1% (v/v) Tween 20 (Sigma-Aldrich, USA) was added. The plates were incubated at room temperature for 2 h, and were washed 4 times with 0·1% (v/v) Tween 20 in PBS (PBS-T). Rabbit immunoglobulin G (IgG) anti-tiger puffer IgM diluted 1:6000 (1 μg/ml) in PBS-T was added and the mixture incubated at room temperature for 2 h. After washing the plates with PBS-T, goat anti-rabbit IgG conjugated with alkaline phosphatase (AP-conjugated goat anti-rabbit IgG; Kirkegaard & Perry Laboratories, Inc., USA) diluted 1:10 000 (100 ng/ml) in PBS-T was added and the plates were incubated for 2 h at room temperature. After washing with PBS-T, the plates were analysed for alkaline phosphatase using alkaline-phosphatase substrate (Bio-Rad Laboratories, Germany). The absorbance was detected at 405 nm by using TECAN Rainbow Thermo (Wako Pure Chemical Industries, Ltd, Japan) according to the manufacturer's instructions. The background absorbance value at 405 nm (OD405) was defined as the average signal from 3 wells incubated with blocking solution in the absence of primary antibody. Each fish serum or mucus was assayed in triplicate. The OD405 value was tested by using the t-test between the control group and the other groups. A probability level of P<0·05 was considered significant.
Antigen preparation for immunization of fish
Approximately 50 000 oncomiracidia in 500 μl of PBS were sonicated for 2 min on ice by using a ultrasonic processor (VC 130, Sonic & Materials, Inc., Connecticut, USA). The ciliated epidermal cells, collected from approximately 300 000 oncomiracidia, in 500 μl of PBS were also sonicated at 40% for 2 min on ice. The homogenate was stored at −80°C until used for immunization of fish.
Immunization of fish and challenge trial
Eighteen uninfected fish were transferred to a tank of 200 litres capacity and were tagged to recognize them individually. The fish were acclimatized for 1 week. The tanks were aerated and were supplied with seawater that had been sand-filtered and UV-irradiated. The fish were fed the diet and the temperature was maintained at 24±1°C by using a heating device throughout the experiment. After acclimatization, the fish were immunized by intraperitoneal injection with a 1:1 (v/v) emulsion of FCA at a dose of 0·5 mg/kg fish body weight of antigen fractions: ciliated epidermal cells homogenate (n=4), oncomiracidia homogenate (n=6) and BSA (n=8; negative control). At 20 days after the first immunization, an intraperitoneal booster injection was given at the same antigen dose with a 1:1 (v/v) emulsion of Freund's incomplete adjuvant (FIA; BD Diagnostic Systems, USA). All fish in the immunization experiments were bled at 14 and 44 days after the booster injection to obtain small serum samples. At 54, 55, 56, 57, 58 days after the booster injection, 8000 oncomiracidia were put into the tank every time, and the seawater supply was discontinued for 1 h. At 75 days after the booster injection, a sample of cutaneous mucus was collected from each fish by gently rubbing the surface of a fish and a blood sample was taken. Then the number of parasites on the gills in all fish was counted. The collected sera were heat-inactivated at 56°C for 30 min, and the mucus was stored −80°C until used for the experiments. The number of larval parasites on the gills was tested using the t-test between the negative control group and the other groups. A probability level of P<0·05 was considered significant.
Immunoblotting
Protein bands from SDS-PAGE were electroblotted onto Pall Fluoro Trans W Membranes (Nippon Genetic Co. Ltd, Japan) by using a Trans-Blot SD Semi-Dry Transfer Cell (Bio-Rad Laboratories, Germany) at 2 mA/cm2 for 40 min. The filters were blocked by incubation for 2 h at room temperature with Block Ace containing 0·1% (v/v) Tween 20. The filters were then incubated for 2 h with diluted fish sera (1:10). Bound fish antibodies were detected with a 1:4000 dilution of rabbit IgG anti-tiger puffer IgM for 2 h, and then by a 1:10 000 dilution of AP-conjugated goat anti-rabbit IgG for 1 h. The filters were then developed in nitroblue tetrazolium (NBT)/5-bromo-4-chloro-3-indolyl phosphate (BCIP) substrate (Roche Diagnostics, Germany). All incubations were done at room temperature.
RESULTS
Agglutination and immobilization of oncomiracidia in sera of fish experimentally infected with H. okamotoi
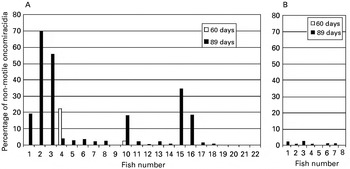
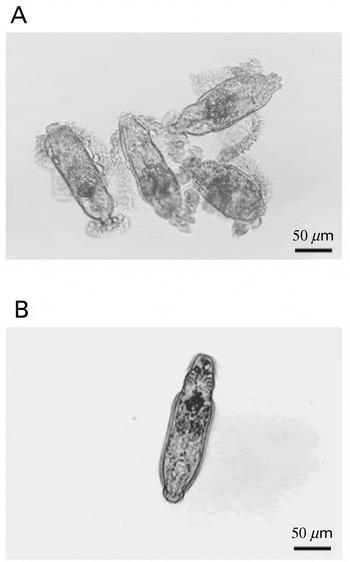
Production of immobilization antibodies against H. okamotoi oncomiracidia in persistently infected fish was examined. Sera of infected fish in the persistently infected group immobilized H. okamotoi oncomiracidia, especially at 89 days after exposure to the oncomiracidia, but the degree of agglutination of the sera varied among the fish (Fig. 1A). The affected oncomiracidia gradually stopped swimming and they shed their ciliated epidermal cells. Then the cilia became attached to each other to form aggregations within 1 h after starting the incubation (Fig. 2A). Oncomiracidia treated with sera of the control group were not affected during the observation (Figs 1B and 2B).
Agglutination activity of sera from tiger puffer against Heterobothrium okamotoi oncomiracidia. Oncomiracidia treated with sera from persistently infected fish (A) and from control fish (B). All fish in both groups were bled at 60 days and 89 days after exposure of the persistently infected group to oncomiracidia. Oncomiracidia were incubated for 1 h at 25°C in 1:100 dilution of each serum. The affected oncomircidia stopped swimming gradually and began to form large aggregations within 1 h after starting the incubation. The proportion of non-motile oncomiracidia in each well of a culture plate was calculated as n 1/n 2×100%, where n 1 is the number of non-motile oncomiracidia at 1 h after starting incubation and n 2 is the total number of oncomiracidia.

Oncomiracidia of Heterobothrium okamotoi treated with serum from persistently infected fish bled at 89 days (A). The parasites were incubated for 1 h at 25°C in 1:100 dilution of the serum. The affected oncomiracidia stopped swimming gradually, shed their ciliated epidermal cells, and then the cilia became attached to each other to form aggregations within 1 h after starting the incubation. Oncomiracidium treated with serum from control fish (B). The oncomiracidia were not affected during the observation.

Antibody levels in sera and mucus of fish experimentally infected with H. okamotoi
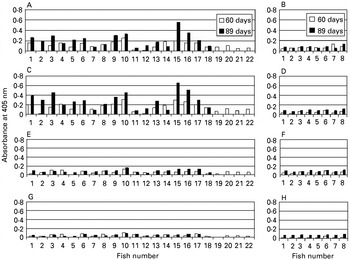
Production of specific antibodies against oncomiracidia or their cilia, larvae on the gills and adult H. okamotoi on the branchial cavity wall in infected fish was examined by using ELISA. In the case of oncomiracidia or their cilia used for the ELISA antigen, the OD405 values of sera of the infected group increased compared with the control group, especially at 89 days after exposure (Fig. 3A and B (cilia), C and D (oncomiracidia)). The OD405 values of the sera of infected fish varied among the fish but they, and the degree of agglutination, were higher. The mean OD405 value of sera at 89 days was 0·212±0·126 and 0·076±0·027 for the infected group and control group, respectively, for cilia as the ELISA antigen, and was 0·286±0·162 and 0·019±0·014 for the infected group and control group, respectively, for oncomiracidia as the ELISA antigen. These mean OD405 values of the infected group were significantly higher than for the control group (P<0·01). However, the OD405 values of sera of infected fish did not increase when the larvae and adult parasites were used as the ELISA antigens (Fig. 3E–H).
ELISA values of sera from tiger puffer against each antigen of Heterobothrium okamotoi. (A) Values of sera from persistently infected fish against sonicated cilia of oncomiracidia. (B) Values of sera from control fish against sonicated cilia of oncomiracidia. (C) Values of sera from persistently infected fish against sonicated oncomiracidia. (D) Values of sera from control fish against sonicated oncomiracidia. (E) Values of sera from persistently infected fish against sonicated larvae. (F) Values of sera from control fish against sonicated larvae. (G) Values of sera from persistently infected fish against sonicated adults. (H) Values of sera from control fish against sonicated adults.

The OD405 values of mucus in the infected group did not increase compared with the control group fish at 89 days after exposure. The mean OD405 value of mucus at 89 days was 0·053±0·023 and 0·059±0·015 for the infected group and control group, respectively, for cilia as the ELISA antigen. The mean OD405 value was 0·055±0·025 and 0·046±0·015 for the infected group and control group, respectively, for oncomiracidia as the ELISA antigen. The difference in mean OD405 values of the mucus between both groups was not statistically significant.
Infection levels in fish experimentally infected with H. okamotoi
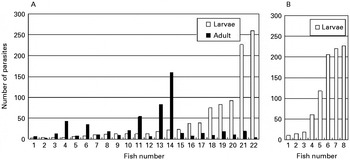
The existence of partial acquired protection against H. okamotoi oncomiracidia by infected fish was examined. Persistently infected fish were induced to have adult parasites by first exposure to oncomiracidia after acclimatization for 1 week to start the experiment. Larval parasites on the gills were induced by a second exposure to oncomiracidia after cohabitation with uninfected control fish because the spawned parasite eggs were removed from the tank of the infected group every 3 days after the parasites reached maturation, to prevent autoinfection of the next generation. Therefore, the larval parasite intensity of the persistently infected group was comparable with the control group. The number of the parasites varied among the fish in both groups (Fig. 4). However, the mean number of larvae was 43·9±68·1 and 109·0±96·2 for the persistently infected group and control group, respectively, and the mean number of parasites was significantly higher in the control group (P<0·05). This result indicates that tiger puffer acquired partial protection against H. okamotoi.
Infection level of Heteroboturium okamotoi of persistently infected fish (A) and control fish cohabitated with the persistently infected fish (B). Control group fish cohabitated with infected fish at 69 days after their exposure to oncomiracidia, and then they were exposed to H. okamotoi oncomiracidia at 70–74 days. Mean number of larvae was 43·9±68·1 and 109·0±96·2 for persistently infected group and control group, respectively; the mean number of parasites was significantly higher in the control group (P<0·05).

Agglutination and immobilization of oncomiracidia in sera from fish immunized with sonicated H. okamotoi
Tiger puffer acquired partial protection against H. okamotoi as shown in this study. However, whether humoral antibodies, which have agglutination and immobilization activities against oncomiracidia and their cilia participate in protection is not clear. Fish were injected with sonicated H. okamotoi oncomiracidia or their cilia to assess whether sera from the immunized fish lead to agglutination of the oncomiracidia. Sera from immunized fish immobilized H. okamotoi oncomiracidia at 14, 44 and 75 days after a booster immunization (Fig. 5). Oncomiracidia treated with sera from fish immunized with BSA (negative control) were not affected during the observation (Fig. 5).
Agglutination activity of sera from tiger puffer against Heterobothrium okamotoi oncomiracidia. Oncomiracidia treated with sera from tiger puffer immunized with sonicated cilia of H. okamotoi, sonicated oncomiracidia, or BSA plus FCA. All fish were bled on 14 days, 44 days and 75 days after the booster immunization. Oncomiracidia were incubated for 1 h at 25°C in 1:100 dilution of each serum. The affected oncomircidia ceased to swim gradually and began to form large aggregations within 1 h after starting the incubation. The proportion of non-motile oncomiracidia in each well of a culture plate was calculated as n 1/n 2×100%, where n 1 is the number of non-motile oncomiracidia at 1 h after starting incubation and n 2 is the total number of oncomiracidia.

Antibody levels in sera and mucus of fish immunized with H. okamotoi oncomiracidia or their cilia
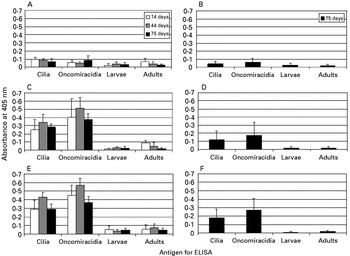
Production of specific antibodies against H. okamotoi oncomiracidia or their cilia, larvae on the gills and adult H. okamotoi on the branchial cavity wall in immunized fishes was examined by ELISA. When oncomiracidia or their cilia were used for ELISA antigens, the OD405 values of sera from fish immunized with oncomiracidia or their cilia increased compared with negative control group fish at 14, 44 and 75 days after a booster immunization (Fig. 6A, C, E). The mean OD405 values of fish immunized with sonicated oncomiracidia or their cilia were significantly higher than for the negative control group (P<0·01). The OD405 values of mucus of fish immunized with sonicated oncomiracidia or their cilia increased compared with negative control group fish at 75 days after a booster immunization when oncomiracidia or their cilia were used as ELISA antigens (Fig. 6B, D, F) and their mean OD405 values were significantly higher than for the negative control group (P<0·01). The OD405 values of sera and mucus of fish immunized with sonicated oncomiracidia or their cilia did not increase against larvae and adult parasites antigens for ELISA (Fig. 6A–F).
ELISA values of sera from tiger puffer immunized with sonicated oncomiracidia or their cilia plus FCA or with BSA plus FCA against each antigen of Heterobothrium okamotoi. (A) Values of sera from fish immunized with BSA. (B) Values of mucus from fish immunized with BSA. (C) Values of sera from fish immunized with sonicated cilia. (D) Values of mucus from fish immunized with sonicated cilia. (E) Values of sera from fish immunized with sonicated oncomiracidia. (F) Values of mucus from fish immunized with sonicated oncomiracidia. All fish were bled at 14, 44 and 75 days after a booster immunization.

Infection levels in fish immunized with H. okamotoi oncomiracidia or their cilia
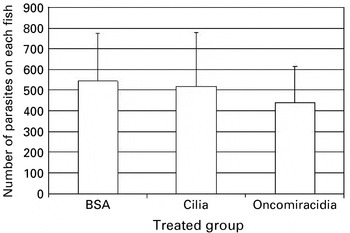
Production of specific antibodies against H. okamotoi oncomiracidia and their cilia in persistently infected fish and fish immunized with sonicated oncomiracidia or their cilia was shown previously in this study. Immunized fish were exposed to H. okamotoi oncomiracidia to determine if humoral antibody production participates in protection of fish. The parasite counts of fish showed no significant difference between groups immunized with sonicated H. okamotoi oncomiracidium antigens and groups treated with BSA (negative control) (Fig. 7).
Infection level of Heterobothrium okamotoi on fish immunized with sonicated H. okamotoi oncomiracidia or sonicated cilia plus FCA, or with BSA plus FCA. Fish were exposed to H. okamotoi oncomiracidia at 54–58 days after a booster immunization. The parasite counts between fish groups showed no significant difference.

Immunoblotting
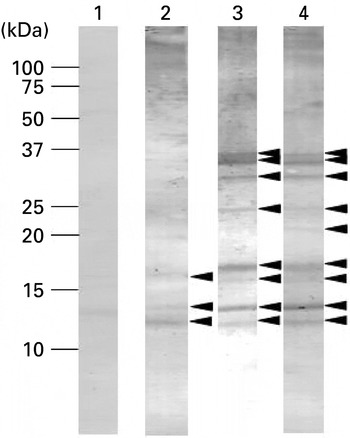
Western blot results indicated that sera from experimentally infected fish and fish immunized with homogenized H. okamotoi oncomiracidia recognized similar antigenic bands, except ∼21 kDa (Fig. 8): ∼11, ∼12, ∼16, ∼17, ∼21, ∼24 ∼31, ∼34 and ∼36 kDa (sera from experimentally infected fish); ∼11, ∼12, ∼16, ∼17, ∼24 ∼31, ∼34 and ∼36 kDa (sera from fish immunized with homogenized H. okamotoi oncomiracidia). Western blot results also recognized partially similar antigenic bands in serum from fish immunized with homogenized cilia of oncomiracidia at ∼11, ∼12, ∼16 kDa, from experimentally infected fish and fish immunized with sonicated H. okamotoi oncomiracidia (Fig. 8).
Immunoblot analyses of Heterobothrium okamotoi oncomiracidia from tiger puffer sera. Five μg of oncomiracidia were resolved by SDS-PAGE on 15–25% polyacrylamide gradient gels and were electro-blotted onto Pall Fluoro Trans W Membranes. Sera: lane 1, serum against BSA as a negative control; lane 2, serum against sonicated cilia of H. okamotoi oncomiracidia; lane 3, serum against sonicated H. okamotoi oncomiracidia: lane 4, serum from persistently infected fish for 89 days. The signal was developed with NBT-BSIP. Relative molecular masses of standard markers are indicated on the left. The position of the antigen is indicated with arrows on the right side of each panel.

DISCUSSION
Antibodies specific to gill monogenean antigens have been detected (Vladimirov, Reference Vladimirov1971; Buchmann, Reference Buchmann1993; Wang et al. Reference Wang, Kim, Sameshima and Ogawa1997; Mazzanti et al. Reference Mazzanti, Monni and Varriale1999; Rubio-Godoy et al. Reference Rubio-Godoy, Sigh, Buchmann and Tinsley2003) when homogenized adult and larval parasites were used for ELISA or immunoblotting. This study provided evidence for the production of specific antibodies in persistently infected tiger puffer against the gill-inhabiting monogenean H. okamotoi oncomiracidia and their cilia. These antibodies led to agglutination of the oncomiracidia in vitro. These results show that H. okamotoi oncomiracidia express agglutination and immobilization antigens, as do protozoans Ichthyophthirius multifiliis (Dickerson et al. Reference Dickerson, Clark and Findly1989) and Cryptocaryon irritans (Yoshinaga and Nakazoe, Reference Yoshinaga and Nakazoe1997). Specific antibodies against H. okamotoi in naturally infected tiger puffer can be detected by using ELISA (Wang et al. Reference Wang, Kim, Sameshima and Ogawa1997) when homogenized adult parasites are used for ELISA antigens and when test sera are collected from fish cultured in net cages. However, tiger puffer produced no antibodies against larvae and adults in this study. Specific antibodies against H. okamotoi adults were detected by ELISA from experimentally infected tiger puffer maintained in our laboratory for 2 years (data not shown), suggesting that tiger puffer would take a considerable period to produce specific antibodies against H. okamotoi adult compared with producing antibodies against oncomiracidia.
Nakane et al. (Reference Nakane, Ogawa, Fujita, Sameshima and Wakabayashi2005) reported that tiger puffer persistently infected with H. okamotoi for longer than 1 year acquire protection against this parasite. They hypothesized that the protection mechanism found among persistently infected fish functions on at least 3 occasions: (1) when the oncomiracidium first settle on the gills, (2) when the parasite develops from a young larva without clamps to one with a pair of clamps, and (3) when pre-adult and young adult parasites migrate and grow on the branchial cavity wall. However, whether humoral antibodies can protect fish from re-infection by the parasites remains unknown. This study showed that tiger puffer acquired partial protection against H. okamotoi. However, specific antibodies against oncomiracidia and their cilia did not participate in protection against H. okamotoi because no difference was found in the parasite count between immunized and control fish when challenged with H. okamotoi oncomiracidia, even though the immunized fish produced specific antibodies against oncomiracidia and their cilia which resulted in the agglutination of oncomiracidia in vitro. These results also show that H. okamotoi oncomiracidia express agglutination and immobilization antigens on their cilia. The purified ciliary surface immobilization-antigen of the ciliate I. multifiliis does induce protective immunity in catfish Ictalurus punctatus, causing the production of immobilizing antibodies and preventing infection after a lethal challenge (Wang and Dickerson, Reference Wang and Dickerson2002). However, immobilizing antibodies against H. okamotoi oncomiracidia had no important role in protective immunity in this study. In the case of settlement of H. okamotoi, ciliated free-swimming oncomiracidia settle on the gills, are deciliated, open their haptor, and then grow on the gill filaments (Chigasaki et al. Reference Chigasaki, Nakane, Ogawa and Wakabayashi2000). The only ciliated stage of the parasites is the oncomiracidium. Thus, their cilia might not be as important for settlement in H. okamotoi as they are lost immediately the parasite finds its host, and the production of immobilizing antibodies would not participate in protection against H. okamotoi. All stages of I. multifiliis are ciliated; the free-swimming theronts (infective stage) that penetrate into the surface epithelia of the skin and gills, transform into trophonts and grow on the fish, and then the trophonts leave the host to become cysts. In a model of antibody-mediated protection against I. multifiliis, antibody binding produces a signal that results in parasites leaving the host, and binding causes immobilization and facilitates killing of the parasites at higher antibody concentrations (Dickerson and Clark, Reference Dickerson and Clark1998).
Fish acquire protection against reinfection by monogenean parasites (Vladimirov, Reference Vladimirov1971; Lester and Adams, Reference Lester and Adams1974; Scott and Robinson, Reference Scott and Robinson1984; Bondad-Reantaso et al. Reference Bondad-Reantaso, Ogawa, Yoshinaga and Wakabayashi1995; Richards and Chubb, Reference Richards and Chubb1996). In fish-monogenean interactions, both non-specific and specific immune mechanisms have been proposed to protect fish against pathogens. Non-specific responses have been implicated in the control of gyrodactylid monogeneans, particularly complement (Buchmann, Reference Buchmann1998; Harris et al. Reference Harris, Soleng and Bakke1998) and leucocytes (Buchmann and Bresciani, Reference Buchmann and Bresciani1999). Rainbow trout Oncorhynchus mykiss mucus has antibodies and various other immune compounds (St Louis-Cormier et al. Reference St Louis-Cormier, Osterland and Anderson1984; Buchmann and Bresciani, Reference Buchmann and Bresciani1998) that could participate in host defences (Buchmann, Reference Buchmann1999; Buchmann and Lindenstrom, Reference Buchmann and Lindenstrom2002). Gyrodactylus derjavivi distribution on rainbow trout shows marked negative correlation with superficial mucous cell density, suggesting that mucus may have an important effect on parasite site selection and infection dynamics (Buchmann and Bresciani, Reference Buchmann and Bresciani1998). Further studies are needed to clarify factors implicated in acquiring protection against H. okamotoi infections.
Western blot results indicated that experimentally infected fish and fish immunized with homogenized H. okamotoi oncomiracidia recognize similar antigenic bands. This suggests that tiger puffer would tend to react with these antigens compared with other antigens and that specific antibodies against these antigens would not participate in protection against H. okamotoi. Antibody diversity is restricted in lower vertebrates (Roman et al. Reference Roman, De Guerra and Charlemagne1995). Antibody diversity of tiger puffer might also be restricted and non-specific defence factors might be more important in acquiring protection against H. okamotoi.
In this study, tiger puffer persistently infected with H. okamotoi produced specific antibodies against H. okamotoi oncomiracidia and their cilia. These antibodies led to agglutination of the oncomiracidia in vitro. Persistently infected tiger puffer acquired partial protection against H. okamotoi. Intraperitoneal injection of proteins of sonicated oncomiracidia or their cilia with an adjuvant also produced oncomiracidium agglutination antibodies whose levels against cilia and oncomiracidia increased. However, infection levels of fish immunized with proteins of sonicated oncomiracidia or their cilia were the same as for control fish, indicating that specific antibodies against these cilia and oncomiracidia do not participate in protection against H. okamotoi. Further studies are needed to specify agents that contribute to prevention of reinfection.