Introduction
Global climate change over geological time has had major impacts on the evolution of life on earth. At the Cretaceous/Paleogene boundary, something on the order of 75% of marine species went extinct (Jablonski and Chaloner Reference Jablonski and Chaloner1994) in response to catastrophic climate change, likely due to a massive asteroid impact on the Yucatán Peninsula (Schulte et al. Reference Schulte, Alegret, Arenillas, Arz, Barton, Bown, Bralower, Christeson, Claeys and Cockell2010). More recently, human-influenced climate change in the present day is having profound impacts on evolutionary outcomes, with 18–35% of extant species at risk of extinction in the coming decades (Thomas et al. Reference Thomas, Cameron, Green, Bakkenes, Beaumont, Collingham, Erasmus, de Siqueira, Grainger and Hannah2004; Barnosky et al. Reference Barnosky, Matzke, Tomiya, Wogan, Swartz, Quental, Marshall, McGuire, Lindsey and Maguire2011). These events demonstrate that patterns of global climate change can and do influence rates of speciation and extinction.
Observed patterns of fossil faunal first and last appearance data (FADs and LADs, respectively) have been used as evidence for the nature of climatic influence on mammalian evolution. One of the best-known examples is Elisabeth Vrba’s (Reference Vrba1985, Reference Vrba1988, Reference Vrba1993, Reference Vrba1995) turnover-pulse hypothesis (TPH), which suggests a mechanism for how global climate change affects faunal turnover patterns. Vrba posits that turnover risk is extremely low under stable climate regimes but rises sharply during periods of global climate change as a result of increased vicariance (i.e., fragmentation) of habitat patches (Vrba Reference Vrba1999). Climate change is therefore predicted to result in distinct “pulses” of turnover events across diverse mammalian lineages, as taxa respond to a common stimulus (i.e., habitat vicariance due to climate change).
Birth–Death Models
So-called birth–death models (Nee et al. Reference Nee, May and Harvey1994b) have a long history of use in paleobiology (Raup et al. Reference Raup, Gould, Schopf and Simberloff1973). Birth–death models simulate the process of evolutionary diversification based on two parameters: the origination or birth rate (λ) and the extinction or death rate (μ) for each lineage (Kendall Reference Kendall1948). These parameters may fluctuate as a function of time or may be constant throughout the simulation. In the birth–death context, the TPH implies fluctuating rates of origination and extinction that are correlated with global climatic events, resulting in clustering of turnover events within time intervals characterized by major climate change. The statistical null hypothesis for the TPH is a constant-rate birth–death model, in which λ and μ are invariant through time. Under this null hypothesis, the expected number of origination or extinction events in each time interval, scaled to the standing diversity in that interval, is uniform through time. However, despite the expectation of uniform turnover through time, the variance in such constant-rate birth–death processes can nonetheless be very high. In a birth–death process with high variance, lineages are subject to extinction due to “demographic stochasticity” (Nee et al. Reference Nee, Holmes, May and Harvey1994a), and the process may also evince time intervals with stochastically high numbers of originations.
Previous Tests of the Turnover-Pulse Hypothesis
It has been suggested that climate change during the Plio-Pleistocene played a major role in human evolution, with trends toward cooler, more arid, and more variable climate conditions driving hominin speciation and extinction and the acquisition of key hominin behavioral and anatomical features (Vrba Reference Vrba1988; deMenocal Reference deMenocal1995; Potts Reference Potts2007). The origin of our own genus Homo at approximately 2.8Ma (Villmoare et al. Reference Villmoare, Kimbel, Seyoum, Campisano, DiMaggio, Rowan, Braun, Arrowsmith and Reed2015)—as well as the demise of Australopithecus and the diversification of Paranthropus—has been explicitly tied to one of these turnover pulses (Vrba Reference Vrba1988, Reference Vrba1995).
The evidence for the TPH comes primarily from studying patterns of faunal turnover in fossil mammals. The fossil record of African antelopes (bovids) and rodents have frequently been argued to exhibit pulsed turnover (Vrba Reference Vrba1985, Reference Vrba1988, Reference Vrba1995; Wesselman Reference Wesselman1995). Furthermore, turnover rates in Plio-Pleistocene Italian mammal communities have been shown to correlate with rates of regional temperature change (Raia et al. Reference Raia, Piras and Kotsakis2005). However, studies on several taxonomic groups have not strongly supported the presence of biologically meaningful turnover pulses (White Reference White1995; Bobe et al. Reference Bobe, Behrensmeyer and Chapmam2002; Bobe and Behrensmeyer Reference Bobe and Behrensmeyer2004; Werdelin and Lewis Reference Werdelin and Lewis2005). Alroy’s (Reference Alroy1996) study of the Cenozoic mammal fossil record found no evidence that turnover rates were bimodal, which would be predicted if background turnover rates are low and are punctuated by short bursts of rapid turnover. Other researchers have emphasized the importance of taphonomic biases and differential fossil collection effort in producing turnover patterns that might resemble pulsed turnover (McKee Reference McKee1995; Behrensmeyer et al. Reference Behrensmeyer, Todd, Potts and McBrinn1997; McKee Reference McKee2001). With regard to the African bovid record, a recent exhaustive analysis suggested more or less continuous—rather than pulsed—turnover (Bibi and Kiessling Reference Bibi and Kiessling2015). Thus, the evidence for widespread turnover pulses in the terrestrial mammalian fossil record is in dispute.
Furthermore, the biological meaning of observed turnover pulses is open to interpretation. Previous studies have concentrated on demonstrating the existence of elevated faunal turnover in particular time intervals. However, it is unclear whether or not even unambiguous evidence of elevated turnover necessarily implicates the mechanism of vicariance-mediated turnover to the exclusion of other processes, including random noise, which is capable of mimicking nonrandom processes (Blaauw et al. Reference Blaauw, Bennett and Christen2010). Thus, in order to be confident that elevated turnover reflects some meaningful biological mechanism, it is necessary to demonstrate that elevated turnover rates (purported turnover pulses) of a particular magnitude are sufficiently uncommon in purely stochastic processes.
The purpose of the present study is to examine a null model (sensu Gotelli and Graves Reference Gotelli and Graves1996) for faunal turnover based on simple birth–death models of speciation. This type of model deliberately omits any external factor influencing turnover rates and can reveal how frequently elevated turnover occurs by chance in a given time interval under different simulation (e.g., per capita extinction rate and origination rate) and analytical parameters (e.g., the number of time bins used). The behavior of the null model can then be compared with empirical patterns of turnover to test for significant departures from null expectations. This model can thus be used to determine whether empirically observed pulses of turnover events could have been derived from purely stochastic processes, or whether some external forcing mechanism need be invoked.
Stochastic simulation methods have been used previously (Baumiller Reference Baumiller1996) to explore whether the predictions of the coordinated stasis model (i.e., long periods of low turnover punctuated by short intervals of high turnover) were upheld (Brett and Baird Reference Brett and Baird1995) in Silurian to Middle Devonian faunas. The goals of the simulations in the present paper are distinct from these efforts. The aim in the present study is to explore potential rates of type I error in detecting the pulses in the terrestrial mammalian fossil record that have served as the main evidence in support of the TPH.
Methods for Quantifying Turnover Pulses
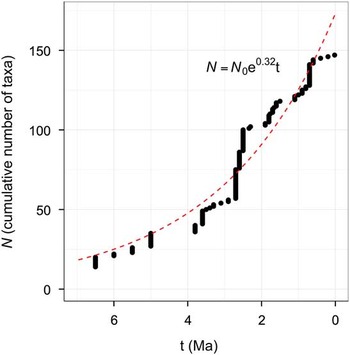
Vrba (Reference Vrba1995) tested for pulses of turnover in FADs of African bovids from approximately 7Ma to the present day. To establish a baseline for the expected number of FADs in a particular time interval, Vrba arranged the bovid FADs in temporal order from oldest to youngest. Each of the ordered species was assigned a number N, which represents the cumulative number of bovid species since time t=0. She then modeled N as an exponential function of the elapsed time since the origin, with an initial number of species N 0 starting at 1:
 $$N=N_{0} e^{{0.32t}} $$
The exponential growth constant 0.32 was estimated from the bovid fossil data. Figure 1 illustrates the ordered FADs from 7Ma to the Recent, with the fitted exponential model plotted as a dashed red line. Vrba argued that this simple exponential model was a reasonable null expectation, because the number of bovid taxa rose from a single taxon in the Miocene to multiple taxa in the Pliocene, with species numbers rising at an increasing rate into the Pleistocene.
Sorted FADs of African bovid taxa from 7 Ma to present, with exponential-growth model plotted as a dashed red line. Data from Vrba (Reference Vrba1995).

Effect of Extinction
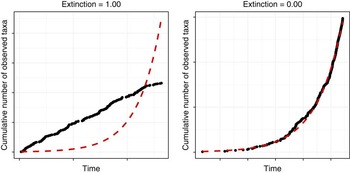
The model of exponential accumulation of taxa (i.e., exponential growth in the cumulative number of observed taxa) assumes no extinction. This may be problematic if extinction in fact occurs, because as the extinction rate approaches the speciation rate, the observed curve of the cumulative number of observed taxa will be flattened. The cumulative number of observed taxa may grow faster than the exponential prediction at first, but the exponential prediction will eventually outpace it, at which point the exponential predictions will be dramatically higher than the observed values (Fig. 2). Extinction can thus result in intervals that have dramatically higher and dramatically lower numbers of FADs than predicted by the exponential model.
Taxon accumulation curves (i.e., cumulative number of taxa observed through time) under two hypothetical scenarios: an extinction rate equal to the speciation rate (left) and an extinction rate of 0 (right). Expectations from a simple exponential model are illustrated by the dashed line. When extinction occurs, there is a systematic departure of the simulated FADs from the exponential prediction.

Extinction is a very common feature of the fossil record. By one estimate (Raup Reference Raup1991), greater than 99% of all species that have existed through geological time are currently extinct. This suggests that the present diversity of modern species is the result of only a slight difference in the average speciation and extinction rates (Sepkoski Reference Sepkoski1998). Although exponential models of speciation may be reasonable during geologically short-term rapid-growth scenarios such as adaptive radiations, extinction must affect all lineages during major portions of their evolutionary history. The closer the extinction rate is to the speciation rate within a lineage, the more the observed FAD accumulation curve will approach a simple linear form (i.e., species richness will stay more or less constant). If the extinction rate exceeds the speciation rate, then the rate of species accumulation will decline, and the clade will eventually become extinct. Empirically, rates of speciation and extinction vary through time and give rise to a variety of different patterns of diversity across different clades (Raup et al. Reference Raup, Gould, Schopf and Simberloff1973). Rather than assuming an exponential model of species accumulation when testing for pulsed turnover, it is desirable to use a method for detecting turnover pulses without assuming any particular shape of the taxon accumulation curve.
Foote’s per Capita Origination Rate
Foote’s (Reference Foote2000) per capita origination rate offers a convenient way of calculating turnover rates without assuming that extinction does not occur. The per capita rate is calculated as the ratio of the number of range-through taxa (i.e., taxa whose temporal range crosses the lower and upper boundaries of a given interval) to the number of top-boundary crossers (i.e., taxa whose observed range crosses only the upper boundary of a given interval). Thus, the measure is scaled against the standing diversity of a given interval and reflects a per capita rate of origination.
Foote’s origination rate was recently used to reevaluate turnover rates in African antelopes (Bibi and Kiessling Reference Bibi and Kiessling2015), following Bibi’s detailed, specimen-based analysis of the African bovid fossil record augmented by a comprehensive literature review. Foote rates were calculated for each time bin, and the interquartile range for all time bins together was computed. Specimen-based subsampling (i.e., rarefaction) was used to mitigate effects of differential preservation in different time intervals. Intervals were considered to exhibit significant levels of turnover if the Foote rate of origination for the interval fell outside 1.5 times the interquartile range (1.5 * IQR; i.e., any value that was greater than 1.5 times the 3rd quartile). By using Foote’s rate measures, Bibi and Kiessling make no assumption about the shape of the taxon accumulation curve and allow for possibility of extinction. However, this criterion for defining a turnover pulse is still somewhat arbitrary, and it is not apparent how frequently a constant-rate birth–death process would produce turnover rates that would be considered turnover pulses based on this 1.5 * IQR criterion.
Methods
In the present study, the goal was to evaluate the magnitude of stochastic fluctuations in turnover rates in the absence of any external forcing mechanism (e.g., global climate change). To accomplish this, I simulated taxon ranges from a stochastic birth–death model using the ‘paleotree’ (Bapst Reference Bapst2012) package (‘paleotree’ version 2.7 with ‘ape’ version 4.0 and ‘phangorn’ version 2.1.1) in R (version 3.3.1; R Development Core Team 2015). While the underlying simulated process is a birth–death process, paleontological taxon ranges comprising FADs and LADs are more appropriately modeled as incompletely sampled birth–death processes, because not all taxa are reflected in the fossil record. In the simulations reported here, new taxa appear only due to cladogenesis. The simulations deliberately do not consider taxa in the fossil record due to immigration.
The ‘paleotree’ package allows for a variety of different models of morphological differentiation during simulated cladogenesis, which impacts the sampled taxon ranges (i.e., a taxon origination can only be recorded in the observed fossil ranges if the taxon is morphologically distinct from its parent taxon). In this study, all cladogenetic events reflect “budding cladogenesis,” wherein one of the daughter taxa becomes morphologically distinct from the parent taxon, while the other daughter taxon remains morphologically indistinguishable from the parent taxon (Bapst Reference Bapst2012). Anagenesis does not occur in the simulations reported here. Sampling of the resulting tree is implemented by independently distributing sampling events across the tree and through time as a Poisson process (Foote and Raup Reference Foote and Raup1996; Foote Reference Foote1997; as detailed in Bapst Reference Bapst2012) to produce a set of observed taxon ranges.
Simulation and Analytical Parameters
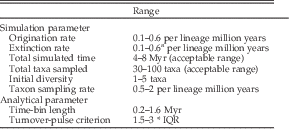
I created 1000 hypothetical fossil records using a range of simulation parameters using the paleotree::simFossilRecord() function. The parameter ranges were selected to be comparable to the range of estimated parameters from Bibi and Kiessling’s (Reference Bibi and Kiessling2015) empirical study of the bovid fossil record of eastern African. No attempt was made to estimate sampling rates based on the empirical bovid data; rather, the approach taken was to take relatively broad ranges for all parameters in order to include wide ranges of potential parameters. To simulate each record, parameters were randomly chosen from a uniform distribution with the range shown in Table 1. The total simulated time and total taxa sampled variables were not explicitly specified, but were constrained to fall within the range given in Table 1.
Simulation and analytical parameters used in this study, including the acceptable ranges. For the turnover-pulse criterion, IQR indicates the interquartile range of the turnover rates for each time bin (discarding the first and last time bin). The turnover-pulse criterion is calculated as a multiple of the IQR.

a Constrained to be lower than corresponding origination rate.
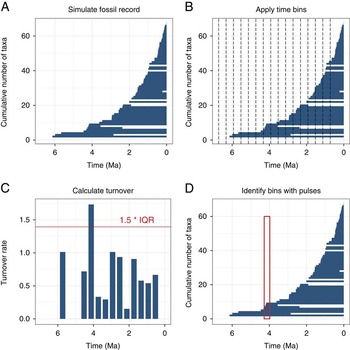
To investigate the role of the various simulation parameters in producing records with more or fewer apparent “pulses,” I analyzed each record while holding constant the length of time bins (0.5 million years [Myr]) and the turnover-pulse criterion (1.5 * IQR). Figure 3 provides a schematic illustration of the analysis for each simulated fossil record. I wrote a custom R function called NullTurnover::detectPulses() Footnote * to determine whether or not turnover pulses occurred in these simulated records. Recall that per lineage rates of origination and extinction were held constant through simulated time. Nevertheless, rates of origination and extinction within a time bin containing many lineages varied stochastically. The detectPulses() function first assigns FADs and LADs to discrete time bins using the paleotree::binTimeData() function (illustrated in Fig. 3B). These binned temporal range data are then passed to the paleotree::perCapitaRates() function, which calculates observed per capita rates of origination for each interval (Fig. 3C). The first and last time bins are ignored to reduce edge effects that cause anomalously high turnover in the first and last time bins (Foote Reference Foote2000; Bibi and Kiessling Reference Bibi and Kiessling2015). Finally, the rate of each interval is compared with the distribution of origination rates for all intervals. Any intervals with rates falling above the significance criterion (Fig. 3 D) are flagged as turnover pulses (though from a biological perspective these are more properly viewed as false turnover pulses, or type I errors). I used this function to investigate the influence of each simulation parameter on the propensity for type I error in detecting turnover pulses. Ordinary least-squares regression was used to investigate the relationship between the simulation parameters and the number of “pulses” detected.
Schematic diagram illustrating the steps in the analysis. A, Simulate fossil record with origination and extinction rate held constant through time and incomplete lineage sampling. B, Assign fossil ranges to discrete time bins. C, Calculate the Foote rates of origination for each of the time bins and apply the turnover-pulse criterion (red horizontal line) to determine whether or not any pulses are observed. D, Record the number and location of any “pulses.”

Next, I iteratively reanalyzed the same set of 1000 trees while varying the analytical parameters (length of time bin and the turnover pulse criterion). Table 1 shows the range of analytical parameters examined. While one analytical parameter was varied, the remaining analytical parameter was held constant at its default value (1.5 * IQR for the turnover-pulse criterion and 0.5 Myr for the length of time bins). To start, the turnover-pulse criterion of 1.5 * IQR was used, and then incrementally increased in 16 equal steps to 3 * IQR. Similarly, the length of time bins was started at 0.2 Myr and increased in 16 equal steps up to 1.6 Myr. At each step, all 1000 trees were reanalyzed following the steps in Figure 3. After doing this for a given step, I calculated the number of simulations that exhibited at least one turnover pulse and graphically explored the relationship between analytical parameters and the proportion of simulations with at least one pulse.
Results
Simulation Parameters
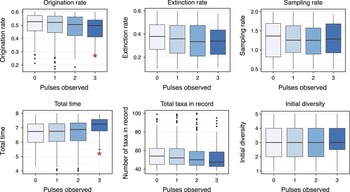
Results for the simulation parameter analyses (with constant default analytical parameters) are given in Figure 4. Origination rate showed a very weak negative relationship to the number of pulses detected coefficient=−0.011, p=0.003, R 2=0.014). Simulations with lower origination rates are characterized by a greater number of pulses as compared with simulations with higher origination rates. Simulations with no observed pulses had the highest median origination rates. The total time recorded in the simulation had a weak positive relationship to the number of pulses detected (slope=coefficient, p<0.001, R 2=0.022). Simulations with multiple pulses had longer median duration than simulations with no pulses detected.
Box plots showing the relationships between the six simulation parameters and the number of pulses detected for each simulation using the default analytical parameters (turnover-pulse criterion of 1.5 * IQR and 0.5 Myr time bins). ANOVA suggests that only origination rate and total time have a significant relationship to the number of pulses (statistical significance indicated by asterisks). Rates of origination, extinction, and sampling are per lineage million years. Total time is in Myr. Total taxa and initial diversity are simply counts of taxa.

Analytical Parameters
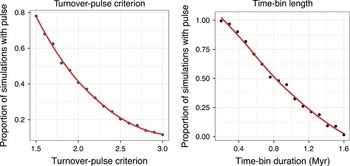
Figure 5 shows the results of the analytical parameters analyses in which the turnover pulse criterion and the length of the time bins was systematically altered. Both the turnover-pulse criterion and the length of the time bins show a strongly negative relationship to the proportion of simulations exhibiting one or more pulses. At the most permissive turnover pulse criterion (1.5 * IQR), 78% of simulations had at least one pulse. At the most stringent turnover-pulse criterion (3 * IQR), 11.6% of simulations showed at least one pulse. At the shortest time-bin length (0.2 Myr), 99.5% of time intervals showed at least one turnover pulse. At the longest time-bin length (1.6 Myr), 1.6% of simulations showed at least one pulse.
Relationships between the two analytical parameters (turnover-pulse criterion and time-bin duration) and the proportion of the 1000 simulations that showed at least one pulse. Both increasing the stringency of the turnover-pulse criterion and lengthening the time bins are associated with strikingly lower proportions of simulations exhibiting at least one pulse.

Discussion
The simulations in this study demonstrate that even when per lineage turnover probability is constant through time, rates of turnover in time bins are unlikely to be uniform. Instead, some time intervals will contain more turnover events than expected, merely due to chance. These intervals of high turnover need not be the result of meaningful biological “signal,” but may simply be the result of stochastic “noise.” When interpreting empirical patterns of turnover in the fossil record, it is important to understand the impact of various analytical choices on the rate of type I error in detecting intervals of elevated turnover.
The stringency of the turnover-pulse criterion applied and the length of the time bins play a critical role in determining the type I error rate when attempting to detect turnover pulses. As illustrated in Figure 5, when more stringent criteria are applied, the number of “pulses” detected drops dramatically. This is an intuitively obvious result, because the turnover criterion reflects the cutoff point that defines a “pulse.” Thus, making this cutoff more stringent reduces the number of apparent pulses. Figure 5 further demonstrates that the choice of the length of time bins is also of critical importance. In the range of simulation parameters used in this study, relatively long time bins (i.e., approximately 20–25% of the entire simulated time range) are necessary to bring type I error rates to the conventionally acceptable 5% rate.
The impact of the analytical parameters on the probability of detecting a spurious pulse may seem almost trivial. For example, the impact of time-bin length on the false-positive rate is a direct a statistical consequence of sample size. With longer time bins, larger samples of taxa are taken per interval, and stochastic noise is lessened due to the larger taxon sample size per interval. Even though this effect is wholly predictable, these simulations highlight just how sensitive tests for turnover pulses are to this analytical decision of time-bin length. Thus, empirical studies searching for pulses of turnover in the fossil record must carefully consider the impact of analytical decisions on the probability of detecting a spurious turnover pulse.
Simulation parameters (Fig. 4) had a much more subtle impact on the likelihood of detecting “pulses.” Only the origination rate (negative relationship) and the total time length of the simulation (positive relationship) were significantly related to the number of pulses detected, though the variance explained was very small (R 2=0.014 and 0.022, respectively). Combined with the results regarding the dramatic impact of time-bin length, these results suggest that the origination rate and the total time of the simulation affect type I error rates by means of altering the average number of taxa per time bin. When the average number of taxa per time bin is high (due to short simulations, high origination rates, or long time bins), the type I error rate is relatively low. When the average number of taxa per time bin is low (due to long simulations, low origination rate, or short time bins), the type I error rate is relatively high. This is likely due to the impact of many intervals with zero originations when the number of taxa per interval is low. When many intervals have zero originations, this drags down the turnover-pulse criterion, which is scaled to the interquartile range of turnover rates for all bins.
The simulations reported in this study were parameterized to bracket estimated parameters from the African bovid fossil record, a relatively well-sampled terrestrial group of large mammals that has played a central role in previous efforts to evaluate the TPH (Vrba Reference Vrba1995; Bibi and Kiessling Reference Bibi and Kiessling2015). The results from the analytical parameter analyses suggest that even with a relatively well-sampled taxonomic group such as bovids, type I error rates may be extremely high, given the temporal resolution of the record and the number of total taxa in the record. Bibi and Kiessling’s recent (2015) study of the African bovid fossil record concluded that climate-mediated pulsed turnover is not a major feature of the bovid record. These authors did point to one interval (2.0–1.75Ma) with a significantly elevated turnover rate according to their criterion (1.5 * IQR), which coincides with the largest of the turnover-pulse events at 1.8Ma previously described by Vrba (Reference Vrba1995). Bibi and Kiessling warn that that sampling of bovid fossils outside of the Turkana Basin during this particular interval is very poor and that this deficiency may be partially responsible for this apparent turnover-pulse. The relatively high type I error rates in the simulations reported here offer further support for Bibi and Kiessling’s major conclusion: turnover in African bovids should be viewed as relatively continuous, rather than being characterized by meaningful turnover pulses.
A Way Forward for Detecting the Influence of Climate on Evolutionary Outcomes
For future studies aiming to detect turnover pulses based on fossil records of taxon origination and disappearance, these simulations illustrate that characteristics of the fossil record (such as the number of taxa in the record and the length of temporal bins that can be effectively used) have a direct impact on the sensitivity of tests for pulsed turnover. Therefore, it is not possible to choose a simple criterion for determining what constitutes a pulse. Instead, it is preferable to investigate the type I error rates obtained with various combinations of parameters and to choose a turnover-pulse criterion that results in an acceptable level of type I error given the characteristics of the fossil record of the taxonomic group in question. In the simulations in this study (Fig. 5), type I error rates fall below the conventional 0.05 threshold when using 1.6Ma as the time-bin length (using the default pulse criterion). Future studies can use a similar simulation-guided approach to select analytical parameters that result in acceptably low false-positive rates.
The results of this study argue for extreme caution in attempting to detect meaningful turnover pulses in data sets that comprise relatively few taxa per time bin. Such data sets are particularly prone to type I errors and may lead to misleading conclusions about the presence of biologically meaningful pulses of turnover. Thus, continued efforts to bolster sample sizes for poorly represented taxonomic groups are particularly important. However, the fossil records of many taxonomic groups are unlikely to ever be large enough to be good candidates for evaluating the cause of observed turnover patterns. The much better sampled marine record is likely to be more useful than the patchier terrestrial record in this regard.
Finally, because type I error rates in detecting turnover pulses appear to be quite high under realistic simulation conditions, turnover rates may not reflect the best avenue for detecting the influence of climate on the evolution of mammalian communities. Instead of examining diversity patterns in isolation, examining the functional trait structure of communities may offer an approach that is less susceptible to false positives. Recent efforts have emphasized the strong links between mammalian community functional traits and environmental characteristics such as vegetation cover, precipitation, and annual temperature (Fortelius et al. Reference Fortelius, Eronen, Jernvall, Liu, Pushkina, Rinne, Tesakov, Vislobokova, Zhang and Zhou2002, Reference Fortelius, Žliobaitė, Kaya, Bibi, Bobe, Leakey, Leakey, Patterson, Rannikko and Werdelin2016; Eronen et al. Reference Eronen, Polly, Fred, Damuth, Frank, Mosbrugger, Scheidegger, Stenseth and Fortelius2010a,Reference Eronen, Puolamäki, Liu, Lintulaakso, Damuth, Janis and Forteliusb,Reference Eronen, Puolamäki, Liu, Lintulaakso, Damuth, Janis and Forteliusc; Polly Reference Polly2010; Polly et al. Reference Polly, Lawing, Eronen and Schnitzler2015; Žliobaitė et al. Reference Žliobaitė, Rinne, Tóth, Mechenich, Liu, Behrensmeyer and Fortelius2016; Barr Reference Barr2017). Because mammalian community functional traits are so closely linked to environmental parameters, which are themselves directly related to climatic conditions, analysis of community evolution in functional traits promises to be a better reflection of the impact of climate on mammalian communities than patterns of faunal turnover alone.
Conclusion
One of the main goals of this study was to illustrate how simulations of null turnover can be used to determine appropriate criteria for detecting pulsed turnover in future studies. This study provides a framework for investigating turnover patterns in the fossil record, based heavily on the ‘paleotree’ package (Bapst Reference Bapst2012).Footnote † Results from the simulations in this study suggest that intervals of elevated turnover are quite common under the null model, especially in cases for which the expected number of events per interval is low (due to low overall sample size or the use relatively short time bins). Null turnover models offer a powerful and flexible framework for evaluating whether observed patterns are best attributed to some external “signal” or rather to stochastic “noise.” Future studies of faunal turnover should compare the magnitude of observed turnover rates with the expectations from null simulations when evaluating whether or not elevated turnover events represent biologically meaningful signals.
Acknowledgments
Many thanks to David Bapst, John Rowan, and Andrew Du for offering many suggestions that significantly improved this article. Thanks also to Denné Reed, Kaye Reed, Amber Heard-Booth, and Gabrielle Russo, who provided comments and/or encouragement on a much earlier version of this project. I am grateful for the support of the Center for the Advanced Study of Human Paleobiology and the George Washington University Signature Program.