1. INTRODUCTION
In modern society, an efficient road-traffic system is one of the most fundamental means of supporting both industrial and urban life. Therefore, the establishment of a smooth traffic flow should be seen as an important policy requirement. An ill-organized automobile network primarily contributes to increased traffic congestion, which not only devastates vehicular movement efficiency, but also increases exhaust gas emissions and heat generation. This situation causes various urban environmental problems. Therefore, keeping the increased traffic congestion in check is regarded as an important topic. In this social context, a new traffic system called intelligent transport systems (ITS) has been proposed, which aims to solve these urban traffic problems by adopting the latest information and telecommunication technologies. One of the actual provisions, vehicle information and communication system (VICS), has been proposed to ease heavy congestion. A crucial limitation of VICS is that only the maximization of individual utility is considered, with no particular allowance made for social holistic utility. Currently, a diffused car navigation system (CNS) encourages users to take the shortest route, which is derived from traffic information known at the “present moment,” monitored through the VICS. Most car agents adopt the same traffic routes as the respective CNSs refer to the same traffic information, while social utility is not taken into consideration (in other words, an individual sees only local maximum instead of the holistic maximum). This inevitably causes heavy congestion. Even if there is no congestion at a certain moment, it might trigger congestion in the future, because many agents may choose the same route [Reference Yamashita, Izumi, Kurumatani and Nakashima1]–[Reference Yoshii, Akahane and Kuwahara3]. This physical process is brought about by a particular situation, where many agents act simultaneously by basing their decisions on uniform information. We can also see the same situation, for example, in the congestion problems of an amusement park [Reference Kawamura, Kurumatani and Ohuchi4]. This type of phenomenon is widely observed in a situation where agents sharing the same information are urged to compete for a limited resource (traffic capacity, service capacity, etc.). In the sphere of applied mathematics, this is called the common resource distribution problem (CRSP), known derivations of which include the minority game [Reference Arthur5] and the El Farol bar problem [Reference Challet and Zhang6]. From the evolutionary game theory point of view, CRSP can be classified as a chicken-type dilemma game [Reference Tanimoto and Sagara7], where alternating reciprocity ST [Reference Tanimoto and Sagara8] is preferable. That is, a focal player should select a strategy opposite to the one chosen by his opponent player to obtain better payoffs for both players, when an archetypal 2×2 (two-player, two-strategy) game is assumed. The most important key to solving this kind of problem is knowing how to maintain the probabilistic deviation of an agent's action.
Returning to the traffic congestion problem, we can simulate several measures to maintain the deviation of an agent's action. Yamashita et al. [Reference Yamashita, Izumi, Kurumatani and Nakashima1] insist that we can avoid a decrease in social utility by sharing information among users by introducing a novel “group-user support” concept. However, their idea has a substantial problem. Although the social holistic utility can be increased by this method, the individual utility of the agents who adopted an information-sharing strategy is less than that of other strategies, such as the simple “shortest-route strategy.” This is the exact implication of the “social dilemma” mentioned above. Concerning this particular limitation, Savit [Reference Savit, Manuca and Riolo9] discussed whether restricting the size of the information circle made sense. In addition, Akashi [Reference Akaishi and Arita10] suggested that there might be a more robust strategy when an intentional error is exogenously imposed on the system. Therefore, in this paper, we investigate whether we could overcome the substantial drawback of information sharing introduced by Yamashita, and if so how. A key concept is not global sharing but partial sharing as explained later.
The present paper deals with the question of how we can sustain a high social utility, avoiding any decrease in individual utility of the respective automobile agents, which leads to a significant contribution for constructing a “post-generation CNS” based on information-sharing technology. We also discuss the features of this social dilemma in relation to typical dilemmas in evolutionary game theory.
In the research area of physics, there have been many studies that have dealt with traffic flow [Reference Kerner and Konhäuser11]–[Reference Gazis, Herman and Rothery16] and evolutionary game theory [Reference Tanimoto and Sagara7]–[Reference Tanimoto and Sagara8]. As mentioned above, traffic flow can be deeply relevant to a dilemma game. In fact, Yamauchi et al. [Reference Bogers, Bierlaire and Hoogendoorn17] found that several social dilemma structures are represented by n-person prisoner's dilemma (n-PD) games in certain traffic-flow phases at a bottleneck caused by a section of closed lanes. To clarify the social dilemma structure in traffic flow, which is a pure-physical process, they built a cellular automata (CA) model based on the stochastic optimal velocity (SOV) model with an open boundary condition, and applied it to the bottleneck problem caused by the reduction from double to single lanes. They found that the four traffic-flow phases had different game structures. The present paper contributes in relation to this context, although our scope emphasizes the application side more than the principle side. As explained later in this paper, our model can be categorized as a more engineering-oriented practical model, commonly used in the sphere of urban planning, the scope of which is wider than microscopic models such as CA and optimum velocity models. However, we think that our contribution might concern some issues in physics, because not only traffic flow and dilemma games, but information also, is dealt with at the same time.
Also, we know, in the field of civil engineering, there has been a rich sphere providing lots of outstanding works concerning the so-called route-choice problem, drivers' behavior, information to drivers (e.g., [Reference Bogers, Bierlaire and Hoogendoorn17]–[Reference Emmerink and Nikamp24].). One point which makes our study different from those earlier studies is that we see the problem through the perspective of the evolutionary game theory, which focuses on how a newly presented strategy for route choice impacts in terms of competition with other conventional strategies. And as another important point, what we present here is a proposal for a brand new strategy for the use of traffic information which is analyzed by computer simulations.
2. MODEL
The traffic-flow simulation in this study requires a model that deals with two different scales: One that considers traffic congestion using macro-scale phenomena, and the other that considers the route choice based on micro-scale behaviour. Concerning micro-scale traffic models, there have been numerous studies in the domain of physics [Reference Kerner and Konhäuser11]–[Reference Gazis, Herman and Rothery16], where the kinetic gas theory, fluid dynamical model, car-following model, and cellular automaton (CA) model were developed [Reference Yamauchi, Tanimoto, Hagishima and Sagara25]. These pure-physics-oriented models are not appropriate for our purpose, because they cannot deal with macro phenomena.
Thus, we propose a fusion model for these two scales that consists of two parts: the road network and multi-vehicle agents. This viewpoint is called a meso-scale model, which has been applied to practical engineering problems [Reference Juran, Prashker, Bekhor and Ishai26].
In our model, each vehicle agent decides on an origin point for the trip and destination randomly at the beginning of a simulation run. During the trip, the agent chooses an optimum route to the destination at a certain time interval (this means that the agent is always trying to improve the optimum route from the previous selection), based on a certain rule called “strategy.” This strategy will be defined in Section 2.3. On arrival at the destination, the agent decides on another random destination. A single journey, from an origin point to final destination, is called a “trip.”
2.1. Road Network
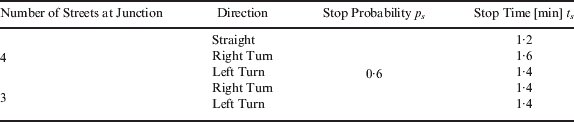
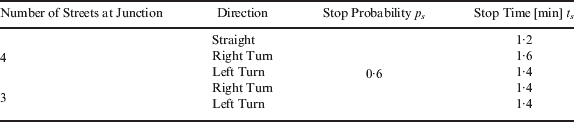
The road network is modelled as two parts: “node” refers to an intersection and “link” indicates a street. Because vehicle agents on a link can move in only one direction, a standard road with two lanes having opposing directions should be defined by two links and two extreme nodes. The link is divided into several blocks, as shown in Figure 1. Every block has a fixed length L. It is important to note that L must be assigned a value smaller than the value defined by the length that a vehicle can move in unit simulation time steps at free-flow speed V ideal (in other words, maximum possible velocity). This is required to prevent vehicles from skipping out of a certain block to the adjacent block. In addition, there is a signal at each node, where each vehicle stops for time t s with probability p s. All the simulation parameters are summarized in Table 1.
Model of a road network.

Stop probability and stop time.
2.2. Vehicle Agent
In the model, each vehicle agent moves in the i-th block of a link at a certain speed V i. The vehicle speed V i is expressed as a function of the block density D i. Block density is denoted by:

where N i is the number of vehicle agents in the i-th block in the present time step.
With respect to the vehicle speed function, Yamashita et al. [Reference Yamashita, Izumi, Kurumatani and Nakashima1] assumed a linear function derived from the Greenshields model as shown in:

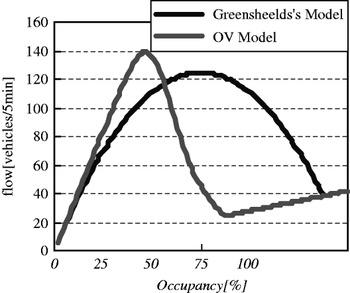
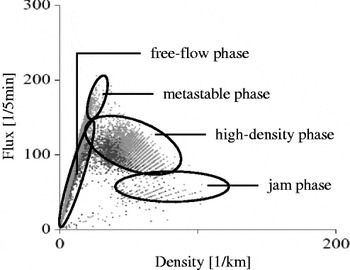
where V min is the minimum speed, and N jam is the maximum number of vehicle agents in a block (block capacity). Equation (2) gives the relationship between traffic flow density and its flux (fundamental diagram) as shown in Figure 2, which does not reproduce a realistic situation, such as the one illustrated in Figure 3 (Figure 3 was obtained using a series of real-observed data). Therefore, we adopted a revised function based on the optimal velocity (OV) function as follows:


where l c is the distance of the vehicle, d is the inflection point of the OV Function, and m is the slope of the inflection point. We assume that l c=5 [m], d=25, m=0·2, N jam=6, and L=60 [m] are empirical values [27]. The curve of Equation (3) is also shown in Figure 2. We can see that Equation (3) is more appropriate than Equation (2) to reproduce real situations. In one sense, our approach, which is classified by the macro-scale model, does not reproduce the plot deviations observed in Figure 3, but it reproduces an averaged relation between density and flow; on the other hand, the microscopic approach, used in CA models [Reference Bogers, Bierlaire and Hoogendoorn17], can deal with the more granular deviations.
Density-flow diagram of (2), (3).

Relationship between density and flow based on real traffic [27].

How the model deals with the process of an agent's transboundary movement from block i to block i+1 is described as follows. At every step, a vehicle agent's speed defined for each block is revised according to Equation (3). We then presume that vehicle agents can accelerate and slow down immediately, regardless of their speed in the previous time step. At the beginning of a time step, an initial available time (consistent with the discrete time step) to move a single time step is assigned to each vehicle. For the case where a vehicle agent moves to the next block in his available time, the agent actually moves to the head of the next block only when the next block density is not saturated (less than N jam), and his available time is reduced to another value by subtracting the time taken for the actual moving event. Otherwise, the vehicle agent moves to the end of the present block, and his available time is set to 0. The abovementioned process continues until the available time becomes 0. If his available time becomes 0 in the middle of a block, the distance moved from the head to the middle of the block is carried over to the next time step.
2.3. Navigation Strategy
Considering realistic situations in urban traffic contexts, the following five strategies are assumed in this study:
2.3.1. Shortest Distance (SD) Strategy
A vehicle agent adopting this strategy chooses the shortest distance route without using congestion information. Concretely speaking, an SD vehicle agent selects an optimum route assuming weight lij as the i–j geometric distance between nodes while applying Dijkstra's algorithm. If any routes are calculated as having an equal distance, the agent can make a random choice.
2.3.2. Shortest Distance and Congestion-Memorizing (SD-CM) Strategy
This is basically the same as the SD strategy, but a vehicle agent adopting this strategy avoids some of the congested routes experienced in previous trips. This particular strategy is achieved as follows. The agent has a memory of length m. The vehicle agent always refreshes his memory to memorize the most-congested links of the previous m-memorized links, plus the passed links during this trip. In the next trip, he chooses the shortest distance route, excluding the memorized m links. Vehicle agent i forgets his memory gradually as follows: D i,j,k=δ∙D i,j,k−1, where D i,j,k is the average density of link j, δ is the oblivion rate, and subscript k indicates the k-th time step. We assign δ=0·8.
SD strategy assumes that the CNS does not have the VICS. However, in reality, an actual driver does not simply choose the shortest route, because he can predict that some of the possible congested locations can be avoided. Therefore, it seems that this strategy is similar to an actual driver's strategy without the VICS. Thus, in a series of simulations we will see later, we assume SD-CM as the most primitive strategy, not SD.
2.3.3. Shortest Time (ST) Strategy
A vehicle agent opting for this strategy chooses the route that minimizes the time required to complete the trip by referring to the current congestion information provided by a traffic information centre through the VICS. The traffic-information centre collects data on the current traffic densities of all blocks and calculates the expected travel time (ETT) of each link measured (in the latest monitoring session), as the actual time required (meaning the average time of all the agents passing there) to travel along each link at the present moment. The ETT for link ℓ is denoted by:
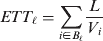
where B ℓ is a set of blocks belonging to link ℓ, and V i is the velocity of car agent i who is in link ℓ.
Concretely speaking, an ST vehicle agent selects an optimum route by assuming weight l ij as the ETT ij between nodes while applying the Dijkstra's algorithm. It is necessary to update an optimum route at a certain interval, t update, for this strategy, mainly because traffic congestion information is constantly changing. The most important issue here is the fact that an ST agent cannot arrive at his destination within the ETT (=ΣETT ij|along the optimum route), since the ETT is just a present value, that is, ETT is always changing in accordance with the present traffic situation.
In the real world, the movements of a large number of actual drivers having vehicles equipped with a CNS and VICS can be emulated using this strategy.
2.3.4. Shortest Time and Route-Information-Sharing (ST-RIS) Strategy
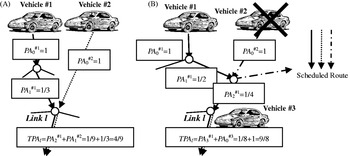
As discussed in the previous section, a crucial drawback of the ST strategy is that the agents refer only to current information. To overcome this, the ST-RIS strategy uses not only the current traffic information but any available future traffic information also. A vehicle agent adopting this strategy chooses a route based on both the current congestion information and any scheduled route information of other agents adopting the same strategy. The selection procedure for choosing a route is assumed as follows. First, an agent who opts for the ST-RIS strategy provisionally decides to take the shortest time route to the destination using the ST strategy. His selected route information is sent to a route-information server. Second, the route-information server calculates passage assurance (PA) for each link as follows. Initially, PA 0=1 is assigned to the link of the starting point of the ST-RIS agent's scheduled route. In the next node of his scheduled route, PA i=PA i−1×1/r i (r i is the number of connected links) is assigned. As shown schematically in Figure 4, TPA l is calculated by summing up all the PA values of each agent adopting the ST-RIS strategy who pass link l. TPA l potentially means expectation of the total number of agents who would pass link l on the way to their respective destinations based on the shortest time routes in the future. ETT l' is denoted by Equations (5)–(7), which is used by an ST-RIS strategy agent instead of ETT l (Equation (4)).



where b ℓ is the number of blocks belonging to link ℓ. Here, rs (0<rs<1) refers to the ratio of the current influence to the influence of future congestion revealed by ST-RIS strategy. Because rs for a real situation is not always known, we temporally assume a tentative value (rs=0·5) in the following simulations.
Example for calculating TPA. Vehicle 1 and 2 are accounted for in (A), while only Vehicle 1 and 3 are accounted for in (B).

2.3.5. Shortest Time with Partial Route Information Sharing (ST-pRIS) Strategy
The ST-RIS strategy may not ease congestion perfectly, because it faces the same problem as ST agents. Therefore, most of the agents are inclined to adopt the same traffic routes as they have been provided with the same information. We call this situation “information uniformalization.” To rectify this problem, it is necessary to provide different information to each agent. Therefore, we define a new strategy called shortest time with partial-route-information-sharing (ST-pRIS). In the present study, we substitute ST-pRIS for ST-RIS. In ST-pRIS, only the restricted agents, instead of all agents adopting the strategy, are allowed to share mutual information. It can be elaborated as follows. Unlike ST-RIS, each vehicle collects information from only certain vehicles. We define “certain vehicles” as being the n nearest agents on the future route of the focal agent. Information relating to the agents who are behind the focal agent is less important, because we do not consider vehicles overtaking one another. Here, we assume n=50. Each vehicle calculates TPA* l based on the restricted information, in the same manner as an ST-RIS agent calculates TPA. Concerning rs, we assume it to be 0·8, as in ST-RIS.
The model parameter settings assumed for rs in the cases of ST-RIS and ST-pRIS were different. We assumed those values based on preliminary simulations to achieve the highest efficiency in the respective strategies.
2.4. Evaluation Method of Each Strategy's Effectiveness
Because the trip distances of the respective vehicles are different, we define travel-time efficiency (TTE) to evaluate travel efficiency, which is expressed as follows.
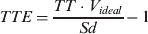
where, TT is the time of the trip, and Sd is the shortest distance between the origin and destination of the trip. TTE is calculated for every trip, once the vehicle has arrived at its destination. ATTE k is defined as the average TTE of all the vehicle agents having the same strategy k. ATTE k is calculated after every simulation episode to evaluate each strategy. When ATTE k is close to 0, it means that the vehicles using strategy k can travel with ideal efficiency.
2.5. Simulation Settings
A series of computer simulations are reported as follows. First, N vehicle agents are generated on a road network. Their initial allocated starting points and first destinations are determined randomly. When each vehicle arrives at its destination, a new destination is assigned, as explained in the previous section. Each agent continues this process until the end of a simulation episode. Congestion information used by ST, ST-RIS, and ST-pRIS is updated for every t update time step.
Next, we introduce replicator dynamics to reproduce the dominant strategy by considering the dynamics of the number of vehicles of each strategy between generations. The replicator dynamics equation (originally proposed in the field of biology) expresses a simple idea—the increasing rate of a certain strategy is proportional to the difference between the expected payoff of the focal strategy and the whole average expected payoff based on the current strategy distribution. In the present model, the replicator dynamics equation is expressed as follows.

where St k is the assumed fraction for strategy k at a simulation episode, and  is the revised fraction for strategy k resulting from the specified simulation episode.
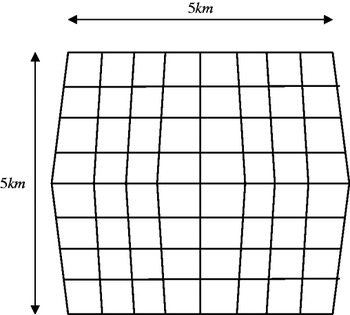
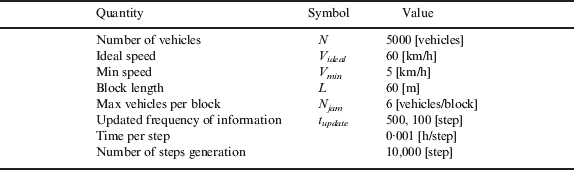
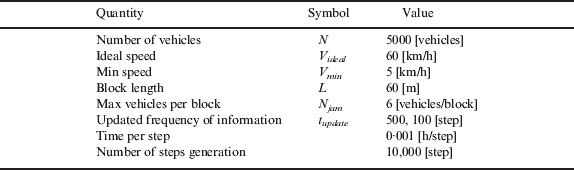
A set of parameters for each simulation is presented in Table 2. Although they are empirical parameters, we assumed them based on preliminary simulations and real-world situations. In this paper, we assume a skewed square lattice (Figure 5) for a road network. To assume a skewed lattice instead of a fair square lattice, SD agents select the respective “real” shortest routes instead of choosing them at random.
Road network.

Settings of each parameter.
We assume three cases as follows.
Using Case 1 as the control case, the three CNS strategies SD-CM, ST, and ST-RIS are assumed. We also assume t update=500[step].
In Case 2, the same three strategies are used as in Case 1, but t update=100[step] is assumed, which indicates a top-shelf VICS information system with high-time resolution.
In Case 3, ST-pRIS is introduced instead of ST-RIS, and t update=500[step] is assumed. By comparing Case 1 and Case 3, we can evaluate the effectiveness of ST-pRIS.
At the beginning of each simulation episode for these three cases, we vary the initial strategy distribution to obtain the vector-counter figures (Figures 8–10), indicating how the three CNSs share the social pie at equilibrium situation (in other words, the infinite time elapsed).
3. RESULTS
3.1. Case 1
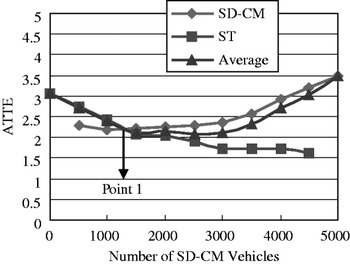
First, Figure 6 indicates how a society, which was allowed only SD-CM and ST strategies (the proportion of ST-RIS is set to zero), behaved. The horizontal axis denotes the number of SD-CM vehicles among N vehicles and the vertical axis denotes the ATTE of the SD-CM strategy vehicles.
ATTE of SD-CM and ST vehicles in Case 1.

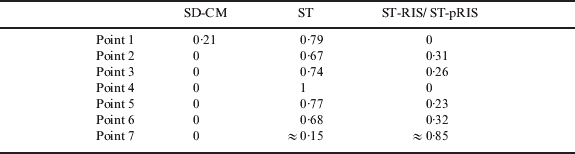
When the number of SD-CM strategy vehicles is small, they obtain a higher payoff (ATTE is small) than those under the ST strategy, the reverse situation of which is also true for a case where there is a small proportion of ST strategy vehicles. This can be explained as follows. If one strategy increases significantly more than the others, there will be many agents choosing the same optimum route, which inevitably causes congestion. This particular phenomenon appears to be the same as a phase of the minority game [Reference Arthur5]. In addition, this can be thought to represent a chicken-type dilemma game [Reference Tanimoto and Sagara7] if we regard ST as a cooperative strategy (“cooperative” seems appropriate, because ST avoids the shortest distance route). This phenomenon is also observed in other strategy pairs. We should note that the equilibrium point (point 1 in Figure 6) is different from the maximum payoff point (this is actually one of the reasons why this should be called a social dilemma game).
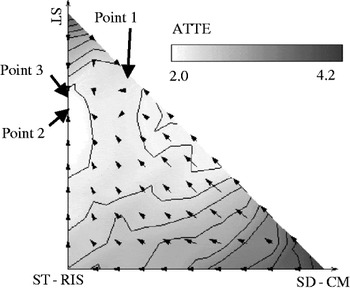
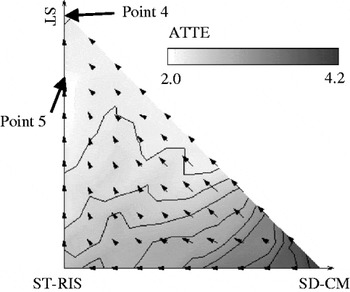
In Figure 7, the contour line indicates the average ATTE of all strategies, and the superimposed vector diagram indicates the amount of strategy rate changes derived from Equation (9). Namely, a stream line indicated by vectors means a specific social dynamics when an arbitrary initial strategy distribution is given. The horizontal and vertical axes denote the number of SD-CM and ST vehicles, respectively. Because the number of all vehicles (N) is defined, the axis of the third strategy, ST-RIS, can be shown by the 45-degree line to the cross-point of both axes. The contour colour shows that the more the white colour, lower the ATTE, and higher the payoff of the society as a whole. The cross-sectional view of the longer side of the triangle of Figure 7 is equivalent to Figure 6.
Contour showing the average ATTE for all strategies in Case 1. Vector map shows change of the number of vehicles obtained from (9).

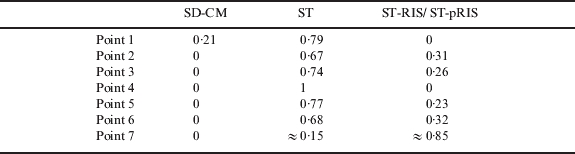
One important observation in Figure 7 is the equilibrium strategy distribution (in other words, the strategy fraction when the time infinitely elapses, or the social equilibrium situation). For example, in a society where ST-RIS does not exist (before an information-sharing CNS was introduced), SD-CM is attracted to the internal equilibrium position shown in point 1 (consistent with point 1 in Figure 6), and a stable coexistence situation of SD-CM and ST is achieved. However, if ST-RIS were introduced, SD-CM would eventually disappear and the society would have the coexistence equilibrium of ST-RIS and ST (point 3 in Figure 7).
The minimum point of ATTE (point 2 in Figure 7) nearly corresponds with the internal equilibrium point (point 3 in Figure 7), but they are different, indicating that phenomena such as those of the minority game have occurred to a small extent. Numerical values of the strategy distribution at each point are summarized in Table 3.
Strategy distribution at each point in Figures 7–9.
3.2. Case 2
The result shown in Figure 8 is similar to that in Figure 7. When congestion information is updated more frequently, the equilibrium seems to be almost an oligopoly of ST (the ST-RIS vehicles are almost extinct; see point 4 in Figure 8). This shows that when the accuracy of information is improved by frequent updating, the ability of ST-RIS to predict future congestion gradually decreases, which implies that the strategy using the present congestion information (ST) becomes relatively stronger. Moreover, the discrepancy between the social utility maximum point (point 5 in Figure 8) and the equilibrium point (point 4 in Figure 8) becomes larger, as compared with Case 1 (the discrepancy between point 2 and point 3 in Figure 7).
Contour showing the average ATTE for all strategies in Case 2. Vector map shows change of the number of vehicles obtained from (9).

3.3. Case 3
The result of this case shown in Figure 9, is similar to that of Case 1, but ST-pRIS is used as the third strategy instead of ST-RIS. When ST-pRIS is introduced, SD-CM disappears at the equilibrium point, similar to the two cases described before. In addition, the internal equilibrium point (point 6 in Figure 9), consisting of ST and ST-pRIS, implies almost the same strategy fraction as in Case 1 (point 3 in Figure 7). Meanwhile, the social utility ATTE is different when the third strategy becomes a social majority (by means of a public subsidy, for example). Namely, ATTE, enclosed by a dotted line in Figure 9, is much lower than the same area in Figure 7. At the equilibrium point (point 6 in Figure 9), the social utility improved more than that in Case 1, although the social share of ST-pRIS is almost the same as that of ST-RIS in Figure 7 (see point 3 in Figure 7). It is believed that social utility has improved, because the vehicles using the ST-pRIS strategy can choose a different route from each other (because of information uniformity), and therefore, never encourage congestion.
Contour showing the average ATTE for all strategies in Case 3. Vector map shows change of the number of vehicles obtained from (9).

4. DISCUSSION
According to the results of Case 1, the normal CNS (ST strategy) can be increased up to a certain proportion, which is considered as follows. When the number of normal CNS vehicles (ST strategy) increases, many CNSs choose the same route based on the same traffic information, generating traffic congestion. When a single ST-RIS strategy is introduced into the ST and SD-CM society, SD-CM eventually disappears. Hence, it can be as assumed that the efficiency of the whole CNS (ST and ST-RIS) can be increased by introducing the information-sharing CNS (ST-RIS). However, there are few differences in the social utilities of the equilibrium point of SD-CM and ST (point 1 of Figure 7) and that of the final state (point 2 of Figure 7). This suggests that the introduction of the information-sharing CNS does not remarkably influence the social utility.
According to the results of Case 2, when traffic-congestion information is updated more frequently, the normal CNS (ST strategy) becomes more superior to the information-sharing CNS (ST-RIS) strategy, which can be explained as follows. Frequent updating improves the accuracy of congestion information, which the normal CNS (ST) can access. However, the information-sharing CNS (ST-RIS) strategy causes deterioration in information accuracy through the incorporation of shared information.
In the future, when technology progresses and traffic-congestion information can be received in real time, the information-sharing CNS will become meaningless, because the normal CNS will be able to solve congestion problems.
Finally, after considering the results of Case 3, it can be said that the partial-information-sharing CNS (ST-pRIS) becomes a major strategy, and the social utility is improved when compared with Case 1. The reasons are thought to be as follows. They can choose different routes from each other by collecting different information. In addition, collecting information from only forward vehicles may increase the accuracy of information.
Moreover, the partial-information-sharing CNS is more worthy of consideration than the information-sharing CNS, both in terms of practical application as well as its effectiveness, as discussed above. The information-sharing CNS needs huge computer resources to accumulate the traffic-congestion information from several ST-RIS vehicles. However, a vehicle with a partial-information-sharing CNS collects and calculates congestion information, which means “independent, distributed, and local control.” Therefore, huge computer resources such as the route-information server are not required.
However, there are some problems that need to be addressed before practical usage. For example, the CNS system needs to send private information (origin, destination, etc.) to the other vehicles. Therefore, it is necessary to retain privacy in terms of information processing.
5. CONCLUSION
In this paper, we considered the mechanism of traffic congestion caused by CNS vehicles. We then constructed a traffic model to deal with two different scales: the traffic congestion as a macroscale phenomenon, and the route choice as microscale behavior. After that, we examined a well-known problem that the normal CNS is likely to generate, congestion by choosing the same routes. To overcome this, we proposed the partial-information-sharing CNS (ST-pRIS) strategy, and illustrated that it can improve not only the individual utility, but also the utility of the whole society.
Our result can be interpreted from the game theoretical point of view. Although information shearing sounds novel in terms of ITS context, a simple concept to globally share navigating information of respective car agents cannot help bringing a social dilemma situation emulated by Minority Games. To avoid this social dilemma imposing relatively lower payoff to an agent who takes a simple information sharing strategy, the concept of partial sharing might be one of the solutions. By “partially” shared navigation information only with closer agents, information uniformity can be broken down effectively, which encourages less congestion than globally shared cases.
As part of our future tasks, we need to improve the reality of the model. The road network used in this model needs to be based on a real city roadmap or highways between cities.
ACKNOWLEDGEMENT
This research was supported by the International Communication Foundation awarded to Prof. Tanimoto. We would like to express gratitude to the funding sources.