





1. Introduction
European policy has increasingly aligned industrial and environmental objectives around the Green Deal and the Circular Economy Action Plan (European Commission, 2019, 2020). These frameworks translate decarbonisation and resource-efficiency targets into product requirements, market instruments, and governance mechanisms aimed at reducing material throughput, extending product lifetimes, and improving recovery and reuse. The Ecodesign for Sustainable Products Regulation, together with the Sustainable Products Initiative and related ecodesign and market surveillance measures, reinforces these goals by embedding life cycle thinking into product regulation, performance requirements, and information obligations (European Commission, 2022; European Parliament and Council, 2024). The overall policy direction is therefore not limited to waste management but oriented towards upstream design, disclosure, and accountability across the full product life cycle.
At the same time, the literature links digitalisation with circular economy outcomes by emphasising transparency, traceability, and interoperability as enablers of higher-value recovery, reuse, and refurbishment (Chauhan et al., Reference Chauhan, Parida and Dhir2022; Sánchez-García et al., Reference Sánchez-García, Martínez-Falcó, Marco-Lajara and Manresa-Marhuenda2024; World Economic Forum and Ellen MacArthur Foundation, 2016). Digital Product Passports (DPPs) are emerging as a key policy instrument: a standardised, interoperable information system that links product data across supply chains to reduce information asymmetries and data silos. By improving access to life cycle information, DPPs are expected to enable design-for-circularity, more reliable secondary markets, and more effective compliance and enforcement. As implementation becomes imminent in priority sectors (e.g., batteries), a critical gap remains: the potential impacts are not yet assessed, and monitoring real-world effects is challenging without a clear baseline and quantified expectations.
Several European research initiatives are developing and piloting DPP architectures and applications. Among them, the CE-RISE Horizon Europe project focuses on selected value chains, including heat pumps, batteries, solar panels, printers, and small electronics. This paper addresses the challenge of estimating the potential impacts of DPP systems and associated innovation. We synthesise evidence on potential circularity gains, establish a baseline for the relevant value chains, and combine these two knowledge streams to estimate detailed potential gains. The aim is to provide a structured foundation for subsequent results and to support monitoring of future DPP deployment.
Throughout the paper, ‘circularity outcomes’ refers to the recycling- and refurbishment-related outcomes that can be operationalised with the available production, trade, and WEEE data. It does not cover the full circular economy strategy space, including reuse, repair, remanufacturing, lifetime extension, rental, product-as-a-service, and other circular business models.
2. Approach
Our approach is based on two main activities. First, we review the literature for evidence of impacts from digital innovations such as DPPs to assess the achievable impact of DPP adoption, based on a systematic literature review and evidence-informed scenario parameterisation of peer-reviewed and grey-literature evidence. Second, we fetch and harmonise secondary data about production, trade, and current levels of circularity to build a baseline for the selected products. We conclude by joining the information on achievable impacts to estimate the range of possible impacts of DPPs in different countries and products.
2.1. Systematic literature review
2.1.1. Aim and protocol
We conduct a PRISMA 2020-compliant systematic literature review (Page et al., Reference Page, McKenzie, Bossuyt, Boutron, Hoffmann, Mulrow, Shamseer, Tetzlaff, Akl, Brennan, Chou, Glanville, Grimshaw, Hróbjartsson, Lalu, Li, Loder, Mayo-Wilson, McDonald and Moher2021), with a publicly available preregistration (Boero et al., Reference Boero, Las Heras Hernández and Guerreiro2025). The review is designed as a generalised, cross-disciplinary protocol to accommodate both academic and grey literature, reflecting the diverse evidence base on innovations aiming at information sharing like DPPs and circularity impacts. The overarching aim is to estimate, from theory and pilot evidence, the potential upper bounds of DPP-enabled improvements in recycling and refurbishment rates.
The review follows staged procedures encompassing preparation, search, screening, information extraction, synthesis, and reporting. The extraction focuses on potential recycling and refurbishment rates by product category and region, along with uncertainty ranges, key assumptions, and enabling or constraining factors. The synthesis is structured to map estimated potential gains to product types reported in the literature.
2.1.2. Rationale and limitations
The review emphasises quantified impacts to support the derivation of potential ranges and to enable alignment with the material flow indicators used in the empirical analysis. Given the nascent state of DPP deployment, evidence is expected to be heterogeneous and often model-based; this motivates the inclusion of grey literature and pilot studies alongside peer-reviewed sources. The main limitations arise from the potential variability in product definitions, differing baselines across studies, and the scarcity of large-scale empirical deployments.
Accordingly, the review is not treated as a conventional meta-analysis capable of estimating a robust causal effect size. Its purpose is to derive a transparent scenario input from the available quantified evidence, while making the small sample size and heterogeneity explicit. The resulting set of only five eligible studies is therefore not a shortcoming to be remedied by relaxing the protocol, but a reflection of the current state of the evidence: broadening it would require loosening the inclusion criteria and methodological rigour the review is designed to uphold, so the scarcity of rigorous quantified evidence is itself a finding, faithfully expressed by the deliberately wide uncertainty interval reported below.
2.1.3. Search phase
We define a structured query to capture DPP-related information-sharing mechanisms linked to circularity outcomes, with explicit filters for product categories and evidence types. The syntax is expressed below in database-agnostic pseudocode to ensure transparent translation across bibliographic platforms while retaining the same conceptual logic and constraints:

The search strategy was intentionally broad and outcome-oriented rather than specific to ICT equipment, because the objective was to estimate a general distribution of DPP-like digital information impacts across product contexts. Adding explicit ICT equipment terms would likely have narrowed an already limited evidence base. Reuse and remanufacturing were represented through the rate terms reuse rate*, return rate*, and remanufactur*, whereas maintenance was not included because its effects are generally expressed through lifetime extension or failure-rate changes that could not be operationalised consistently in the production, trade, and WEEE indicator framework used here.
Applying this query to titles and abstracts returned 10 records in Web of Science (Clarivate, 2025), 3 publications in Dimensions (Digital Science, 2025), and 10 results in OpenAIRE (OpenAIRE, 2025). After aggregating and downloading the 23 total entries, 4 duplicates were removed, resulting in 19 consolidated records.
The restriction to English was used to ensure consistent screening and extraction across databases. This restriction may exclude national-language evidence from EU27 countries, especially grey literature and country-specific reports, and is therefore treated as a limitation of the review.
The three sources were selected to cover complementary evidence types: curated peer-reviewed literature (Web of Science), broader research outputs (Dimensions), and European open-science and grey-literature records (OpenAIRE). Although this combination covers the main evidence channels targeted by the review, additional databases could identify further references.
2.1.4. Screening phase
Given the limited number of references, we proceeded with a fully manual review without AI support. Full manuscripts were downloaded and screened in Zotero, applying a manual filter to exclude studies that did not quantify circular economy impacts. This screening step removed 14 papers (Cheng et al., Reference Cheng, Hao, Tao and Zhou2021; Daramola et al., Reference Daramola, Apeh, Basiru, Onukwulu and Paul2023; Delavar et al., Reference Delavar, Gilani and Sahebi2022; Guo, Reference Guo2022; Vives Pons et al., Reference Vives Pons, Comerma, Escobet, Dorado and Tarrés-Puertas2025; X. Wang et al., Reference Wang, Ma and Hu2022; Y. Wang, Ji, Lang, et al., Reference Wang, Ji, Lang and Zhang2025; Y. Wang, Ji, Lin, et al., Reference Wang, Ji and Lin2025; Wautelet & Ayed, Reference Wautelet and Ayed2024; Xia et al., Reference Xia, Gao, Chao and Wang2015; Xing & Wang, Reference Xing and Wang2025; Yang & Wang, Reference Yang and Wang2024; Yi et al., Reference Yi, Fu, Li and Zhang2024, Reference Yi, Fu, Zhang and Li2025), leaving 5 studies in the final review set (Jagtap & Bagul, Reference Jagtap and Bagul2025; Nagashree & Leela, Reference Nagashree and Leela2019; Ortego et al., Reference Ortego, Valero, Van Schaik, Iglesias-Émbil, Reuter and Alcoceba2024; Santhuja & Suresh, Reference Santhuja and Suresh2025; Zvarych & Drapak, Reference Zvarych and Drapak2025). The selected studies cover digital traceability, IoT-enabled waste management, blockchain integration, and circularity assessments in electronics and value chains, providing evidence on potential improvements and operational constraints.
2.2. Data analysis workflow
We developed an open-source software (Boero, Reference Boero2026, v0.1.2) to operationalise and make transparent and replicable the analytical workflow. It combines production, trade, and circularity parameters into product-level indicators.
The software implements the empirical workflow in four linked phases: data acquisition, harmonisation, circularity-parameter and indicator construction, and aggregation and reporting. The following subsections describe the phase-specific operations. Product definitions, code mappings, weights, current circularity assumptions, and scenario parameters are stored in configuration files, allowing assumptions to be inspected and changed independently from the processing code. The workflow preserves raw, intermediate, and processed database tables, supporting auditability and rerunning the analysis when source data or assumptions change.
2.2.1. Scope and assumptions
All scope definitions and assumptions are encoded in a structured configuration file that specifies the product list, the relevant statistical sources (PRODCOM production statistics and COMEXT trade statistics), and their code systems (PRODCOM product codes and HS6 codes, with explicit handling of nomenclature epochs), optional WEEE categories, and product parameters such as typical weights, reporting units, and current refurbishment rates. A global circularity uplift distribution is defined for scenario analysis, expressing the potential improvement range derived from the literature. This separation of scope and assumptions from the data pipeline ensures that changes in product definitions or assumed rates can be traced and reviewed without altering the processing logic. The scope prioritises product groups that are policy relevant, material intensive, and exposed to circularity regulation, while remaining consistent with the statistical coverage of PRODCOM and COMEXT. The configuration file is preserved on the project website, along with other materials relevant for this research, as supplementary material to this work (Boero et al., Reference Boero, Las Heras Hernández and Guerreiro2026).
This study focuses on heat pumps, photovoltaic (PV) panels, printers, smartphones, computers and related ICT equipment, and batteries. The selection follows the CE-RISE value chains and prioritises sectors with high material intensity, large installed stocks, and clear end-of-life streams. To enable cross-dataset quantification, the products are mapped across production statistics (PRODCOM), trade statistics (COMEXT/HS), and waste statistics (WEEE categories). Table 1 provides the consolidated coding scheme, including legacy and updated PRODCOM codes where available. The coding alignment also reveals where existing statistical frameworks are incomplete for circularity assessment, such as battery products not represented in WEEE categories and ICT aggregates that require grouping multiple HS codes to approximate functional product families.
Selected product groups and corresponding statistical codes across PRODCOM, COMEXT/HS, and WEEE classification systems

Table 1 Long description
Columns list product, prodcom old, prodcom new, main hs comext codes, and eurostat weee code for 13 product groups. Heat pumps list prodcom old 28.21.13.30, prodcom new 28.25.13.80, hs 8418.69, and weee code ee_tee. Pv panels list prodcom old 27.11.40.00, prodcom new 26.11.22.40, hs 8541.43, and weee code ee_le_pvp. Printers list prodcom old 26.20.12.30, prodcom new 26.20.18.00, hs 8443.31, and weee code ee_sitte. Ict smartphones and ict other phones share prodcom new 26.30.22.00, with hs 8517.13 for smartphones and 8517.14 for other phones, and both use weee code ee_sitte. Ict portable computers list prodcom old 26.20.13.00, prodcom new 26.20.11.00, hs 8471.3, and weee code ee_sitte. Ict other computers list prodcom old 26.20.14.00, prodcom new 26.20.13.00 and 26.20.14.00, hs 8471.41 and 8471.49, and weee code ee_sitte. Ict monitors and i o units list prodcom old 26.20.16.00, prodcom new 26.20.17.00, 26.20.16.50, and 26.20.16.60, hs 8528.52 and 8471.60, and weee codes ee_sme and ee_sitte. Ict storage units list prodcom old 26.20.17.00, prodcom new 26.20.21.00, hs 8471.7, and weee code ee_sitte, and ict other units list prodcom old 26.20.18.00, prodcom new 26.20.30.00, hs 8471.8, and weee code ee_sitte. Full ict, prodcom 26.20 lists prodcom old 26.2 and prodcom new 26.2, hs codes 8517.13, 8517.14, 8471.30, 8471.41, 8471.49, 8528.52, 8471.60, 8471.70, and 8471.80, and weee codes ee_sitte and ee_sme. Batteries li ion list prodcom old and new 27.20.23.00 and hs 8507.6, with eurostat weee code shown as n slash a, and batteries other list prodcom old 27.20.24.00, prodcom new 27.20.21.00, 27.20.22.10, 27.20.22.50, and 27.20.23.00, hs 8507.10, 8507.20, 8507.50, and 8507.80, with eurostat weee code shown as n slash a.
2.2.2. Data acquisition and harmonisation
We fetched Eurostat production and trade statistics through dedicated APIs. Production uses the PRODCOM datasets for sold production and, when required, total production; trade uses COMEXT at the HS6 level. The acquisition workflow applies rate limiting and robust error logging to properly manage temporary API outages throughout the pipeline. Data are downloaded per year and stored in a raw, immutable layer to preserve original payloads and metadata for traceability. This design allows later transformations to be audited against the original Eurostat responses and supports reproducibility across time windows.
PRODCOM uses numeric country identifiers and product codes with dot formatting; COMEXT uses ISO country codes and HS6 product codes. The pipeline reconciles these differences by applying correspondence tables derived from the configured product codes and a country-code crosswalk. Trade data from COMEXT are treated as authoritative; PRODCOM trade indicators are only used as fallbacks when COMEXT reports zero values for the same product-year, to avoid double counting. Quantities are converted to tonnes where possible, and values are harmonised to EUR. The output is a harmonised production-trade dataset with shared dimensions (product, year, geography, and indicator type), enabling consistent analysis across countries and time. When classification changes occur across years, code epochs prevent cross-walking products to incompatible code lists.
2.2.3. Circularity parameters and indicator construction
Circularity parameters are stored alongside the processed data to guarantee provenance and reproducibility. When available, the pipeline integrates Eurostat waste statistics for WEEE and batteries and waste treatment recovery efficiencies, which provide observed collection and recovery rates. Material composition and recovery rates are derived from Urban Mine Platform (2025) WEEE Sankey flows; if a year is missing, the most recent prior year is carried forward with an explicit warning. WEEE categories in the product configuration are mapped to UMP categories to derive product-level material shares and recovery rates. Product weights are harmonised by combining configuration weights with observed counts or masses from production and trade data, allowing conversion between mass-based and unit-based indicators when one of the two is missing.
We computed production, trade, and apparent consumption (production + imports - exports) in tonnes and EUR for each product-year-country combination. Circularity indicators are then derived for refurbishment and recycling strategies, including potential material savings and avoided production. Circularity is defined as the sum of measurable recycling and refurbishment channels. This operational definition is narrower than the full circular economy strategy space. Other circular strategies, such as reuse, repair, remanufacturing, lifetime extension, rental, and product-as-a-service models, may be important but are difficult to capture with production, trade, and WEEE statistics because use-phase data, service lifetimes, ownership models, and informal flows are not consistently observed. The results should therefore be interpreted as recycling- and refurbishment-related circularity outcomes, not as a complete measure of circular economy performance. Results are aggregated to EU and national levels to support comparisons across geographies and time, and to link product-level assumptions with macro-level material flow implications. The pipeline yields reproducible, year-resolved circularity indicators with traceable inputs and intermediate datasets, enabling transparent replication of the results reported in subsequent sections. Sensitivity to assumptions is addressed by keeping all circularity parameters explicit and by allowing alternative configurations to be run against the same data extraction and harmonisation logic.
The scenario is implemented at product-country-year level rather than as a single top-down EU extrapolation. For each product-country observation, the uplift parameter is applied to the current circularity rate, and potential material and monetary savings are calculated from that observation's apparent consumption in mass and value. EU27 and non-EU results are then obtained by aggregating these country-level outputs. The main transferability assumption is therefore not the accounting scale of the calculation, but the use of a common DPP-related uplift distribution across heterogeneous product-country contexts.
Non-positive apparent consumption is treated as a boundary case rather than as negative recoverable material. Such observations can arise from re-exports, transshipment, timing differences between production and trade reporting, inventory changes, or product-code mapping gaps. In the baseline calculation, these observations are retained in the apparent-consumption accounting but excluded from potential savings by setting savings to zero. As a sensitivity check, we also compare this rule with a signed-flow alternative in which the uplift is applied to signed apparent consumption. This alternative is conservative for re-exporting contexts but can generate negative ‘savings’, which are not physically meaningful as recoverable circularity potential.
The software implementation of the pipeline we used is openly accessible and preserved (Boero, Reference Boero2026). All configuration files and raw and processed databases are equally openly accessible and preserved through the project website (Boero et al., Reference Boero, Las Heras Hernández and Guerreiro2026).
3. Results
3.1. Systematic review of potential DPP impacts on circularity
3.1.1. Extracted estimates
Table 2 summarises the extracted impact estimates reported in the five studies analysed. Because only five studies met the inclusion criteria, the evidence synthesis should be read as a scenario-parameterisation exercise rather than as a robust meta-analytic estimate. Grey literature is retained because DPP-like systems are recent and much quantified evidence is generated in pilot, policy, or technical settings before appearing in journal articles. Where a study reports a range or multiple context-specific values, each is retained to preserve the reported uncertainty and heterogeneity. The small evidence base does not support analysing barriers or constraints on impacts, nor does it allow a product-level breakdown of impacts by technology or product type.
Extracted impact estimates from the five reviewed studies

Table 2 Long description
Columns list Reference, Keywords, and Extracted value in percent. Jagtap and Bagul 2025 lists keywords including e waste, Internet of Things, blockchain, AI, recycling, smart cities, and gamification, with extracted values from 0 to 59 percent. Nagashree and Leela 2019 lists IoT, AI, waste management, embedded system, and WiFi, with an extracted value of 23 percent. Ortego and others 2024 lists digital twin, car electronics, combimeter and infotainment, metal recycling, and circular recovery, with an extracted value of 40 percent. Santhuja and Suresh 2025 lists e waste management, smart recycling, waste traceability, resource recovery, automated waste classification, and sustainable waste management, with extracted values of 30.8 percent for New York, 38.3 percent for London, 25.7 percent for Tokyo, and 29.0 percent for Berlin. Zvarych and Drapak 2025 lists circular economy, value chain optimisation, global trends, regional features, and sustainability, with extracted values from 20 to 30 percent.
3.1.2. Distribution of impacts
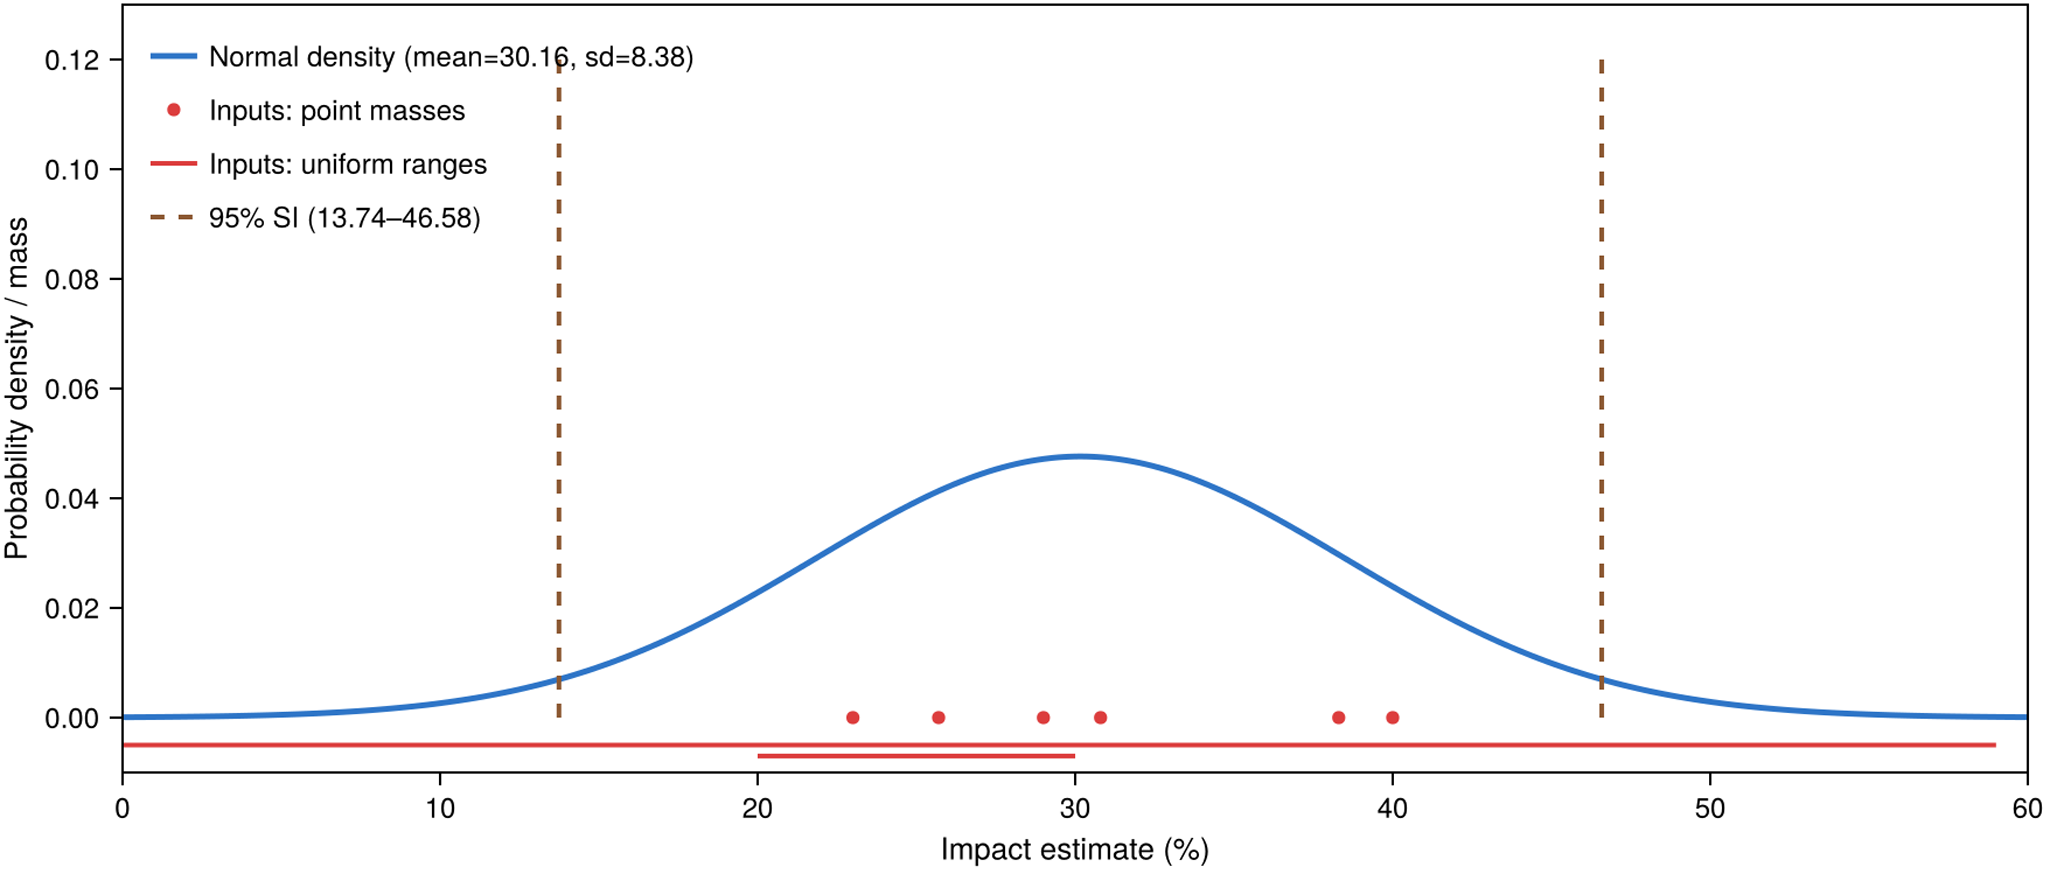
To construct the scenario parameter from the extracted evidence, we define a mixture distribution with eight equally weighted components: two uniform ranges (0–59 and 20–30) and six point masses (23, 40, 30.8, 38.3, 25.7, 29.0). The resulting distribution has mean 30.1625, standard deviation 8.3776, minimum 0, and maximum 59 (per cent units). This equal-weighted specification is a transparent approximation for sensitivity analysis rather than a claim that the five sources identify a transferable causal effect.
The percentage-point interpretation is used because the reviewed sources report changes in rate-like outcomes or final recovery shares, while baseline denominators are not reported consistently enough to reconstruct relative effects. Treating the values as percentage-point changes therefore preserves the closest available interpretation of the source evidence, although it remains a scenario assumption rather than a directly estimated transferable effect.
For visualisation and interval reporting, we approximate this mixture with a normal distribution using the same mean and standard deviation. This approximation is not used to claim that the heterogeneous source evidence is normally distributed, nor that the resulting interval is a sampling-based confidence interval. Rather, it provides a transparent uncertainty representation for scenario parameterisation. Compared with applying only the average uplift, the normal approximation preserves both the central tendency and dispersion implied by the extracted ranges and point estimates. We therefore report the resulting 95% range as a sensitivity interval and use it in the data analysis workflow to propagate uncertainty around the DPP scenario. Figure 1 plots the normal density and overlays the extracted data points and sensitivity-interval markers.
Normal approximation of the extracted impact distribution with point estimates overlaid.

We verified that this scenario input is not an artefact of the equal-weighted normal specification: alternative weighting schemes (including weighting by study rather than by extracted value) and non-parametric percentile bounds computed from the same mixture all leave the central uplift near 30 percentage points with comparable sensitivity intervals, so the common-uplift distribution should be read as a deliberately wide bounding envelope for scenario analysis rather than a precise effect transferable across product, regulatory, and waste-management contexts.
3.2. Data analysis results for European economies
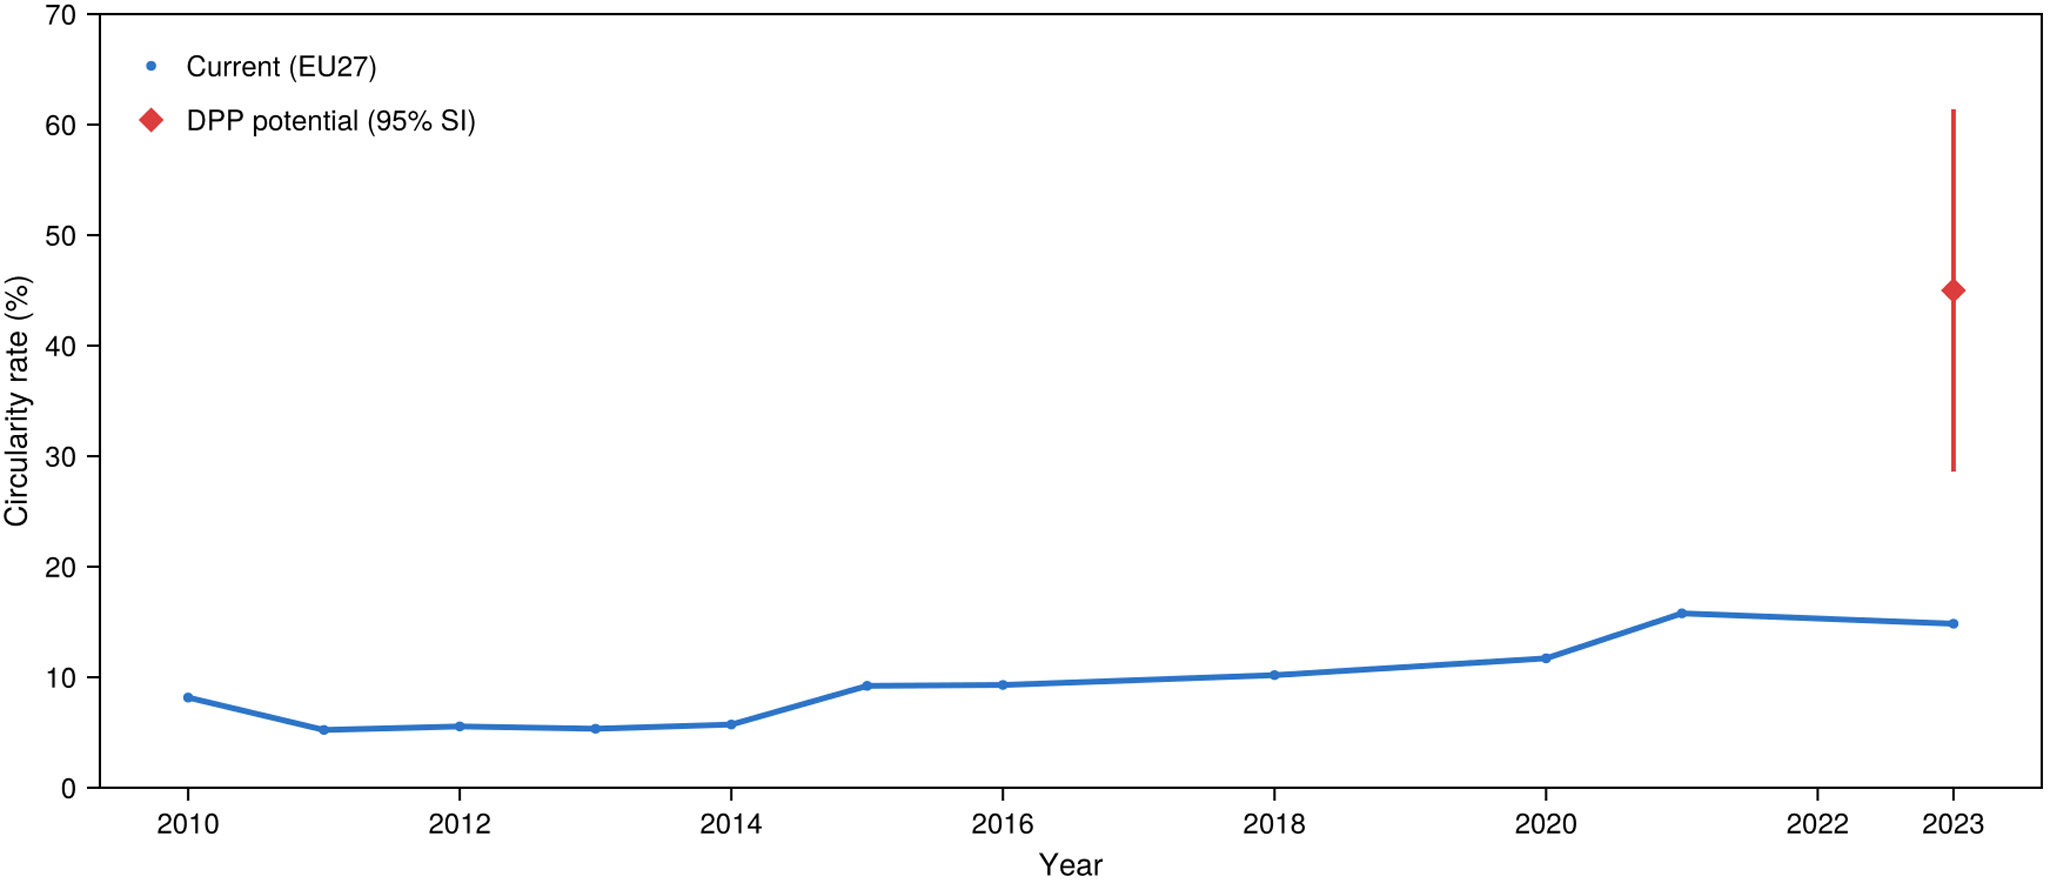
We report results for 2010–2023 and omit 2024 to avoid incomplete coverage. We compare the EU27 aggregate with a non-EU European group limited to Switzerland (CH), Norway (NO), and Turkey (TR), and we exclude codes with partial coverage (XI, XK, XS). Recall that the circularity rate is defined as the sum of recycling and refurbishment (with repair/remanufacturing treated as refurbishment-like extensions).
In 2023 (Table 3), EU27 apparent consumption across the selected products totals 7.3 Mt and EUR 193.0 billion (bn). Production is 2.7 Mt and EUR 15.8 bn, while imports and exports reach 21.0 Mt (EUR 554.5 bn) and 16.4 Mt (EUR 377.4 bn), respectively. The current circularity rate is 14.8%, with a potential circularity rate of 45.0% under the DPP scenario. Current recycling savings are 0.80 Mt and EUR 11.9 bn, while potential savings rise to 2.5 Mt and EUR 27.9 bn. These figures provide a benchmark against which future implementation outcomes can be monitored.
Baseline material flows for 2023 (Mt and EUR bn)

Table 3 Long description
Metrics are listed for EU27 and for non EU, CH NO TR, with values reported in Mt and in EUR bn for production, imports, exports, and apparent consumption. For EU27, production is 2.73 Mt and 15.8 EUR bn. EU27 imports are 20.95 Mt and 554.5 EUR bn, and exports are 16.43 Mt and 377.4 EUR bn. EU27 apparent consumption is 7.26 Mt and 193 EUR bn. For non EU, CH NO TR, production is 0 Mt and 0 EUR bn. Non EU, CH NO TR imports are 0.91 Mt and 30.5 EUR bn, exports are 0.77 Mt and 4.4 EUR bn, and apparent consumption is 0.15 Mt and 26.1 EUR bn.
The 45.0% potential circularity rate should be interpreted as an upper potential scenario conditional on the literature-derived uplift and full applicability of the selected DPP-related mechanisms, not as an expected forecast of realised circularity after DPP implementation.
For the non-EU group (CH, NO, TR) in 2023, apparent consumption is 0.15 Mt and EUR 26.1 bn. Production values are reported as zero in the dataset for these countries, so the comparison focuses on trade and consumption. Imports are 0.91 Mt (EUR 30.5 bn), and exports are 0.77 Mt (EUR 4.4 bn). The current circularity rate is 21.1%, with a potential rate of 51.3%. Current recycling savings are 0.03 Mt and EUR 3.18 bn, while potential savings are 0.20 Mt and EUR 8.45 bn. In this group, some product-country flows have non-positive apparent consumption (exports exceed imports plus production). This can reflect re-exports and transshipment, timing mismatches between production and trade reporting, inventory changes not captured by apparent consumption, COVID-era logistics disruptions and stock adjustments, or mapping/coverage gaps in the underlying codes. These negative entries can materially reduce the net total apparent consumption. For the savings calculation, we treat non-positive apparent consumption as outside the recyclable/refurbishable universe and set savings to zero for those flows; as a result, aggregate potential savings is slightly larger (0.20 Mt) than net apparent consumption (0.15 Mt).
A sensitivity check confirms that this rule mainly affects the non-EU material estimate. In 2023, positive product-country flows in the non-EU group (CH, NO, TR) sum to 0.63 Mt and negative flows to −0.49 Mt, giving the reported net apparent consumption of 0.15 Mt. Under the baseline rule, potential material savings are 0.20 Mt. Under the signed-flow sensitivity, potential material savings fall to 0.05 Mt, while monetary savings change only slightly from EUR 8.5 bn to EUR 8.1 bn because negative-flow values are small relative to positive values. For the EU27 aggregate series, the same sensitivity has negligible effect on the headline estimate, changing potential material savings from 2.46 to 2.45 Mt and leaving monetary savings at EUR 27.9 bn. We therefore interpret the non-EU material savings estimate more cautiously, while the EU27 headline result is not materially affected by the negative-flow rule.
The time series show an overall increase from 2010 to 2023. EU27 current circularity rises from 8.2% to 14.8%, while potential circularity increases from 38.3% to 45.0% (Figure 2). The non-EU group increases from 9.5% to 21.1% current circularity and from 39.7% to 51.3% potential circularity. These trends underline the gap between observed performance and DPP-enabled potential in both groups. All monetary values are reported at current prices for each year. Inflation therefore affects comparisons of EUR-denominated values across years (e.g., the 2010 vs 2023 savings in Table 4), while physical quantities and within-year comparisons such as circularity rates are not sensitive to inflation dynamics.
EU27 circularity trend (current) with the 2023 DPP potential and 95% SI. Note: The series omits 2017, 2019, and 2022 due to missing data in the underlying indicator table.

Circularity trends for EU27 and non-EU Europe (CH/NO/TR), 2010 vs 2023

Table 4 Long description
Metrics are listed for EU27 and non-EU Europe for 2010 and 2023, covering current circularity percent, potential circularity percent, potential circularity sensitivity interval, and potential savings in megatonnes and in euro billions. Potential circularity for EU27 is 38.3 percent in 2010 and 45 percent in 2023, and for non-EU Europe is 39.7 percent in 2010 and 51.3 percent in 2023. Potential circularity sensitivity intervals are 21.9 to 54.7 for EU27 2010, 28.6 to 61.4 for EU27 2023, 23.3 to 56.1 for non-EU 2010, and 34.9 to 67.7 for non-EU 2023. Potential savings in megatonnes are 25.1 with a range of 11.4 to 38.8 for EU27 2010, 2.5 with a range of 1.1 to 3.8 for EU27 2023, 0.1 with a range of 0.1 to 0.2 for non-EU 2010, and 0.2 with a range of 0.09 to 0.31 for non-EU 2023. Potential savings in euro billions are 21.9 with a range of 10.0 to 33.8 for EU27 2010, 27.9 with a range of 12.7 to 43.1 for EU27 2023, 3.1 with a range of 1.4 to 4.9 for non-EU 2010, and 8.5 with a range of 3.9 to 13.1 for non-EU 2023.
Note: Potential values include 95% sensitivity intervals.
At the product-country level, we identify hotspots as combinations with high apparent consumption in both value (EUR) and mass (tonnes) and with positive potential savings. We rank country-product combinations on apparent consumption in value and mass, use the combined rank to select the top entries, and exclude zero potential-savings cases. The top-ranked combinations are concentrated in PV panels and Li-ion batteries. Ranked by apparent consumption (mass) and value, the top combinations include PV panels in Spain, Italy, France, and Poland, and Li-ion batteries in Germany, Italy, Belgium, Spain, the Netherlands, and the Czech Republic. These hotspots dominate both physical throughput and monetary exposure, and they therefore drive most of the projected DPP-enabled gains.
To contextualise employment exposure, we use Eurostat structural business statistics for the information and communication sector (NACE J), the latest available year (2020), noting that it includes services beyond manufacturing. Production value is EUR 1,185,205 million (mn) and employment is 6,419,526 persons, implying an average output of about EUR 184,625 per employee (Eurostat, 2025). The computation uses output per employee (production value divided by persons employed) and estimates job exposure as refurbishment-driven production reduction (EUR) divided by output per employee; sensitivity interval (SI) bounds are obtained by scaling the reduction using the potential savings of SI. This proxy reflects manufacturing exposure implied by reduced production associated with consumption, not necessarily local jobs in the reporting country, which is why non-EU Europe has a non-zero estimate even when reported production is zero. Applying this ratio yields an estimated 151,000 manufacturing-related jobs potentially affected in the EU27 (approximate SI: 68,800–233,200). For non-EU Europe (CH/NO/TR), the corresponding estimate is about 45,800 jobs (approximate SI: 20,900–70,700). This proxy is coarse: it applies a sector-average ratio and does not resolve product-, country-, or year-specific productivity differences, and it excludes recycling-related employment in waste collection and treatment and upstream effects in primary extraction, which require sector-specific data beyond the scope of the present study.
4. Discussion
The main scenario result is that DPP-enabled information sharing could materially improve measurable recycling- and refurbishment-related circularity outcomes in Europe under the assumptions used here, raising the circularity rate by 30.2 percentage points for the EU27 and non-EU Europe (CH/NO/TR). In absolute terms, this translates to 2.5 Mt and EUR 27.9 bn of potential savings for the EU27 (95% SI: 1.1–3.8 Mt; EUR 12.7–43.1 bn) and 0.20 Mt and EUR 8.5 bn for the non-EU group (95% SI: 0.09–0.31 Mt; EUR 3.9–13.1 bn) (Table 5). The analysis highlights that these gains are concentrated in a small number of high-throughput product-country combinations (Table 6), such as PV panels and Li-ion batteries with individual apparent consumption in the 30–651 kt range and potential savings in the 9–196 kt range.
Circularity indicators for 2023 (rates in percent; savings in Mt and EUR bn)

Table 5 Long description
Metrics compare EU27 with Non EU, CH, NO, TR for circularity rates in percent and savings in Mt and EUR bn. Current circ. is 14.8 for EU27 and 21.1 for Non EU. Potential circ. is 45 for EU27 and 51.3 for Non EU, and Potential circ. SI is 28.6 to 61.4 for EU27 and 34.9 to 67.7 for Non EU. Current savings are 0.8 Mt for EU27 and 0.03 Mt for Non EU. Potential savings in Mt are 2.46 with a range of 1.12 to 3.81 for EU27, and 0.20 with a range of 0.09 to 0.31 for Non EU. Potential savings in EUR bn are 27.9 with a range of 12.7 to 43.1 for EU27, and 8.5 with a range of 3.9 to 13.1 for Non EU.
Note: Potential values include 95% sensitivity intervals.
Top hotspot country-product combinations in 2023, ranked by apparent consumption in mass and value (combined rank)

Table 6 Long description
Country and product combinations are listed with apparent consumption in kilotonnes and in EUR million, plus potential savings in kilotonnes and in EUR million. Spain has PV panels at 650.9 kt and 2,602.3 EUR m, with potential savings of 196.3 kt and 784.9 EUR m. Italy has PV panels at 432.3 kt and 2,287.8 EUR m, with potential savings of 130.4 kt and 690.1 EUR m, and Li ion batteries at 109.5 kt and 3,145.3 EUR m, with potential savings of 33 kt and 948.7 EUR m. France has PV panels at 345.3 kt and 1,528.2 EUR m, with potential savings of 104.2 kt and 461 EUR m. Belgium has Li ion batteries at 99.8 kt and 2,919.8 EUR m, with potential savings of 30.1 kt and 880.7 EUR m, and Spain has Li ion batteries at 83.4 kt and 2,470.3 EUR m, with potential savings of 25.2 kt and 745.1 EUR m. Poland has PV panels at 225.7 kt and 869.9 EUR m, with potential savings of 68.1 kt and 262.4 EUR m. Netherlands has Li ion batteries at 67.8 kt and 1,121.9 EUR m, with potential savings of 20.5 kt and 338.4 EUR m, and Czechia has Li ion batteries at 30.1 kt and 1,624.1 EUR m, with potential savings of 9.1 kt and 489.9 EUR m.
The DPP scenario is grounded in a systematic review of quantified impacts of digital information in circular systems, but the evidence base remains small and heterogeneous. The resulting uplift should therefore be interpreted as a potential range rather than a deterministic forecast or definitive causal effect size, because outcomes depend on implementation quality, interoperability, and incentives across value chains. Nevertheless, the results indicate that improved traceability, product data access, and standardised reporting can shift both recovery and refurbishment performance in ways that materially alter aggregate circularity indicators, as evidenced by the 30-point uplift between current and potential rates.
This country-level implementation preserves observed differences in product flows, apparent consumption, and baseline circularity across countries. However, it does not eliminate uncertainty about whether the same DPP-related uplift can be achieved across all product-country contexts. The estimates should therefore be read as a harmonised scenario translation of the available evidence onto observed European flows, not as a validated forecast of realised impacts.
We also emphasise that the analysis considers a limited set of circular strategies, focused on recycling and refurbishment, and treats their effects as additive. This means that the reported gains may under-represent some circular economy benefits, while also excluding possible substitution, rebound, and interaction effects among strategies. In practice, these strategies can be interdependent and may affect each other through shared infrastructure, behavioural shifts, and market feedbacks. Secondary effects and rebound mechanisms may reduce net gains by slowing uptake, diverting material flows, or eroding incentives for adoption, which could temper both policy impacts and technology diffusion. These interactions and feedbacks are a natural next step for the research and will be addressed in future work.
Finally, this work also exposes limitations of using national accounts and official statistics to measure circularity. These systems were designed for linear, supply-based accounting and largely closed-economy interpretations, which makes them ill-suited for capturing circular strategies that occur in use phases, cross-border value chains, and service-based business models. Repair, remanufacturing, lifetime extension, rental, and product-as-a-service are often invisible in production and trade statistics, and material loops are fragmented across jurisdictions and statistical classifications. As a result, official data can underestimate or misclassify circular activity, particularly where reuse, informal flows, and digital services dominate. Addressing these limitations will require complementary data sources on product use, stocks, and service lifetimes, as well as revised statistical frameworks that treat circular economy strategies as first-class economic activities rather than residuals of linear supply chains.
5. Conclusion
This paper estimates how DPP-enabled information sharing could affect measurable recycling- and refurbishment-related circularity outcomes for selected product groups in Europe. By combining a systematic review of quantified digital-information effects with Eurostat production, trade, and WEEE data, the analysis links product-level evidence on circularity improvements to observed European material and monetary flows.
The results suggest that DPPs could make a material contribution where product flows are large, current circularity is limited, and positive potential savings are identifiable. Under the upper potential scenario, EU27 circularity increases from 14.8% to 45.0%, corresponding to potential annual savings of 2.5 Mt and EUR 27.9 bn. For the non-EU group considered here, circularity increases from 21.1% to 51.3%, with potential savings of 0.20 Mt and EUR 8.5 bn. These estimates should be interpreted as potential gains rather than forecasts, because they depend on implementation quality, interoperability, incentives, and the effective use of product information across value chains.
The main policy implication is that DPPs are likely to be most effective when targeted toward product-country combinations with high apparent consumption in both mass and value and with positive circularity savings. At the same time, the analysis is constrained by the limited and heterogeneous evidence base on DPP-like interventions, by its focus on recycling and refurbishment outcomes, and by the partial visibility of circular activities in official statistics. Future work should extend the evidence base, incorporate additional circular strategies such as reuse, repair, remanufacturing, and service-based models, and use product-level tracking data as DPP systems mature.
Acknowledgements
The authors thank colleagues at NILU and the CE-RISE project for feedback on the analytical framework. The authors also thank participants in the Innovation, Design, and Digital Solutions session at the 2025 World Resources Forum for feedback provided following the presentation of preliminary results.
The authors further acknowledge the use of ChatGPT (GPT-5.2, OpenAI) for proofreading and language polishing (e.g., improving clarity, grammar, and readability) of the manuscript. All substantive scientific choices (study design, analysis, interpretation, and conclusions) remained the responsibility of the authors. Other uses of large language models are documented in the article and made available through the adopted open-science approach.
Author contributions
Conceptualisation: R.B., M.L.H.H., C.G.; Methodology: R.B.; Data curation: R.B.; Formal analysis: R.B.; Writing – original draft: R.B.; Writing – review and editing: R.B., M.L.H.H., C.G.
Data availability statement
Data and code underlying the results, including the AI model configurations and prompts, are publicly available and reachable from the project website (see repository for license and reuse conditions) https://doi.org/10.17605/OSF.IO/U6SF3.
Funding statement
This research received funding from the European Union (Horizon Europe Framework Programme) (No. 101092281) – CE-RISE.
Competing interests
The authors declare no conflicts of interest.





 Open access

