

1. INTRODUCTION
In Hadron therapy, to treat deep seated tumors, proton beams with a maximum energy around 250 MeV or beams of carbon with up to 450 MeV/u are required. Currently, this can be achieved by conventional accelerators like cyclotrons or synchrotrons but at significant cost for accelerator and gantries for beam delivery. A summary of the requirements for Hadron cancer therapy can be found at Amaldi and Kraft (Reference Amaldi and Kraft2005). The widespread introduction of Hadron therapy for cancer treatment is inhibited by the large capital and maintenance cost of the accelerator and treatment facility that determine the cost per treatment. On the other hand side, recent experiments indicate that laser driven proton accelerators could be an alternative to conventional accelerators for certain applications, like isotope production or cancer therapy with Hadrons (Fuchs et al., Reference Fuchs, Audebert, Borghesi, Pepin and Willi2009; Kraft et al., Reference Kraft, Richter, Zeil, Baumann, Beyreuther, Bock, Bussmann, Cowan, Dammene, Enghardt, Helbig, Karsch, Kluge, Laschinsky, Lessmann, Metzkes, Naumburger, Sauerbrey, Schürer, Sobiella, Woithe, Schramm and Pawelke2010) as they have the added advantages of reduced size and cost over synchrotrons. Ion acceleration by irradiating ultra-thin foils with high intensity laser pulses has been receiving much attention lately. Using this technique, beams of protons with energies up to about 60 MeV have been observed (Hegelich et al., Reference Hegelich, Albright, Cobble, Flippo, Letzring, Paffett, Ruhl, Schreiber, Schulze and Fernandez2006; Ter-Avetisya et al., Reference Ter-Avetisya, Schnuber, Polster, Nickles and Sandner2008). Although not confirmed yet, it is predicted that the energy can be increased by a factor of 5–10 and even higher (Esirkepov et al., Reference Esirkepov, Borghesi, Bulanov, Mourou and Tajima2004; Qiao et al., Reference Qiao, Zepf, Borghesi and Geissler2009). However, this needs yet to be confirmed. This makes laser accelerated ions a potential candidate for cancer treatment. In the longer term, laser accelerated hadrons could offer compact treatment devices with significantly reduced treatment costs. At the moment the particle distributions produced by such accelerators are a long way from fulfilling medical requirements, but steady progress in the field might change the situation in the future. As some of the properties of laser generated ion beams are very fundamental in nature, a technically feasible and reliable solution suitable for a hospital might require far more than a decade to develop. For instance, the large energy spread of the ion beams observed is a consequence of the different velocities, the accelerating electromagnetic wave, and the accelerated particles travel. For heavier ions in particular, this will immediately lead to a phase slip of a large fraction of the ions with respect to the electromagnetic wave. This will lead to a loss of correlation, which in consequence produces the observed energy spread. Interestingly, one big advantage of laser based acceleration is the extremely short wavelength of the electromagnetic wave, which is of order 104 times shorter when compared with conventional particle accelerators. While this short wavelength (together with the high electric fields) dramatically reduces the required length for acceleration, it would also make it necessary to influence the acceleration process on the micrometer level. However, laser accelerated ion beams have unique features that require a special beam handling for capture and focusing. Therefore in the future, in addition to optimizing the acceleration process to produce higher beam energies suitable for medical applications, work has to be dedicated to solving the major problems of beam capture and delivery to the patient (Hofmann et al., Reference Hofmann, Meyer-ter-Vehn, Yan, Orzhekhovskaya and Yaramyshev2011; Reference Hofmann, Orzhekhovskaya and Yaramyshev2009; Burris-Mog et al., Reference Burris-Mog, Harres, Nurnberg, Busold, Bussmann, Deppert, Hoffmeister, Joost, Sobiella, Tauschwitz, Zielbauer, Bagnoud, Hermannsdoerfer, Roth and Cowan2011; Nurnberg et al., Reference Nurnberg, Alber, Harres, Schollmeier, Roth, Barth, Eickhoff, Hofmann, Friedman, Grote and Logan2009; Linz & Alonso, Reference Linz and Alonso2007; Ma et al., Reference Ma, Veltchev, Fourkal, Li, Luo, Fan, Lin and Pollack2006; Woods et al., Reference Woods, Boucher, O'Shea and Hegelich2013). Large energy spread and angular divergence of the beam, combined with a small transverse emittance, a short pulse duration and a large number of protons per bunch, all make the capture, focusing, and transport of laser driven protons a challenging problem. Worldwide, different groups study the production of such high energy beams together with their capture and beam transport. In Hofmann et al. (Reference Hofmann, Meyer-ter-Vehn, Yan, Orzhekhovskaya and Yaramyshev2011), the advantage of particle collection using a high field super conducting solenoid magnet was shown and compared with the case of using a simple aperture solution for beam formation. The employment of a pulse power solenoid to capture and transport the laser accelerated protons was discussed in Burris-Mog et al. (Reference Burris-Mog, Harres, Nurnberg, Busold, Bussmann, Deppert, Hoffmeister, Joost, Sobiella, Tauschwitz, Zielbauer, Bagnoud, Hermannsdoerfer, Roth and Cowan2011). While conventional optical systems like solenoids or quadrupoles will be operating at the technical limits, which would be contradictory to the cost and space argument mentioned before, space charge lenses of the Gabor type (Gabor, Reference Gabor1947) might be a cost effective alternative. In the current study, a basic theory of space charge Gabor lenses together with a description of the simulation tools is presented. Results of particle tracking for beams of protons are presented together with a conclusion.
2. GABOR LENS THEORY
The advantages of space charge lenses for the proposed application are obvious if we review the basic aspects of space charge lenses as published by Gabor (Reference Gabor1947). To produce a focusing force on positive ions an electron cloud is confined longitudinally by the potential of a central cylindrical anode surrounded by two grounded electrodes. Radial confinement is achieved by a solenoid which produces a homogenous magnetic field  ${\bi B} = {\bi B}_0 {\hat {\bi z}}$. To achieve the same focal length, Gabor lenses use reduced magnetic and electrostatic field strength compared to conventional lenses and can in theory produce linear transformation in phase space (Noble, Reference Noble1988; Reiser, Reference Reiser1989; Meusel et al., Reference Meusel, Pozimski, Jakob and Lakatos2001). To evaluate the focal strength, we require the solution of the equation of motion for the particles captured in the lens (electrons) under the effects of the electric and the magnetic field in the lens, given by the force balance equation
 $${\bi n_r m} \left(\displaystyle{{\partial {\rm \nu}} \over {\partial t}} + \lpar {\bi {\rm \nu}} \times {\bi \nabla} \rpar {\bi {\rm \nu}} \right)= {\bi n_r e}\lpar {\bi E} + {\bi {\rm \nu}} \times {\bi B}\rpar - {\bi \nabla p}\comma \;$$
and Gauss's law
 $${\bi \nabla} \times {\bi E} = \displaystyle{{n_r e} \over {{\rm \varepsilon} _0 }}.$$
Solving the set of equations for certain boundary conditions proves, that the maximum density of the space charge particles (electrons) with mass m e is defined by the radial enclosure condition and is given by the Brillouin flow
 $${\bi n_r} = \displaystyle{{{\rm \varepsilon} _0 } \over {2m_e }} {\bi B^2} .$$
For the longitudinal enclosure, a cylindrical anode is used. The anode of radius r A is charged to the potential V A. As long as the radial electric field is below a maximum value, the magnetic field prevents most of the electrons from reaching the anode. The corresponding maximum density can be expressed as a function of the anode voltage V A and radius r A as
 $${\bi n_l } = \displaystyle{{4{\rm \varepsilon} _0 V_A } \over {er_A^2 }}.$$
If Eqs. (3) and (4) are simultaneously fulfilled nl = nr the voltage required on the anode can be expressed by the magnetic field and anode radius (Reiser, Reference Reiser1989).
 $${\bi V_A} = \displaystyle{{er_A^2 } \over {8m_e }}{\bi B^2} .$$
The equation of motion for a single proton with charge q and mass mp that enters the lens with a longitudinal velocity ν can be written as
 $${\bi r}^{\prime \prime} + \displaystyle{{qn_r e} \over {2m_p {\rm \varepsilon} _0 {\rm \nu} ^2 }}{\bi r} ={ \bf 0}\comma \;$$
using the maximum electron density nr that can be achieved in radial direction. This can now be rewritten to
 $${\bi r}^{\prime \prime} + \displaystyle{e \over {8m}}\displaystyle{{B^2 } \over {U_B }} {\bi r} = {\bf 0}\comma \;$$
where 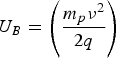 $U_B = \left(\displaystyle{{m_p {\rm \nu} ^2 } \over {2q}} \right)$ is the total accelerating potential of the ions. This is similar to the equation of motion in the focusing plane of a conventional quadrupole.
Thus, one can define a focusing constant  $k = \displaystyle{{V_A } \over {U_B r_A^2 }}$ and write the focal length of the lens as
 $$\displaystyle{1 \over f} = \sqrt {\bi k} {\bi \sin} \sqrt {{\bi kl}}\comma \;$$
where l is the effective lens length. In the thin lens approximation, the focal length of a Gabor lens can be expressed as
 $$\displaystyle{1 \over f} = \displaystyle{e \over {8m_e }}\displaystyle{{B^2 } \over {U_B }}{\bi l}$$
Eq. (9) shows that the focal length in a Gabor lens is proportional to the energy of the particles entering the lens. This is in contrast with the conventional solenoid or quadrupole lenses in which the focal length is proportional to the square root of the particle energy (Meusel et al., Reference Meusel, Pozimski, Jakob and Lakatos2001; Pozimski & Meusel, Reference Pozimski and Meusel2005). Comparing the focal strength between Solenoids and Gabor lenses for an ion beam of charge state Z in the simplest case one can express the scaling of the magnetic fields as follows.
 $${\bi B_{GPL}} = {\bi B_{sol} } * \sqrt {\displaystyle{{m_e } \over {m_{ion} }}{\bi Z}} .$$
To quantify the achievable reductions in magnetic field by the use of Gabor lenses, Table 1 summarizes the required field strength to achieve a focal length of 1 m for different lens systems. The effective length for each case is 30 cm. In case of the magnetic Quadrupole (QP), the basis of our calculations was a FODO lattice of length 30 cm with a yoke length of 10 cm and 5 cm spacing between yokes.
Comparison of the magnetic field strength (given in Tesla) required for different lens systems in case of protons and carbon ions at different energies

Already under these simplified assumptions, the solenoid solution is a technical challenge, with devices exceeding 10 T being proposed (Hofmann et al., Reference Hofmann, Meyer-ter-Vehn, Yan, Orzhekhovskaya and Yaramyshev2011) and an experimental setup in preparation. The solenoid setup investigated not only suffers from the technical challenges but also offers no energy selection as it would be required for beams with a large energy spread. On the other hand, Gabor space charge lenses would offer sufficiently intense beams suitable for treatment. QP solutions have been proposed (Hofmann et al., Reference Hofmann, Orzhekhovskaya and Yaramyshev2009) in conjunction with a dispersive lattice using dipoles for energy selection. Not only do those lattices require a dipole field of 8.6T and quadrupole gradients of 400 T/m, but the small acceptance of the lattice also strongly reduces the transported beam current. Therefore such solutions seem to be contradictory to the original aim of saving cost by simplifying the accelerator layout.
In the case of the requirements for external magnetic fields, the theory of the space charge lenses of Gabor type seems very favorable for a use in this kind of application. At a closer look, we notice that if we assume in Eq. (5) a magnetic field of 0.2 T, electrons as charge carrier and an anode radius of 44 mm, the resulting voltage on the anode is in the range of 9.3 MV, which without optimization is surely unsuitable for the proposed application in a hospital or similar.
Another question is why this type of lens system is relatively unknown in the accelerator world and has rarely been used in experimental setups, while the underlying fundamental publication is more than 65 years old. A simplified answer could be that while the theory presented is global, in the sense that it describes the general averaged densities of the space charge cloud under strongly simplified boundary conditions, the actual practical use of such a device is strongly relying on a local balance of space charge forces and a coupling between longitudinal and transversal plane. Without the tools available at the time of the experiments (Mobley, Reference Mobley1978; Booth & Levevre, Reference Booth and Levevre1978; Palkovic, Reference Palkovic1991; Palkovic et al., Reference Palkovic, Mills, Schmidt and Young1990; Soloshenko et al., Reference Soloshenko, Goretsky, Gorshkov and Zavalov2004; Dobrovolskiy et al., Reference Dobrovolskiy, Dunets, Evsyukov, Goncharov, Gushenets, Litovko and Oks2010) the successful operation of the lenses was down to chance. High gas pressure and local loss channels are some of the reasons and the high emittance growth reported in the experiments can now be seen to be caused by unbalanced magnetic and electric forces as numerical simulations show today.
3. NUMERICAL RESULTS OF GABOR LENS SIMULATIONS
At the end of the 20th century a numerical simulation tool which discretized the theory and introduced thermal coupling was developed (Pozimski, Reference Pozimski1997). The simulations software solves the set of equations presented in an iterative way on a two-dimensional mesh, assuming a thermal distribution of the enclosed particles for coupling of the transversal and longitudinal plane. The basic iterative step performing the coupling in the simulations is given in Eq. (11) with further details to be found in Pozimski and Meusel (Reference Pozimski and Meusel2005). A relation between the aforementioned local space charge densities calculated from the radial enclosure condition and the one for the longitudinal enclosure can be established. Using the Boltzmann distribution a thermalization of the space charge cloud along the magnetic field line is assumed.
 $$\eqalign{{\rm \rho} _1 \lpar {\rm \varphi} \lpar r_n \comma \; z_{m1} \rpar & = {\rm \rho} _r \lpar {\rm \varphi} _{\max } \lpar r_n \comma \; z_{m2} \rpar \rpar e^{ - \left(\displaystyle{{{\rm \varphi} _{\max } \lpar r_n \comma z_{m2} \rpar - {\rm \varphi} \lpar r_n \comma z_{m1} \rpar } \over {\rm kT}}\right)} }.$$
Solutions are arrived at if we assume a given transversal pattern of longitudinal particle losses leading to a radial variation of temperature. The predictions gained from the numerical simulations showed good agreement with experimental results (Pozimski & Meusel, Reference Pozimski and Meusel2005; Pozimski, Reference Pozimski1997; Meusel et al., Reference Meusel, Bechtold, Pozimski, Ratzinger, Schempp and Klein2005). Since the publications of Pozimski and Meusel (Reference Pozimski and Meusel2005) the software has undergone a major revision, including the development of new software interfaces to the General Particle tracer software (GPT by Pulsar) for particle tracking and new options for output and post processing of data.
A typical Gabor lens geometry, consisting of a solenoid and central anode surrounded by grounded electrodes, is shown in Figure 1. The solenoid produces a magnetic field, with the main component B z parallel to the beam axis. The electron cloud is confined transversely by the magnetic field and longitudinally by the potential well produced by the electrodes. The incoming positive ions are then focused by the space charge of the electron cloud.
(Color online) Schematic drawing of the Gabor lens geometry with L the total length of the lens and RA the radius of the Anode. The potential produced by the two grounded electrodes (black) and the anode (red) confine the electron cloud (blue) longitudinally, while the magnetic field of the solenoid (green) confines the cloud transversely.

As mentioned in the theory part, to avoid unreasonably large voltages on the anode, the proposed lattice will be divided into several specialized lenses, each one optimized with respect to the electrode voltage. For a given anode voltage, the acceptance of the lattice in the first order only depends on the radius of the output aperture, the distance from the particle source, and the length of the first lens. The second lens has a larger diameter to preserve the acceptance and produce a convergent beam, while the third lens has the smallest radius and provides strong focusing for a beam of small diameter and moderate divergence. The main parameters characterizing the different lenses proposed in this paper are summarized in Table 2.
Basic parameters for different space charge lenses described in this paper

The results presented are of simulations, run with a grid size of 1 mm in simulation mode 4 that assumes a quasi-thermal distribution of the electrons in a longitudinal direction and requires approximately 500 iterations to achieve equilibrium. A typical result of the numerical simulations performed for lens1 is shown in Figure 2. The density distribution in first order is homogeneous in radius with a variation between the beam axis and the cathode radius below ±1.5% in the middle of the lens (z = 200 mm). The resulting electric focusing field is highly linear. The predicted average density of the cloud of about 5.1 × 10⁻² C/m3 is about 70% of the theoretical limit given by Eq. (3); in case of the maximum density of 6.07 × 10⁻² C/m3, this value increases to 83% of the theoretical limit. Comparing plots C and D, the radial potential depression produced by the space charge cloud is clearly visible. In the given example, the potential in the center of the lens drops from virtually 630 kV to 155 kV, which is in the range of 75% of what is given by the relations of Eq. (4). This balance of radial and longitudinal enclosure has been proven in Pozimski and Meusel (Reference Pozimski and Meusel2005) to be a favorable operation mode. While mode 4 of the simulations does not evaluate the temperature of the electron ensemble but only enforces ρ1 < ρ0 for Φ1 < Φ0, a “local” temperature that can be estimated from the data, it indicates a majority of the values to be in the range of 30 keV (±5 kVRMS on axis). This is consistent with previous full thermal simulations where the residual potential required for longitudinal enclosure is about five times the temperature of the ensemble.
(Color online) Results for Gabor lens geometry 1 with the magnetic field distribution (A), the charge density inside the lens (B), the potential distribution when the lens is empty (C) and the potential at equilibrium (D). White areas correspond to the first value given in the plot, black to the second.
4. BEAM OPTICS
A lattice consisting of three Gabor lenses with the aim to collect and focus the laser accelerated proton beam to fulfill the cancer therapy requirements, is presented. It was discussed thoroughly in Hegelich et al. (Reference Hegelich, Albright, Cobble, Flippo, Letzring, Paffett, Ruhl, Schreiber, Schulze and Fernandez2006) that the spectral distribution of laser acceleration sets restrictions on the use of the large amount of laser generated protons. It was also shown that a magnetic field collection system, like solenoid and quadrupole lenses, have advantages over a pure aperture collimation scheme which is suggested in Hofmann et al. (Reference Hofmann, Meyer-ter-Vehn, Yan, Orzhekhovskaya and Yaramyshev2011). On the other hand, a solenoid focusing system is believed advantageous over quadrupoles due to larger acceptance angles and higher transport yields (Hofmann et al., Reference Hofmann, Meyer-ter-Vehn, Yan, Orzhekhovskaya and Yaramyshev2011). However, the very large magnetic fields in the range of 10–15 T, noted in Hofmann et al. (Reference Hofmann, Meyer-ter-Vehn, Yan, Orzhekhovskaya and Yaramyshev2011) for the efficient collection of the beam particles encourages the use of other schemes for technical reasons.
The beam transport presented can be broken down into three purposes. The first lens is capturing the beam reducing the divergence angle to collect a large fraction of the accelerated particles. The second lens focuses the beam at moderate angles into a small aperture for energy separation, and the third lens prepares the beam in such a way that it is suitable for treatment (e.g., parallel with small beam radius of about 3 mm). A schematic picture of the lattice is illustrated in Figure 3.
(Color online) Schematic layout of the suggested GPL lattice. Please refer to text for further details.
While in principle two lenses would be sufficient, splitting the first lens into two allows for separate optimization. All three lenses would operate at identical voltages, but have a different anode radius (about the radius of the plasma column) and require different magnetic fields. For the beam transport simulations using the GPT particle tracking software (Pulsar), the proton beam parameters presented in Hofmann et al. (Reference Hofmann, Meyer-ter-Vehn, Yan, Orzhekhovskaya and Yaramyshev2011) have been assumed. For the initial simulations, a monoenergetic beam of protons with energy of 200 MeV is considered. The beam is assumed to have Gaussian real space and angular distribution truncated at 2σ. The initial pulse duration is set to 140 ps. An energy spread introduced by variation of the Lorentz factor γ by 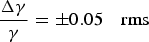 $\displaystyle{{{\bi \Delta {\rm \gamma} }} \over {\bi {\rm \gamma}} } = \pm 0.05 \quad {\rm rms}$ is assumed for all further investigations. For a laser spot radius of a0 = 10 µm, and a uniformly filled angular cone of spatial angle Ωmax = 50 mrad, the unnormalized transverse emittance at the source is ε = a0Ωmax = 0.5 mm. The numerical tool to simulate the electron density in the lenses described in Section 3 allows exporting two-dimensional field maps which can be imported into GPT. Field maps for the three lenses are placed at the longitudinal positions z = 0.05 meters, z = 0.50 meters, and z = 2.86 meters.
4.1. Particle Transport Simulations
The first results of the particle transport simulations presented, show the case of zero energy spread calculated for 100000 macro particles. The initial energy of the particles at the source was 200 MeV. This energy is at the upper end of the energy range (about 70–250 MeV) used for treatment and used in various publications (Hofmann et al., Reference Hofmann, Meyer-ter-Vehn, Yan, Orzhekhovskaya and Yaramyshev2011; Reference Hofmann, Orzhekhovskaya and Yaramyshev2009; Burris-Mog et al., Reference Burris-Mog, Harres, Nurnberg, Busold, Bussmann, Deppert, Hoffmeister, Joost, Sobiella, Tauschwitz, Zielbauer, Bagnoud, Hermannsdoerfer, Roth and Cowan2011; Nurnberg et al., Reference Nurnberg, Alber, Harres, Schollmeier, Roth, Barth, Eickhoff, Hofmann, Friedman, Grote and Logan2009; Ma et al., Reference Ma, Veltchev, Fourkal, Li, Luo, Fan, Lin and Pollack2006) allowing for benchmarking the various lattices proposed. The initial particle distribution considered for the simulation is shown in Figure 4 for the longitudinal direction and Figure 5 for the transversal plane.
(Color online) Initial distributions of the proton beam of 200 MeV energy in the longitudinal direction assuming zero energy spread at the source. Particles marked red are not within the acceptance of the proposed lattice. The left hand plot shows the transversal profile in x as a function of time, the central plot the velocity in z as a function of the relativistic factor gamma and the plot on the right-hand side the angular distribution as a function of longitudinal velocity.
(Color online) Initial distributions of the protons from the source in transversal real space (x, y), the x, x′ phase space and the transversal angular space (x′, y′) (top panel), and final distributions of protons after the third Gabor space charge lens (bottom panel). Particles marked red are not within the acceptance of the proposed lattice.
In Figure 4, the graph on the right-hand side illustrates that the acceptance of the lattice is defined by the initial angle (about 38 mrad) of the particle trajectory with respect to the beam axis. As expected the acceptance has rotational symmetry, visible on the left and right top plots in Figure 5. The phase space distributions shown in Figure 5 lower graphs for the output plane of the lattice show a well-defined beam suitable for the proposed application. The beam at exit has a radius below 2.5 mm (rms ~1.5 mm) and a maximum divergence of less than 5 mrad (rms < 3 mrad). The transversal phase space in the x, x′ plane show some spherical aberrations, which might be reduced following further optimizations.
In Figure 6, a trajectory plot is shown together with a plot of the development of transmission and emittances. We notice that for the assumed distribution roughly 20% of the particles started from the ion source have been lost before leaving the first lens. These particles are out of the acceptance of the lattice as mentioned before. The other position of beam loss (additional 5%) is as expected at the aperture (z = 2.75 m). These losses can be explained by spherical aberrations of the Gabor lens system. In the longitudinal phase space, the beam starts with zero emittance as (zero energy spread was assumed) but due to the acceleration and deceleration in the high longitudinal electric field component at the entrance and exit of the lens an (reversible) increase of the longitudinal emittance can be noticed. The final longitudinal emittance is again close to zero. In the transversal direction the situation is slightly different. At the entrance of the lenses the rms emittance reduces and is increased by the same amount at the exit due to the electric potential. In addition to this reversible effect, spherical aberrations (emittance increase shown in Fig. 6 right-hand graph inside lens 2) cause a non-reversible emittance growth. Due to zero energy spread no chromatic aberrations are visible. As is the collimation in lens 1 and at the aperture limit the emittance growth, the final output emittance of 0.5 π mrad is still well suited for medical applications (typical values above 1 π mrad).
(Color online) Trajectory plot (left) of particle transport using 100,000 macro particles assuming zero energy spread. In the right hand graph the corresponding transmission (black) and emittances (red = transversal, blue = longitudinal) are plotted as a function of z.
4.2. Non Zero Energy Spread
The situation is slightly different if we account for the particles energy spread. Again, we assume 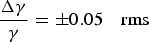 $\displaystyle{{{\bi \Delta {\rm \gamma}} } \over {\bi {\rm \gamma}} } = \pm 0.05 \quad {\rm rms}$. The initial longitudinal and transverse phase space distribution of the beam particles are shown in Figures 7 and 8 (top plots). Their corresponding distributions after the third lens are shown in Figure 8 (bottom plots).
(Color online) Initial distributions of the proton beam of 200 MeV energy in the longitudinal direction assuming 5% energy spread from the source. Particles marked red are not within the acceptance of the proposed lattice.
(Color online) Transversal phase space at the entrance and exit of the lattice for a beam energy of 200 MeV and 5% initial energy spread.
While the precise analysis of the beam transmission and acceptance of the lattice is not as simple as in the monoenergetic case, the acceptance angle of ~about 38 mrad is still visible in plots 7 and 8 (red particles are lost). The phase space distributions shown in Figure 8 lower graphs for the output plane of the lattice show a well-defined beam suitable for the proposed application. The beam at exit has a slightly increased beam radius, which is still below 3 mm (rms radius ~1.5 mm) and a maximum divergence of less than 5 mrad (rms < 3 mrad). The transversal phase space occupied in the x, x′ plane is also slightly increased compared to the case without energy spread. The spherical aberrations observed in the monoenergetic (see Fig. 5) case are less visual due to the smearing caused by the energy spread.
In Figure 9, a trajectory plot is shown together with a plot of the development of transmission and emittances. As in the previous case roughly 20% of the particles started from the ion source have been lost before leaving the first lens. These particles are out of the acceptance of the lattice as mentioned before. Due to the energy spread the particle loss at the aperture (z = 2.75 m) is significantly larger than in the previous case (about 47%). These additional losses of 42% are caused by the different focal length for varying energy. As the beam starts with a relatively large emittance of 2 × 10⁻⁵eV × s in the longitudinal phase space, the influence of the longitudinal electric field component at the entrance and exit of the lens are hardly noticeable. This value increases slightly until the beam reaches the aperture. As only particles of reference energy (200 MeV) are in focus at the position of the aperture, wrong energy particles are removed from the beam, and the longitudinal emittance is reduced. The final longitudinal emittance is half the initial value (about 1.1 × 10⁻⁵ eV × s). In the transversal dimension, the situation is similar to the situation with zero energy spread. At the entrance of the lenses the rms emittance reduces and is increased by the same amount at the exit due to the electric potential.
(Color online) Trajectory plot (left) of particle transport using 100,000 macro particles assuming 5% energy spread. On the right-hand side the corresponding transmission and emittances are plotted. Please note that the scale for the emittances compared with Figure 6 has been increased by a factor of 10.
Additionally to this reversible effect, spherical aberrations cause a non-reversible emittance growth together with chromatic aberrations due to the energy spread. The overall emittance growth before collimation is significantly (four times) larger than in the previously case. On the other hand, the collimation at the aperture limits the emittance growth at the end of the beam line. The output emittance of 0.6 π mm-mrad is only 20% larger than without energy spread and is still well suited for medical applications.
In Figure 10, the energy distribution of the particles together with the transmission as function of energy is shown. The histogram of the energy distribution for the three positions observed shows a maximum at the nominal energy of 200 MeV. At the ion source (black histogram) the energy spread (full width at half maximum) is 24.4 MeV. In front of the aperture at 2.75 m (green curve), the mean energy is still 200 MeV but the energy spread is slightly reduced (about 4%) to 23.4 MeV due to the collimation in the first lens. After the aperture at 2.75 m (red histogram) the mean energy does not change, but the energy spread is drastically (about 60%) reduced to 9.4 MeV. The particle loss at reference energy (200 MeV) is relatively small (<10%) while it is significant for all other energies. The transmission through the aperture at position 2.75 as a function of the energy is plotted in Figure 10 on the right-hand side. The plot proves the good energy selection properties of the proposed setup in conjunction with an excellent transmission of the particles with the selected energy as discussed in Pozimski and Aslaninejad (Reference Pozimski and Aslaninejad2012). In principle, the position of the aperture can be used to select and filter the particles with low, medium or high energies as would be required for cancer treatment. As this would also require changing the position and strength of lens 3, a different approach to select the energy for treatment is described as follows.
(Color online) Left plot: The development of the energy spread assuming 100, 000 particles at start (black), in front of (green) and after (red) collimation. Right plot shows the beam transmission as a function of particle energy for this case.
4.3. Energy Selection of Particle Beam
To allow for an energy variation of the output beam from 70–250 MeV as required for Hadron therapy, the procedure to move the aperture and lens 3 longitudinally, as described previously, does not seem practical. Instead of changing the position of the aperture, the settings of all three lenses can be varied to allow for output beams, which share all transversal properties for different energies. This is a major advantage compared to the lattices recently described in Hofmann et al. (Reference Hofmann, Meyer-Ter-Vehn, Yan and Al-Omari2012; Reference Hofmann2013). The parameters required for all three lenses to achieve certain mean output energies are summarized in Table 3. Due to the specific design of the lenses, the voltages are the same for all lenses, which allows for one high voltage power supply. As the system is fundamentally electrostatic in behavior, the required change in voltage is linear with the change in energy (about factor 3.6) of the particles. As predicted by results from Eq. (3), the magnetic field scales with the square root of the particle energy. Since the magnetic fields required by the lenses are relatively low, the simulations have been based on a model using air coils without iron to reduce the inductivity of the magnet. This would allow for a fast scan of the energy over the full range within seconds.
Variation of lens parameters for an energy variation between 70–250 MeV

For the cases presented in Table 3 the beam transport has been calculated. In Figure 11, the beam transmission through the aperture is plotted for the six different lens settings. The plot demonstrates the energy selection properties of the proposed setup in conjunction with an excellent transmission (about 80% total, >95% through aperture at 2.75 m) of particles with the selected energy. While the transmission at mean energy is practically constant, the width of the distribution scales (nearly) proportionally with energy, allowing for an energy spread of about 2.5% (note that the values given in Table 3 are gained from a more rigorous data analysis than shown in Fig. 11). This is typical for electrostatic systems. On the other hand, the energy spread observed for the 70 MeV case is small enough to fulfill the treatment requirements while in the other cases a further treatment of the ion beam might be necessary.
(Color online) Histogram of spectral transmission (black for the whole lattice from z = 0 to z = 4 m; pink from z = 2.4 m to z = 4 m (aperture collimation only)) with the lens settings shown in Table 3. The energy bin width is 0.5 MeV; the numbers represent the full width at half maximum values in MeV based on bins.
The momentum spread for the presented lattice can be derived from the corresponding energy spread given in Table 3 and lies in the range between ±1.23% and ±1.49% (for 70 MeV to 250 MeV). In conventional accelerators for cancer therapy (synchrotrons and cyclotrons), the typical momentum spread for the extracted beam is in the range of 0.1–0.2%. Of course, cyclotrons need to use a degrader to vary the energy for the treatment, which is detrimental for the momentum spread. At low energies, contributions from the combined effects of energy spread and longitudinal straggling are still small enough that the system presented may be considered feasible for use in treatment. At high energies however, the energy spread is quite noticeable, and an advanced lattice is envisaged to overcome this problem.
5. SUMMARY AND OUTLOOK
The results of the presented theoretical and numerical investigations of beam transport of laser accelerated beam ions for medical applications in cancer therapy using Gabor space charge lenses show very encouraging results. A lattice consisting of three lenses can capture and focus a particle beam that is compatible with the therapy requirements, at least in the transversal phase space. The energy spread of the beam has also been reduced by a factor of up to 3, which is a significant improvement compared with other proposed lattices. These results are very encouraging, representing a significant improvement for the issue of the energy distribution for laser generated ion beams, while still preserving particle numbers.
A further improvement, by a factor of about 3–5 in terms of energy spread, is required before medical applications can be seriously considered. Work has already begun to extend the presented lattice by the use of bunching cavities following the three Gabor lens. The cavity will be followed by a dipole magnet and one further Gabor lens. Together with a proposed improvement of the geometry of the collimation aperture, a further significant reduction of the energy spread is predicted. This might not be sufficient for treatment at all energies, however. In the future, further theoretical, numerical, and experimental investigations are planned to answer some of the questions raised in this publication, improve the lattice and gain experimental data to verify the simulation results. Nevertheless, the enormous reduction in lattice complexity together with the excellent performance, superior to any conventional lattice proposed so far, makes the proposed setup a very strong candidate for further consideration. The very compact size of the lattice allows for mounting the whole beam acceleration and delivery system directly on the gantry. This could significantly reduce the complexity of the treatment system with reduced treatment cost as a consequent. Although our main focus has been on proton beams, it should be mentioned that Gabor lenses are even more advantageous in using heavier ions like carbon, in comparison to lattices with conventional lenses. In fact for a 450 MeV/u carbon 6+ beam, the additional advantage expected from equation 10 is a factor of  $\sqrt {\bf 2}$. In the case of a solenoid capture, this implies an even stronger magnetic field in the range of 15 T compared with protons. On the other hand, the required magnetic field for the Gabor scenario still remains less than 1 T. New laser-driven ion acceleration mechanisms, which allow ion acceleration to GeV energies, are being identified (Yin et al., Reference Yin, Albright, Hegelich and Fernandez2006). This would further increase the challenges to capture and focus the ion beam and plasma lenses could play a fundamental role to realize this.
ACKNOWLEDGMENTS
The authors wish to thank Piero Posocco, Zulfikar Najmudin, and Ingo Hofmann for various useful discussions.



