1. Introduction
Remarkable progress in the understanding of flows strongly influenced by stable density stratification and weakly influenced by rotation has been achieved during the first years of this century. These conditions concern in particular the mesoscales in the atmosphere and the submesoscales in the oceans. At these scales, the spectra obtained in these two media present noticeable similarities and regularities (Garrett & Munk Reference Garrett and Munk1979; Gargett et al.
Reference Gargett, Hendricks, Sanford, Osborn and Williams1981; Nastrom, Gage & Jasperson Reference Nastrom, Gage and Jasperson1984; Nastrom & Gage Reference Nastrom and Gage1985; Riley & Lindborg Reference Riley and Lindborg2008). They are strongly anisotropic with different power laws along the vertical and the horizontal. The vertical spectrum of kinetic energy presents a
 $N^{2}k_{z}^{-3}$
form, where
 $N$
is the Brunt–Väisälä frequency and
 $k_{z}$
the vertical wavenumber, whereas the horizontal spectrum of kinetic energy scales like
 ${{\it\varepsilon}_{\!K}}^{2/3}{k_{h}}^{-5/3}$
, where
 ${\it\varepsilon}_{\!K}$
is the mean kinetic energy dissipation rate and
 $k_{h}$
the horizontal wavenumber. Some high-resolution general circulation models (GCMs) and regional models resolve the mesoscales range and also reproduce such a
 $k_{h}^{-5/3}$
scaling law although their vertical resolution is actually too low to simulate properly stratified turbulence (Koshyk & Hamilton Reference Koshyk and Hamilton2001; Skamarock Reference Skamarock2004; Hamilton, Takahashi & Ohfuchi Reference Hamilton, Takahashi and Ohfuchi2008; Augier & Lindborg Reference Augier and Lindborg2013). The anisotropy of the spectra is due to the strong influence of the stratification, which is expressed by a small horizontal Froude number
 $F_{h}=U/(NL_{h})$
, where
 $U$
is a typical velocity and
 $L_{h}$
a characteristic horizontal length scale. A
 ${{\it\varepsilon}_{\!K}}^{2/3}k_{h}^{-5/3}$
power law strongly suggests a cascade of energy but does not indicate in which direction the energy cascades. In the previous century, a downscale cascade from large scales toward small scales was predicted by theories involving saturated gravity waves (Dewan & Good Reference Dewan and Good1986; Smith, Fritts & Vanzandt Reference Smith, Fritts and Vanzandt1987; Hines Reference Hines1991; Dewan Reference Dewan1997). An inverse cascade was predicted by a theory of stratified turbulence involving quasi-horizontal meandering motions of decoupled horizontal layers (Riley, Metcalfe & Weissman Reference Riley, Metcalfe and Weissman1981; Lilly Reference Lilly1983). However, Cho & Lindborg (Reference Cho and Lindborg2001) showed by analysing airborne measurements that the third-order structure function for the velocity fluctuations exhibits a negative linear dependence. This is an observational evidence supporting the downscale energy cascade predicted by the gravity wave turbulence hypothesis. But Lindborg (Reference Lindborg2007) computing spectra of vertical vorticity and horizontal divergence from the same airborne data set showed that they are of the same order in the mesoscale range. This observation invalidates the gravity wave turbulence hypothesis that predicts a dominance of the horizontal divergence so that the two hypotheses mentioned above cannot explain the anisotropic geophysical spectra.
However, in the mean time, a new theory of strongly stratified turbulence has emerged (Lindborg Reference Lindborg2006; Brethouwer et al.
Reference Brethouwer, Billant, Lindborg and Chomaz2007). This theory is quite different from the previous theories involving gravity waves or quasi-horizontal vortices. Since stratified flows exhibit thin horizontal layers (Riley & Lelong Reference Riley and Lelong2000), it is fundamental to consider a second Froude number based on a vertical characteristic length scale
 $L_{v}$
. The vertical Froude number
 $F_{v}=U/(NL_{v})$
quantifies the interactions between the different horizontal layers and therefore the importance of three-dimensional processes. Many theoretical studies have been performed in the limits
 $F_{h}\ll 1$
,
 $F_{v}\ll 1$
(Riley et al.
Reference Riley, Metcalfe and Weissman1981; Lilly Reference Lilly1983) whereas the scaling law
 $F_{v}\sim 1$
emerges through an invariance of the Boussinesq inviscid Euler equations under the condition
 $F_{h}\ll 1$
(Billant & Chomaz Reference Billant and Chomaz2001). In the limit
 $F_{h}\ll 1$
,
 $F_{v}\sim 1$
, propagative gravity waves and non-propagative horizontal vortices of potential vorticity (PV) strongly interact together and cannot be considered separately.
Actually, the reason why the limit
 $F_{v}\ll 1$
was thought to apply to strongly stratified flows may come from a quantitative difference between the viscous effects in geophysical flows and in the flows produced experimentally or simulated numerically. The characteristic sizes of the geophysical flows are indeed so large that the Reynolds number
 $\mathit{Re}=UL_{h}/{\it\nu}$
, with
 ${\it\nu}$
the viscosity, is considerable and diffusive effects at these scales are negligible even though the structures are very thin with high vertical gradients. In contrast, in the laboratory, even the large scales of strongly stratified flows are usually influenced by dissipation because of the limited tank size. Vertical advective transport and vertical viscous diffusion act with two different characteristic length scales: the buoyancy length scale
 $L_{b}=U/N$
and the viscous length scale
 $L_{{\it\nu}}=\sqrt{{\it\nu}L_{h}/U}$
, respectively. The ratio between these two length scales is related to the buoyancy Reynolds number
 $\mathscr{R}=(L_{b}/L_{{\it\nu}})^{2}=\mathit{Re}F_{h}^{2}$
(Billant & Chomaz Reference Billant and Chomaz2001). Assuming the Taylor’s estimate
 ${\it\varepsilon}_{\!K}\sim U^{3}/L_{h}$
, Brethouwer et al. (Reference Brethouwer, Billant, Lindborg and Chomaz2007) have shown that
 $\mathscr{R}$
is proportional to the ‘turbulent’ buoyancy Reynolds number defined in terms of the dissipation rate:
 $\mathscr{R}_{t}={\it\varepsilon}_{\!K}/({\it\nu}N^{2})\gg 1$
. In geophysical flows, the buoyancy Reynolds number is typically high even though
 $F_{h}$
is small whereas it is difficult to establish a high buoyancy Reynolds number in laboratory experiments of strongly stratified flows (Godoy-Diana, Chomaz & Billant Reference Godoy-Diana, Chomaz and Billant2004; Praud, Fincham & Sommeria Reference Praud, Fincham and Sommeria2005; Augier et al.
Reference Augier, Billant, Negretti and Chomaz2014). In the regime of small buoyancy Reynolds number, the flow is quasi-two-dimensional with
 $F_{v}\ll 1$
and coupled along the vertical only by viscous effects (Godoy-Diana et al.
Reference Godoy-Diana, Chomaz and Billant2004) as originally proposed in the theory of Riley et al. (Reference Riley, Metcalfe and Weissman1981) and Lilly (Reference Lilly1983). In contrast, recent numerical simulations of turbulence in stratified fluids have succeeded in achieving sufficiently high buoyancy Reynolds number to escape from this viscous-dominated regime characteristic of most experiments. They exhibit downscale energy transfers, from large to small horizontal scales, as in isotropic homogeneous turbulence both in hyperviscous numerical simulations (Lindborg Reference Lindborg2006; Waite Reference Waite2011) and direct numerical simulations (DNS) (Riley & de Bruyn Kops Reference Riley and de Bruyn Kops2003; Brethouwer et al.
Reference Brethouwer, Billant, Lindborg and Chomaz2007; Almalkie & de Bruyn Kops Reference Almalkie and de Bruyn Kops2012; Kimura & Herring Reference Kimura and Herring2012; Bartello & Tobias Reference Bartello and Tobias2013).
Lindborg (Reference Lindborg2002, Reference Lindborg2006) investigated the consequences for strongly stratified turbulence of the inviscid scaling analysis of Billant & Chomaz (Reference Billant and Chomaz2001), using numerical simulations with highly anisotropic mesh and forced with vortical motions. His results support the existence of a turbulent regime in strongly stratified flows (
 $F_{h}\ll 1$
) with a downscale energy cascade associated with horizontal spectrum of kinetic energy scaling like
 ${{\it\varepsilon}_{\!K}}^{2/3}k_{h}^{-5/3}$
. Riley & Lindborg (Reference Riley and Lindborg2008) have argued that many geophysical data could be interpreted by this strongly stratified turbulent regime. Brethouwer et al. (Reference Brethouwer, Billant, Lindborg and Chomaz2007) showed with DNS that the condition on the buoyancy Reynolds number
 $\mathscr{R}=\mathit{Re}{F_{h}}^{2}\gg 1$
or equivalently
 $\mathscr{R}_{t}={\it\varepsilon}_{\!K}/({\it\nu}N^{2})\gg 1$
is necessary to reach the strongly stratified turbulent regime (in addition to
 $F_{h}\ll 1$
), the threshold value being of the order of
 $\mathscr{R}_{t}\sim 10$
.
In this case, strong vertical shears appear. As a direct consequence, the development of Kelvin–Helmholtz instability has been observed leading to transfers toward small scales (Laval, McWilliams & Dubrulle Reference Laval, McWilliams and Dubrulle2003; Riley & de Bruyn Kops Reference Riley and de Bruyn Kops2003; Hebert & de Bruyn Kops Reference Hebert and de Bruyn Kops2006b
; Deloncle, Billant & Chomaz Reference Deloncle, Billant and Chomaz2008). The gravitational instability can also develop in convectively unstable regions as shown for example in the case of a columnar dipole bent by the zigzag instability (Waite & Smolarkiewicz Reference Waite and Smolarkiewicz2008; Augier & Billant Reference Augier and Billant2011). When the buoyancy Reynolds number is high enough, there should also be a transition to isotropic spectra at the Ozmidov length scale
 $l_{o}=({\it\varepsilon}_{\!K}/N^{3})^{1/2}\sim L_{h}{F_{h}}^{3/2}$
(Lumley Reference Lumley1964; Ozmidov Reference Ozmidov1965) but no clear evidence for such return to isotropy has been reported by Brethouwer et al. (Reference Brethouwer, Billant, Lindborg and Chomaz2007). Carnevale, Briscolini & Orlandi (Reference Carnevale, Briscolini and Orlandi2001) reported such transition in large eddy simulations (LES) of stratified flows forced with large-scale gravity waves but their eddy damping was designed to favour the formation of a
 $k^{-5/3}$
range. Recently, Augier, Chomaz & Billant (Reference Augier, Chomaz and Billant2012) showed that such a transition at the Ozmidov length scale occurs in the case of the breakdown into turbulence of a dipole. However, Waite (Reference Waite2011) and Augier et al. (Reference Augier, Chomaz and Billant2012) pointed out that the characteristic size of the overturnings is of the order of the buoyancy length scale, which is larger than the Ozmidov length scale since
 $L_{b}/l_{o}\sim {F_{h}}^{-1/2}$
. This indicates that the scales between the buoyancy length scale and the Ozmidov length scale are actually no longer in the strongly stratified turbulent range.
Waite & Bartello (Reference Waite and Bartello2006) and Lindborg & Brethouwer (Reference Lindborg and Brethouwer2007) carried out numerical simulations forced with internal gravity waves. Waite & Bartello (Reference Waite and Bartello2006) forced the flow with isotropic waves and showed that the results differ from the simulations forced with vortical motions performed in Waite & Bartello (Reference Waite and Bartello2004). In particular, the scaling law
 $F_{v}\sim 1$
did not emerge from the flows forced by gravity waves. However, Lindborg & Brethouwer (Reference Lindborg and Brethouwer2007) showed that the strongly stratified turbulence is similar when forced with waves or with vortical motions provided that the vertical Froude number of the forced waves is of order unity.
In contrast to numerical studies, it has not yet been possible to produce strongly stratified turbulence in a laboratory experiment. In the experiments of Fincham, Maxworthy & Spedding (Reference Fincham, Maxworthy and Spedding1996) and Praud et al. (Reference Praud, Fincham and Sommeria2005) in which decaying turbulence was produced by towing a rake of vertical cylinders, the buoyancy Reynolds number was typically too low at the time when data were collected. Augier et al. (Reference Augier, Billant, Negretti and Chomaz2014) investigated a new experimental set-up of maintained stratified disordered flows. Columnar vortices are continuously forced by an arena of 12 vortex pair generators in a large tank enabling
 $\mathscr{R}_{t}$
of order unity to be achieved during long periods of time. The buoyancy frequency is set to its highest value using salt as stratifying agent so that the horizontal Froude number
 $F_{h}$
is low. While the flows are in the strongly stratified regime, the vertical Froude number reaches values of order one and overturning events are observed leading to the appearance of small horizontal scales for the highest buoyancy Reynolds number achieved
 $\mathscr{R}_{t}\simeq 0.4$
. However, since
 $\mathscr{R}_{t}$
is moderate, the turbulence is still incipient. An inertial range does not appear in the second-order structure functions but small-scale transfers increase when
 $\mathscr{R}_{t}$
is increased. These experimental results need to be supported and extended to larger buoyancy Reynolds numbers in order to bridge the gap between experiments and theory.
In this paper, we carry out numerical simulations for large buoyancy Reynolds numbers of strongly stratified flows forced with columnar dipole as in the experiments of Augier et al. (Reference Augier, Billant, Negretti and Chomaz2014). The forcing and the numerical methods are described in § 2. We first investigate a flow generated with a forcing mimicking the experimental one in which dipoles are periodically produced by an impulsive force localized in real space at the periphery of the computational domain (§ 3). In order to obtain larger values of the buoyancy Reynolds number and to come closer to previous numerical studies of forced strongly stratified turbulence, we consider in § 4 a slightly different forcing in which columnar dipoles are produced in the same way but at random location in the computational domain.
2. Methods
2.1. Governing equations and numerical methods
The governing equations are the incompressible Navier–Stokes equations under the Boussinesq approximation with standard and hyperviscous and hyperdiffusive terms
 $$\begin{eqnarray}\displaystyle & \displaystyle \partial _{t}\boldsymbol{u}+\boldsymbol{u}\boldsymbol{\cdot }\boldsymbol{{\rm\nabla}}\boldsymbol{u}=-\frac{1}{{\it\rho}_{0}}\boldsymbol{{\rm\nabla}}p-b\boldsymbol{e}_{\boldsymbol{z}}+\left({\it\nu}{\rm\nabla}^{2}+{\it\nu}_{4}{\rm\nabla}^{8}\right)\boldsymbol{u}+\boldsymbol{f}, & \displaystyle\end{eqnarray}$$
 $$\begin{eqnarray}\displaystyle & \partial _{t}b+\boldsymbol{u}\boldsymbol{\cdot }\boldsymbol{{\rm\nabla}}b=N^{2}u_{z}+\left({\it\kappa}{\rm\nabla}^{2}+{\it\nu}_{4}{\rm\nabla}^{8}\right)\!b, & \displaystyle\end{eqnarray}$$
 $\boldsymbol{u}=(u_{x},u_{y},u_{z})$
is the non-divergent velocity (
 $\boldsymbol{{\rm\nabla}}\boldsymbol{\cdot }\boldsymbol{u}=0$
) in Cartesian coordinates
 $(x,y,z)$
with
 $z$
the vertical coordinate,
 $p$
the pressure,
 $\boldsymbol{e}_{\boldsymbol{z}}$
the vertical unit vector,
 $b=g{\it\rho}^{\prime }/{\it\rho}_{0}$
the buoyancy,
 $g$
the gravity,
 ${\it\rho}^{\prime }(x,y,z,t)$
is the perturbation density relative to the sum of a constant reference density
 ${\it\rho}_{0}$
and a linear density profile
 $\bar{{\it\rho}}(z)$
,
 $N=\sqrt{-(g/{\it\rho}_{0})(\text{d}\bar{{\it\rho}}/\text{d}z)}$
is the constant Brunt–Väisälä frequency,
 ${\it\nu}$
the kinematic viscosity,
 ${\it\kappa}$
the mass diffusivity and
 ${\it\nu}_{4}$
is a constant hyperviscosity coefficient added for subgrid-scale modelling of the dissipative range. Such hyperdissipation will not be used in the first part of the paper, i.e. all of the simulations described in the present section and in § 3 are DNS. A hyperdissipation will be used only for the simulations presented in § 4 and will be always smaller than the standard dissipation. The term
 $\boldsymbol{f}$
represents the forcing which is described in the next subsection.
Equations (2.1) and (2.2) are simulated by means of a pseudo-spectral method with periodic boundary conditions (see Deloncle et al.
Reference Deloncle, Billant and Chomaz2008, for details). Apart from the forcing, the numerical methods are similar to those employed in Augier et al. (Reference Augier, Chomaz and Billant2012). Time advancement involves the classical fourth-order Runge–Kutta scheme for the nonlinear term and exact integration for the standard and hyperviscous and hyperdiffusive terms. Most of the aliasing is removed by truncating
 $9/10$
of the modes along each direction. We use an adaptable time step procedure which maximizes the time step over a Courant–Friedrichs–Lewy condition (Lundbladh et al.
Reference Lundbladh, Berlin, Skote, Hildings, Choi, Kim and Henningson1999; Augier et al.
Reference Augier, Chomaz and Billant2012).
2.2. Forcing method and definitions of the physical parameters
In order to reproduce the experimental vortex generators, vertical columnar counter-rotating vortex pairs are periodically produced in spatial space. Eight numerical dipole generators are placed on the side of the numerical box as shown by the grey rectangles in figure 1. Each of them produces periodically a dipole that propagates toward the central part of the box. The numerical domain is a rectangular box with sizes
 $\mathscr{L}_{h}=30a$
in the two horizontal directions and size
 $\mathscr{L}_{z}=10{-}12a$
in the vertical direction, where
 $a$
is the radius of the vortices forced.
Horizontal cross-sections of the vertical vorticity field for six instants at the beginning of a simulation for
 $\mathit{Re}=600$
and
 $F_{h}=0.85$
. Two dipoles are forced every 7 time units during 0.5 time unit. (a–d) The flow at
 $t=2.5$
, 7.5, 15 and 22.5, just after the first four forcing times
 $t=0$
, 7, 14, 21. (e,f) Later times:
 $t=50$
and
 $t=70$
. The black rectangles indicate the location of the numerical dipole generators.

Figure 1 shows the vertical vorticity in horizontal cross-sections for four times just after the beginning of a simulation and two times slightly later. At
 $t=2.5$
(figure 1
a), we see two dipoles that have been forced at the very beginning of the simulation. They have been generated by a constant force corresponding to four Lamb–Oseen vortices applied between times
 $t=0$
and
 $t={\it\tau}_{f}=0.5$
with abrupt switchings on and off. More precisely, the vertical vorticity of the forcing
 $\boldsymbol{f}$
in the momentum equation (2.1) is given by
 $$\begin{eqnarray}(\boldsymbol{{\rm\nabla}}\times \boldsymbol{f})\boldsymbol{\cdot }\boldsymbol{e}_{\boldsymbol{z}}=\frac{1}{{\it\tau}_{f}}\mathop{\sum }_{i=1,2,3,4}\frac{{\it\Gamma}_{i}}{{\rm\pi}a^{2}}\exp \frac{-(x-x_{i})^{2}-(y-y_{i})^{2}}{a^{2}}\end{eqnarray}$$
where
 $(x_{i},~y_{i})$
is the centre of each vortex,
 ${\it\Gamma}_{1}=-{\it\Gamma}_{2}={\it\Gamma}_{3}=-{\it\Gamma}_{4}={\it\Gamma}$
their circulations and
 $a$
their radius. This forcing applied impulsively for a short time
 ${\it\tau}_{f}$
results in the formation of two dipoles very similar to the forcing field and to those observed in the experiments. From a numerical point of view, the only particularity of the forcing method is that the Fourier transformed force
 $\hat{\boldsymbol{f}}$
has a non-random phase distribution since it corresponds to coherent structures in physical space. The relative phase of the Fourier components are indeed usually obtained by means of random processes (see for example Waite & Bartello Reference Waite and Bartello2004; Lindborg Reference Lindborg2006; Brethouwer et al.
Reference Brethouwer, Billant, Lindborg and Chomaz2007).
For simplicity and without loss of generality,
 $a$
and
 ${\it\Omega}^{-1}=2{\rm\pi}a^{2}/|{\it\Gamma}_{i}|$
are taken respectively as length and time units, i.e. are fixed to unity (
 ${\it\Omega}$
is the maximum angular velocity of the vortices). The density perturbations
 ${\it\rho}^{\prime }$
are non-dimensionalized by
 $a|\text{d}\bar{{\it\rho}}/\text{d}z|$
. The same symbols are kept for the non-dimensional variables. This leads to the following definitions for the Froude number
 $F_{h}$
, Reynolds number
 $\mathit{Re}$
and buoyancy Reynolds number
 $\mathscr{R}$
based on the forced vortices
 $$\begin{eqnarray}F_{h}=\frac{{\it\Omega}}{N},\quad \mathit{Re}=\frac{{\it\Omega}a^{2}}{{\it\nu}},\quad \mathscr{R}=\mathit{Re}{F_{h}}^{2}.\end{eqnarray}$$
The Schmidt number
 $\mathit{Sc}={\it\nu}/{\it\kappa}$
is set to unity throughout the paper. The separation distance between the two vortices of a pair
 $b=\sqrt{(x_{1}-x_{2})^{2}+(y_{1}-y_{2})^{2}}=\sqrt{(x_{3}-x_{4})^{2}+(y_{3}-y_{4})^{2}}$
is set to
 $b=2a$
. Because of this relatively small separation, the vortices are slightly deformed after their generation as can be seen in figure 1(a).
Temporal evolution of the kinetic
 $E_{K}$
and potential
 $E_{P}$
energies (a) and their dissipation rates
 ${\it\varepsilon}_{\!K}$
,
 ${\it\varepsilon}_{\!P}$
and total dissipation
 ${\it\varepsilon}$
(b) for
 $F_{h}=0.85$
and
 $\mathscr{R}=450$
corresponding to the highest buoyancy Reynolds number obtained in the experiments. In (a), the dashed line corresponds to the energy
 $E_{SM}$
associated with the shear modes. In (b), the dashed line corresponds to the dissipation due to vertical gradient of horizontal velocity
 ${\it\varepsilon}_{\!K}^{(k_{z})}$
. The staircase curve shows
 $\breve{P}(t)$
the injection rate averaged over one injection sequence of two dipoles,
 ${\rm\Delta}t/4=7$
.

The forcing is periodic in time with a period
 ${\rm\Delta}t=28$
meaning that two new dipoles are forced every
 ${\rm\Delta}t/4=7$
. Accordingly, we see two new dipoles at
 $t=7.5$
(figure 1
b). They have been just forced between
 $t=7$
and
 $7.5$
on the opposite side of the box. We can note that the vortices are still almost circular. Figure 1(c,d) correspond to times
 $t=15$
and
 $22.5$
, respectively, just after the forcing of the third and fourth pairs of dipoles in the right and left of the box. The forcing continues periodically exactly in the same way so that, quickly, several columnar dipoles are present in the numerical box and interact together (figure 1
e,f). A white noise of small amplitude corresponding to approximately 1 % of the kinetic energy of the statistically stationary flows is added to the velocity field at
 $t=0$
in order to allow the three-dimensionalization of the flows. In § 4, a slightly different forcing consisting in a randomly located dipole generator will be used. This forcing will be described in § 4.1.
Figure 2(a) shows the time evolution of the kinetic energy (dark crumpled curve) and potential energy (light curve). Figure 2(b) displays the total, kinetic and potential dissipation rates (
 ${\it\varepsilon}$
,
 ${\it\varepsilon}_{\!K}$
and
 ${\it\varepsilon}_{\!P}$
, respectively) scaled by the mean injection rate
 $\bar{P}$
(continuous curves). The instantaneous energy injection rate
 $P(t)$
depends on the velocity field as (Alvelius Reference Alvelius1999)
 $$\begin{eqnarray}P(t)=\frac{1}{2}\mathop{\sum }_{\boldsymbol{k}}\hat{\boldsymbol{f}}\boldsymbol{\cdot }\hat{\boldsymbol{f}}^{\ast }\,\text{d}t+\frac{1}{2}\mathop{\sum }_{\boldsymbol{k}}(\hat{\boldsymbol{u}}\boldsymbol{\cdot }\hat{\boldsymbol{f}}^{\ast }+\hat{\boldsymbol{u}}^{\ast }\boldsymbol{\cdot }\hat{\boldsymbol{f}}),\end{eqnarray}$$
where
 $\text{d}t$
is the time step,
 $\text{}^{\ast }$
denotes the complex conjugate,
 $\hat{\boldsymbol{u}}$
is the Fourier-transformed velocity,
 $\hat{\boldsymbol{f}}$
is the Fourier-transformed force and the summations are taken over all wavenumbers
 $\boldsymbol{k}$
. The first term on the right-hand side of (2.5) is obtained by computing the energy injection due to a constant force over one time step taking into account the evolution of the flow during the time step at the first order in
 $\text{d}t$
(Alvelius Reference Alvelius1999). The forcing used herein implies that this term is much smaller than the second in contrast to the forcing used by Lindborg & Brethouwer (Reference Lindborg and Brethouwer2007).
Figure 2(b) does not show the instantaneous forcing
 $P(t)$
but the forcing
 $\breve{P}(t)$
averaged over the forcing time sequence of one pair of dipoles
 ${\rm\Delta}t/4=7$
. This quantity
 $\breve{P}(t)$
represents thus the mean injection rate over the forcing sequence. Up to
 $t\simeq 80$
, the kinetic energy increases in average linearly with time although staircases are present at each forcing time. For times between
 $t=80$
and
 $100$
, the sharp increases become somewhat more erratic. This irregularity can be also seen in the injection rate
 $\breve{P}(t)$
(figure 2
b). Since the force is constant during the forcing events, the second term in the right-hand side of (2.5) shows that the energy injection rate
 $P(t)$
depends directly on the velocity field at the location of the forcing. This effect is stronger when the velocity is large and when the flow is not yet fully three-dimensional. This explains why it starts to occur at
 $t\simeq 90$
. Nevertheless, the forcing is able to produce coherent dipoles even when the background flow is fully turbulent.
Overview of the physical and numerical parameters of the simulations with experimental-like dipole generators. The number of nodes in the horizontal and vertical directions are denoted
 $N_{h}$
and
 $N_{z}$
, respectively. We recall that the length and time units is
 $a$
and
 ${\it\Omega}^{-1}$
, respectively. The horizontal width and height of the numerical box are equal to
 $\mathscr{L}_{h}=30$
and
 $\mathscr{L}_{z}=10$
or 12, except for the simulation for
 $F_{h}=0.66$
and
 $\mathit{Re}=8000$
for which the height is divided by 2. For all the simulations, the mean injection rate
 $\bar{P}$
is of the order of 0.001. Here
 $k_{max}$
is the maximum resolved wavenumber,
 $k_{{\it\eta}}=(\bar{P}/{\it\nu}^{3})^{1/4}$
the Kolmogorov wavenumber and
 $k_{b}=N/U_{h}$
the buoyancy wavenumber.

Up to
 $t=100$
, the flow remains almost vertically uniform but around this time, the dissipation due to vertical gradient (dashed line in figure 2
b) suddenly increases, showing that the flow is then fully three-dimensional. This process is associated with an increase of the potential energy
 $E_{P}$
(figure 2
a) and of the potential energy dissipation
 ${\it\varepsilon}_{\!P}$
(figure 2
b) (light lines). Between
 $t=100$
and
 $250$
, the total dissipation rate (thick line) is larger than the injection rate such that the energy decreases. The flow reaches a nearly statistically stationary state only after
 $t=250$
. Interestingly, the energetics of the simulations at early times are very similar to what is obtained with random forcing of large-scale two-dimensional Fourier modes: an initial build-up of two-dimensional kinetic energy followed by a decrease in kinetic energy and an increase in potential energy as the flow three-dimensionalizes (see, for example, Waite & Bartello Reference Waite and Bartello2004; Lindborg Reference Lindborg2006). This demonstrates the robustness of this phenomenon to the details of the forcing. Although
 ${\it\varepsilon}/\bar{P}\simeq 1$
, the flow is not exactly statistically stationary: the energy in the so-called ‘shear modes’, i.e. the horizontally invariant modes (dashed line) slowly increases as first reported by Smith & Waleffe (Reference Smith and Waleffe2002). Lindborg (Reference Lindborg2006) argued that such growing shear modes are due to a too strong dissipation at large scales. However, we observe an increase of the shear-mode energy even for the largest buoyancy Reynolds numbers achieved, which seems to invalidate this idea. Alternatively, Smith & Waleffe (Reference Smith and Waleffe2002) have explained the growth of the shear-mode energy by off-resonant three-wave interactions. The effect of the shear modes is investigated in appendix A.
2.3. Choice of the physical and numerical parameters
The parameters of the main runs are summarized in table 1. The Froude and the Reynolds number have been varied in the ranges
 $0.5\leqslant F_{h}\leqslant 2$
and
 $120\leqslant \mathit{Re}\leqslant 8000$
. The Froude number range is approximately the same as in the experiments (Augier et al.
Reference Augier, Billant, Negretti and Chomaz2014),
 $0.24\leqslant F_{h}\leqslant 0.85$
, but the Reynolds number range is significantly larger than in the experiments,
 $120\leqslant \mathit{Re}\leqslant 430$
. Like in the experiments, we define also turbulent Froude, Reynolds and buoyancy Reynolds numbers based on the square root of the horizontal kinetic energy
 $U_{h}=\langle (u_{x}^{2}+u_{y}^{2})/2\rangle ^{1/2}$
and the integral lengthscale
 $L_{h}={U_{h}}^{3}/{\it\varepsilon}_{\!K}$
:
 $$\begin{eqnarray}F_{ht}=\frac{U_{h}}{NL_{h}}=\frac{{\it\varepsilon}_{\!K}}{{U_{h}}^{2}N},\quad \mathit{Re}_{t}=\frac{U_{h}L_{h}}{{\it\nu}}=\frac{{U_{h}}^{4}}{{\it\varepsilon}_{\!K}{\it\nu}}\quad \text{and}\quad \mathscr{R}_{t}=\frac{{\it\varepsilon}_{\!K}}{{\it\nu}N^{2}},\end{eqnarray}$$
where
 ${\it\varepsilon}_{\!K}$
is the mean kinetic dissipation rate during the statistically stationary regime. The turbulent buoyancy Reynolds number is commonly used to characterize geophysical turbulence (see, for example, Ivey & Imberger Reference Ivey and Imberger1991; Riley & de Bruyn Kops Reference Riley and de Bruyn Kops2003; Brethouwer et al.
Reference Brethouwer, Billant, Lindborg and Chomaz2007). Here,
 $\mathscr{R}_{t}$
is approximately proportional to the buoyancy Reynolds number
 $\mathscr{R}={\it\Omega}^{3}a^{2}/(N^{2}{\it\nu})$
based on the angular velocity
 ${\it\Omega}$
and radius
 $a$
of the forced vortices (Hebert & de Bruyn Kops Reference Hebert and de Bruyn Kops2006a
). However, the turbulent buoyancy Reynolds number
 $\mathscr{R}_{t}$
depends on the dissipation rate averaged over the whole numerical domain. While this mean quantity is appropriate to characterize spatially homogeneous flows, it is less adequate when the flow is spatially inhomogeneous like in §§ 2 and 3. Indeed, we shall see in § 3.5 that the local dissipation rate can vary significantly in the horizontal plane depending on the distance to the vortex generators. Hence, it is more meaningful to compare the numerical and the experimental flows on the basis of the buoyancy Reynolds number
 $\mathscr{R}$
since it depends only on the parameters characterizing the fluid and the forced dipoles, i.e. on input parameters that can be directly measured and controlled in the experiments. Nevertheless, the corresponding value of the turbulent buoyancy Reynolds number
 $\mathscr{R}_{t}$
will be also given in § 3 for information. In § 4, the turbulent buoyancy Reynolds number
 $\mathscr{R}_{t}$
will be more meaningful and useful since the flow will be spatially homogeneous.
In order to compare the numerical and experimental flows, we have performed simulations for each Froude number, for Reynolds numbers typical of the experiments:
 $120\leqslant \mathit{Re}\leqslant 450$
. We have also investigated several higher values of the Reynolds number
 $1000\lesssim \mathit{Re}\leqslant 8000$
to extend the experimental results to high buoyancy Reynolds number. The horizontal resolution is varied between
 $N_{h}=192$
and
 $N_{h}=1600$
depending on the Reynolds number. The vertical resolution is chosen so that the numerical mesh is nearly isotropic.
The height of the numerical box
 $\mathscr{L}_{z}=10{-}12$
is large compared with the characteristic vertical length scale of the layers developing in stratified flows. The vertical size of the box is reduced to
 $\mathscr{L}_{z}=6$
in the simulation for the largest buoyancy Reynolds number achieved
 $\mathscr{R}=3560$
(
 $\mathscr{R}_{t}=2.4$
), corresponding to
 $F_{h}=0.66$
and
 $\mathit{Re}=8000$
. This value of
 $\mathscr{L}_{z}$
is still sufficient to have several layers along the vertical. In § 4, the sizes of the computational domain will be reduced in order to achieve higher resolutions. These different numerical parameters will be described in § 4.1.
3. Forcing with experimental-like dipole generators
In this section, we describe the flows generated with the numerical forcing described in the previous section. A slightly modified forcing will be presented in the next section (§ 4). We first focus on the effect of the buoyancy Reynolds number and describe the numerical simulations for
 $F_{h}=0.85$
, which corresponds to the larger horizontal Froude number achieved in the experiments (Augier et al.
Reference Augier, Billant, Negretti and Chomaz2014). The effect of the horizontal Froude number is then presented. Finally, the simulations with the highest buoyancy Reynolds number for this first set of simulations
 $\mathscr{R}=3560$
(
 $\mathscr{R}_{t}=2.4$
) are analysed.
3.1. Effect of the buoyancy Reynolds number
Figure 3 displays horizontal and vertical cross-sections of the flow for
 $F_{h}=0.85$
,
 $\mathscr{R}=1080$
(
 $\mathscr{R}_{t}=0.81$
) and for a time
 $t=475$
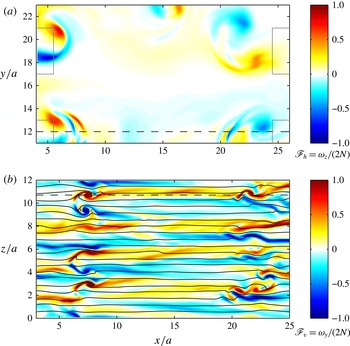
corresponding to the statistically stationary regime. Only a portion of the numerical box is shown to zoom in. The positions of four dipole generators are indicated by black rectangles. The colours in figure 3(a) represent the local horizontal Froude number defined as
 $\mathscr{F}_{h}={\it\omega}_{z}/(2N)$
, i.e. the vertical vorticity
 ${\it\omega}_{z}$
rescaled by
 $2N$
. The extrema of the local horizontal Froude number
 $\mathscr{F}_{h}$
corresponding to the large-scale vortices seen in figure 3(a) are of the same order as the horizontal Froude number
 $F_{h}=0.85$
confirming the equivalence between the local horizontal Froude number
 $\mathscr{F}_{h}$
and the Froude number
 $F_{h}$
based on the forced vortices. Large-scale vortices are seen only in the vicinity of the vortex generators. This is because they are destroyed by instabilities and interactions with the ambient flow before reaching the central part of the box as observed in the experiments. The nature of the small-scale structures visible on the sides of the horizontal cross-section in 3(a) can be understood by looking at the vertical cross-section in figure 3(b), where the isopycnals are plotted in black lines. We see overturnings of the isopycnals typical of the shear instability. In this figure, the colours correspond to the local vertical Froude number defined as
 $\mathscr{F}_{v}={\it\omega}_{y}/(2N)$
, where
 ${\it\omega}_{y}$
is the vorticity component normal to the view plane. This number compares locally the horizontal vorticity (which corresponds to the vertical gradients of horizontal velocity in strongly stratified flows) to the mean stratification. When the local density perturbations are neglected, this Froude number can be used to quantify approximately the local Richardson number:
 $$\begin{eqnarray}\mathit{Ri}=\frac{-(g/{\it\rho}_{0})(\partial {\it\rho}_{tot}/\partial z)}{|\partial \boldsymbol{u}_{h}/\partial z|^{2}}\lesssim \frac{1}{4\mathscr{F}_{v}^{2}}.\end{eqnarray}$$
This means that a value
 $\mathscr{F}_{v}=O(1)$
corresponds to a Richardson number of order
 $1/4$
, the critical value below which the shear instability can develop for an inviscid parallel stratified flow (Miles Reference Miles1961; Howard Reference Howard1961). We see that
 $|\mathscr{F}_{v}|$
is indeed high and of order unity in the regions where the overturnings of the isopycnals occur.
Horizontal cross-section at
 $z/a=4$
(a) (only half the domain is shown), and vertical cross-section at
 $y/a=20$
(b) of the flow for
 $F_{h}=0.85$
and
 $\mathscr{R}=1080$
(
 $\mathscr{R}_{t}=0.81$
) and for a time
 $t=420$
corresponding to the statistically stationary regime. The contours represent the local horizontal Froude number
 $\mathscr{F}_{h}={\it\omega}_{z}/(2N)$
in (a) and the local vertical Froude number
 $\mathscr{F}_{v}={\it\omega}_{y}/(2N)$
in (b). The dashed horizontal lines indicate the location of the cross-section in the perpendicular direction. The black lines in (b) are isopycnals of total density with contour interval equal to 0.6. The grey boxes in (a) indicate the regions where the dipole forcing is impulsively applied.

We now turn to smaller values of the buoyancy Reynolds number corresponding to the values achieved in the experiments, where small-scale structures and overturnings were observed only for sufficiently high buoyancy Reynolds number. In order to investigate this point, figure 4 displays horizontal and vertical cross-sections of the flow as in figure 3 but for
 $\mathscr{R}=325$
(
 $\mathscr{R}_{t}=0.28$
), which corresponds to the highest buoyancy Reynolds number achieved in the experiments. Even if the turbulence is less intense, the isopycnals in figure 4(b) are clearly overturned by small billows in the regions where the local vertical Froude number
 $\mathscr{F}_{v}$
is of order unity. In the horizontal cross-section (figure 4
a), we see some small scales superimposed on the large-scale vortices. This confirms indirectly that the shear instability was operating in the experiments for the highest buoyancy Reynolds number achieved
 $\mathscr{R}=325$
(
 $\mathscr{R}_{t}=0.28$
).


(a) Transverse and longitudinal horizontal compensated second-order structure functions
 $S_{2T}(r_{r})$
(continuous lines) and
 $S_{2L}(r_{h})$
(dashed lines) for
 $F_{h}=0.85$
for different buoyancy Reynolds numbers given in the legend of (b). The inset in (a) shows the effective dimension
 $d_{eff}$
defined by (3.2). (b) Horizontal (continuous lines) and vertical (dashed lines) compensated one-dimensional spectra of kinetic energy
 $E_{K}(k_{i}){\it\varepsilon}_{\!K}^{-2/3}{k_{i}}^{5/3}$
for
 $F_{h}=0.85$
as a function of the scaled wavenumber
 $k_{i}/K$
, where
 $k_{i}$
denotes either the horizontal wavenumber
 $k_{h}$
or the vertical wavenumber
 $k_{z}$
. In (b), the horizontal black line corresponds to the
 $C_{1}{\it\varepsilon}_{\!K}^{2/3}{k_{i}}^{-5/3}$
law, with
 $C_{1}=0.5$
.

In the experimental study (Augier et al.
Reference Augier, Billant, Negretti and Chomaz2014), the appearance of small scales has been quantified by measuring the horizontal transverse second-order structure function
 $S_{2T}(r_{h})=\langle [{\it\delta}u_{x}({\it\delta}y=r_{h})]^{2}+[{\it\delta}u_{y}({\it\delta}x=r_{h})]^{2}\rangle /2$
and the horizontal longitudinal second-order structure function
 $S_{2L}(r_{h})=\langle [{\it\delta}u_{x}({\it\delta}x=r_{h})]^{2}+[{\it\delta}u_{y}({\it\delta}y=r_{h})]^{2}\rangle /2$
, where
 ${\it\delta}u_{x}({\it\delta}y)=u_{x}(\boldsymbol{x}+{\it\delta}y\boldsymbol{e}_{\boldsymbol{y}})-u_{x}(\boldsymbol{x})$
is the transverse increment of
 $u_{x}$
,
 ${\it\delta}u_{x}({\it\delta}x)=u_{x}(\boldsymbol{x}+{\it\delta}x\boldsymbol{e}_{\boldsymbol{x}})-u_{x}(\boldsymbol{x})$
is the longitudinal increment of
 $u_{x}$
and the increments of
 $u_{y}$
are defined similarly. Figure 5(a) displays the compensated structure functions for four buoyancy Reynolds numbers in the range
 $86\leqslant \mathscr{R}\leqslant 2170$
for
 $F_{h}=0.85$
(
 $0.09\leqslant \mathscr{R}_{t}\leqslant 1.46$
). The increment
 $r_{h}$
is scaled by
 $R\equiv 4a$
, the characteristic length scale of the dipoles that are forced. The power law at the smaller scales correspond to a
 ${r_{h}}^{2}$
slope meaning that the dissipative range is resolved. An inertial range is associated with a structure function scaling like
 ${r_{h}}^{2/3}$
, i.e. a flat slope for the compensated structure functions. We do not see such an inertial range in figure 5(a) even if there is a flattening of the compensated structure functions at very large scales when the buoyancy Reynolds number increases. An increase of the energy at the small scales, especially for the transverse structure functions, can also be seen. This flattening was observed in the experimental study and was interpreted as the first indications of the inertial range that is predicted for large buoyancy Reynolds number. In order to interpret the difference between longitudinal and transverse structure functions, we consider a so-called effective dimension,
 $$\begin{eqnarray}d_{eff}(r_{h})=1+\frac{r_{h}(\partial S_{2L}/\partial r_{h})}{S_{2T}-S_{2L}}.\end{eqnarray}$$
This quantity is not a real dimension but is equal to 2 for a two-dimensional isotropic flow and to 3 for a three-dimensional isotropic flow, since the longitudinal and transverse second-order structure functions are related by
 $$\begin{eqnarray}S_{2T}(r)=\left(1+\frac{r}{d-1}\frac{\partial }{\partial r}\right)S_{2L}(r),\end{eqnarray}$$
where
 $d$
is the dimension of the space. As shown in the inset of figure 5(a), the effective dimension is very close to 2 at large scales for each buoyancy Reynolds number reflecting the fact that the forcing is two-dimensional. However for the highest value of the buoyancy Reynolds number,
 $d_{eff}(r_{h})$
increases at small scales to reach a value around 5 while it remains approximately equal to 2 for the lowest values of the buoyancy Reynolds number. Values of
 $d_{eff}$
larger than 3 were also observed in the experiments. They are related to the fact that the small-scale structures for these intermediate buoyancy Reynolds numbers are three-dimensional but still strongly anisotropic.
Vertical (a,b) and horizontal (c,d) cross-sections of the velocity and local Froude number fields for
 $F_{h}=0.5$
,
 $\mathscr{R}=250$
(
 $\mathscr{R}_{t}=0.21$
) in (a,c) and for
 $F_{h}=2$
,
 $\mathscr{R}=1640$
(
 $\mathscr{R}_{t}=1.8$
) in (b,d).

In figure 5(b), the horizontal compensated one-dimensional spectra of kinetic energy
 $E_{K}(k_{h}){\it\varepsilon}_{\!K}^{-2/3}{k_{h}}^{5/3}$
is plotted as a function of the horizontal wavenumber
 $k_{h}$
scaled by
 $K=2{\rm\pi}/R$
, where
 $R\equiv 4a$
(for details on how the one-dimensional spectra are computed, see Augier et al.
Reference Augier, Chomaz and Billant2012). The vertical compensated spectra
 $E_{K}(k_{z}){\it\varepsilon}_{\!K}^{-2/3}{k_{z}}^{5/3}$
is also shown with dashed lines. At horizontal wavenumbers around
 $K$
, the different horizontal spectra collapse. When the buoyancy Reynolds number is increased, we observe an increase of the spectra at large wavenumber
 $k_{h}>K$
and a decrease at low wavenumbers
 $k_{h}\ll K$
. This indicates that there is more transfers toward small scales and less transfers toward the largest scales. This is consistent with the interpretation of a transition from a regime dominated by viscous effects toward the strongly stratified turbulent regime when the buoyancy Reynolds number is increased. However, for buoyancy Reynolds number of the order of the largest value achieved in the experiments (
 $\mathscr{R}=433$
,
 $\mathscr{R}_{t}=0.37$
, light thin line), the compensated spectra is not flat indicating that there is no inertial range for the typical range of parameters of the experiments. In contrast, the horizontal spectrum for the highest buoyancy Reynolds number
 $\mathscr{R}=2170$
(
 $\mathscr{R}_{t}=1.46$
) in figure 5(b) exhibits a
 $k_{h}^{-5/3}$
power law at wavenumbers slightly larger than
 $K$
. The horizontal black line indicates the
 $C_{1}{{\it\varepsilon}_{\!K}}^{2/3}{k_{h}}^{-5/3}$
law, with
 $C_{1}=0.5$
, which corresponds to the spectra of forced strongly stratified turbulence observed by Lindborg (Reference Lindborg2006) and Brethouwer et al. (Reference Brethouwer, Billant, Lindborg and Chomaz2007). We see that the kinetic energy spectrum for
 $\mathscr{R}=2170$
is close to this line suggesting that the flow approaches the strongly stratified turbulent regime. However, this regime is only incipient since the associated turbulent buoyancy Reynolds number is still only equal to
 $\mathscr{R}_{t}=1.46$
while Brethouwer et al. (Reference Brethouwer, Billant, Lindborg and Chomaz2007) showed that values larger than approximately 5 are necessary to really reach this regime. The compensated vertical spectrum (dashed lines in figure 5
b) strongly varies when the buoyancy Reynolds number is increased with more and more energy at small vertical scales. This confirms that for the smallest values of the buoyancy Reynolds number, vertical scales are controlled by dissipative effects. However, for
 $\mathscr{R}=1080$
(
 $\mathscr{R}_{t}=0.81$
) and
 $\mathscr{R}=2170$
(
 $\mathscr{R}_{t}=1.46$
), a peak in the compensated vertical spectra can be seen at approximately
 $k_{z}=1.5K$
. For both simulations, this wavenumber is not in the dissipative range in contrast to the simulations for the smaller values of the buoyancy Reynolds number, where no peak is observed. The appearance of the
 ${k_{h}}^{-5/3}$
power law in the horizontal spectra coincides with the appearance of this peak.
3.2. Effect of the Froude number
 $F_{h}$

The effect of the horizontal Froude number
 $F_{h}$
is addressed in figure 6. Vertical (a,b) and horizontal (c,d) cross-sections of the flow are presented for two different horizontal Froude numbers:
 $F_{h}=0.5$
(a,c) and
 $F_{h}=2$
(b,d) but for similar values of the quantity
 $\mathscr{R}^{\prime }=(\mathit{Re}-400){F_{h}}^{2}$
. The condition
 $\mathscr{R}^{\prime }>4$
should be satisfied to have the shear instability developing on a single columnar dipole affected by the zigzag instability (Augier & Billant Reference Augier and Billant2011). Here, it is approximately
 $\mathscr{R}^{\prime }\simeq 40$
like in the experiments for
 $\mathscr{R}=330$
. The local horizontal Froude number
 $\mathscr{F}_{h}={\it\omega}_{z}/(2N)$
(figure 6
c,d) has maximum values of the order of
 $F_{h}$
. In contrast, the local vertical Froude number
 $\mathscr{F}_{v}={\it\omega}_{y}/(2N)$
(figure 6
a,b) is of order unity. We see in figure 6(a) several rolls that are small compared with the horizontal scale of the vortices and seems to be due to the shear instability. Since
 $F_{h}=2$
corresponds to a weakly stratified flow, the maximum values of
 $|\mathscr{F}_{v}|$
are even higher than unity in figure 6(b). The rolls are in that case about the same size as the horizontal vortices.
3.3. Vertical structure
In order to quantify the variations with the buoyancy Reynolds number and the Froude number
 $F_{h}$
of the characteristic length scales of the flow, we have computed the characteristic vertical length scale
 $l_{v}=(2{U_{x}}^{2}/\langle [\partial _{z}u_{x}]^{2}\rangle )^{1/2}$
and horizontal length scale
 $l_{h}=(2{U_{x}}^{2}/\langle [\partial _{x}u_{x}]^{2}\rangle )^{1/2}$
, where
 $u_{x}$
is the velocity component in the
 $x$
direction and
 ${U_{x}}^{2}=\langle {u_{x}}^{2}\rangle$
. These scales are the equivalent of the Taylor micro-scale in isotropic turbulence. The evolution of the aspect ratio
 $l_{v}/l_{h}$
when the buoyancy Reynolds number is varied is shown in figure 7. Following Brethouwer et al. (Reference Brethouwer, Billant, Lindborg and Chomaz2007), two different scaling laws are tested: a viscous scaling law in figure 7(a) and an inviscid scaling law in figure 7(b). The viscous scaling law is obtained by balancing the dissipation due to vertical gradients and the horizontal advection
 $l_{v}\sim \sqrt{{\it\nu}l_{h}/U}\sim l_{h}/\sqrt{\mathit{Re}}$
(Godoy-Diana et al.
Reference Godoy-Diana, Chomaz and Billant2004). The inviscid scaling law is obtained by balancing the buoyancy term to the vertical advection so that
 $l_{v}\sim U/N\sim l_{h}F_{h}$
(Billant & Chomaz Reference Billant and Chomaz2001). We see that the viscous scaling law works at low
 $\mathscr{R}\lesssim 250$
whereas the invicid scaling law is better at large buoyancy Reynolds number provided that
 $F_{h}\leqslant 1$
. It is consistent with the interpretation of a transition around
 $\mathscr{R}\approx 250$
from a viscous regime for which the vertical length scale is fixed by viscous effects (Godoy-Diana et al.
Reference Godoy-Diana, Chomaz and Billant2004) to a nonlinear stratified regime for which the vertical length scale is fixed by an invariance of the hydrostatic Euler equations valid for strong stratification (Billant & Chomaz Reference Billant and Chomaz2001).
Scaled aspect ratio (a)
 $(l_{v}/l_{h})\mathit{Re}^{1/2}$
and (b)
 $l_{v}/(l_{h}F_{h})$
as a function of
 $\mathscr{R}$
for different
 $F_{h}$
. The viscous and inviscid scaling laws
 $l_{v}/l_{h}\simeq 9.4\mathit{Re}^{-1/2}$
and
 $l_{v}/l_{h}\simeq 0.65F_{h}$
, where the constants are empiric, are plotted respectively with a dashed line and a dotted line. The oblique crosses
 $\times$
correspond to purely toroidal simulations, i.e. to the limit
 $F_{h}=0$
.

3.4. Spectral analyses of the simulation for
$F_{h}=0.66$
and
$\mathscr{R}=3560~(\mathscr{R}_{t}=2.4)$


3.4.1. Two-dimensional energy spectra
Figure 8 displays the compensated horizontal two-dimensional spectra as a function of
 ${\it\kappa}_{h}=({k_{x}}^{2}+{k_{y}}^{2})^{1/2}$
for
 $F_{h}=0.66$
and for
 $\mathscr{R}=3560$
(
 $\mathscr{R}_{t}=2.4$
), i.e. one of the highest buoyancy Reynolds number achieved with the forcing considered in this section (for precise definitions of two-dimensional spectra, see Augier et al.
Reference Augier, Chomaz and Billant2012). The compensated horizontal two-dimensional kinetic spectrum
 $E_{K}({\it\kappa}_{h}){\it\varepsilon}_{\!K}^{-2/3}{\it\kappa}_{h}^{5/3}$
presents a
 ${\it\kappa}_{h}^{-5/3}$
power law at wavenumbers larger than
 $K$
. Remarkably, it approximately collapses on the horizontal line which indicates the
 $C_{2D}{\it\varepsilon}_{\!K}^{2/3}{{\it\kappa}_{h}}^{-5/3}$
law, with
 $C_{2D}=0.66$
corresponding to strongly stratified turbulence (Lindborg & Brethouwer Reference Lindborg and Brethouwer2007). The compensated horizontal two-dimensional potential spectrum
 $E_{P}({\it\kappa}_{h}){\it\varepsilon}_{\!K}^{-2/3}{\it\kappa}_{h}^{5/3}({\it\varepsilon}_{\!K}/{\it\varepsilon}_{\!P})$
also collapses on this line in agreement with Lindborg & Brethouwer (Reference Lindborg and Brethouwer2007). However, both kinetic and potential spectra exhibit a rebound at small scales as also observed by Brethouwer et al. (Reference Brethouwer, Billant, Lindborg and Chomaz2007).
Compensated horizontal two-dimensional spectra (kinetic
 $E_{K}$
, potential
 $E_{P}$
, poloidal
 $E_{Kp}$
and toroidal
 $E_{Kt}$
) as a function of
 ${\it\kappa}_{h}=|\boldsymbol{k}_{h}|$
for
 $F_{h}=0.66$
,
 $\mathscr{R}=3560$
corresponding to
 $\mathscr{R}_{t}=2.4$
. The black horizontal line shows the
 $C_{2D}{\it\varepsilon}_{\!K}^{2/3}{{\it\kappa}_{h}}^{-5/3}$
law, with
 $C_{2D}=0.66$
(Lindborg & Brethouwer Reference Lindborg and Brethouwer2007).

The toroidal spectrum
 $E_{Kt}$
, associated with rotational motions and the poloidal spectrum
 $E_{Kp}$
, associated with the vertical velocity and to the divergence of the horizontal velocity (Craya Reference Craya1958; Herring Reference Herring1974; Cambon Reference Cambon2001; Augier et al.
Reference Augier, Chomaz and Billant2012) are also plotted in dashed and dash-dotted lines, respectively. Note that the toroidal and poloidal spectra cannot be simply associated with vortices or waves since their dynamics are intimately linked when
 $F_{v}\sim 1$
as pointed out by Billant & Chomaz (Reference Billant and Chomaz2001) and Lindborg & Brethouwer (Reference Lindborg and Brethouwer2007). At large scales, the toroidal spectrum dominates reflecting the rotational nature of the forcing by dipoles. The toroidal and poloidal spectra are of the same order in the inertial range as reported by Lindborg & Brethouwer (Reference Lindborg and Brethouwer2007). However, we can see that the poloidal spectrum is slightly larger than its toroidal counterpart as also observed by Waite (Reference Waite2011). This could be due to the shear instability since Kelvin–Helmholtz rolls with axis along the horizontal direction consist only in poloidal velocity. In any case, Lindborg & Brethouwer (Reference Lindborg and Brethouwer2007) have shown that such a high poloidal spectrum does not imply that the flow is dominated by waves. Indeed, a poloidal flow corresponds to linear waves only in the limit
 $F_{v}\ll 1$
.
3.4.2. Spectral energy budget: quantification of the direct energy cascade
The evolution equations of the kinetic and potential energies
 $\hat{E}_{K}(\boldsymbol{k})=|\hat{\boldsymbol{u}}|^{2}/2$
and
 $\hat{E}_{P}(\boldsymbol{k})=|\hat{{\it\rho}^{\prime }}|^{2}/(2{F_{h}}^{2})$
of a wavenumber
 $\boldsymbol{k}$
can be expressed as
 $$\begin{eqnarray}\displaystyle & \displaystyle \frac{\text{d}\hat{E}_{K}(\boldsymbol{k})}{\text{d}t}=\hat{T}_{K}-{\hat{C}}-\hat{D}_{K}+\hat{P}, & \displaystyle\end{eqnarray}$$
 $$\begin{eqnarray}\displaystyle & \displaystyle \frac{\text{d}\hat{E}_{P}(\boldsymbol{k})}{\text{d}t}=\hat{T}_{P}+{\hat{C}}-\hat{D}_{P}, & \displaystyle\end{eqnarray}$$
 $\hat{T}_{K}=-\text{Re}[\hat{\boldsymbol{u}}^{\ast }(\boldsymbol{k})\boldsymbol{\cdot }P_{\bot }\widehat{(\boldsymbol{u}\boldsymbol{\cdot }\boldsymbol{{\rm\nabla}}\boldsymbol{u})}(\boldsymbol{k})]$
and
 $\hat{T}_{P}=-F_{h}^{-2}\text{Re}[\hat{{\it\rho}^{\prime }}^{\ast }(\boldsymbol{k})\widehat{(\boldsymbol{u}\boldsymbol{\cdot }\boldsymbol{{\rm\nabla}}{\it\rho}^{\prime })}(\boldsymbol{k})]$
are the kinetic and potential nonlinear transfers,
 $\hat{D}_{K}(\boldsymbol{k})=(|\boldsymbol{k}|^{2}/\mathit{Re}+|\boldsymbol{k}|^{8}/\mathit{Re}_{4})|\hat{\boldsymbol{u}}|^{2}$
and
 $\hat{D}_{P}(\boldsymbol{k})=(|\boldsymbol{k}|^{2}/(\mathit{ReSc})+|\boldsymbol{k}|^{8}/\mathit{Re}_{4})|\hat{{\it\rho}^{\prime }}|^{2}/{F_{h}}^{2}$
are the kinetic and potential mean energy dissipation,
 ${\hat{C}}(\boldsymbol{k})=F_{h}^{-2}\text{Re}[\hat{{\it\rho}^{\prime }}^{\ast }(\boldsymbol{k}){\hat{w}}(\boldsymbol{k})]$
is the local (in spectral space) conversion of kinetic energy into potential energy and
 $\hat{P}(\boldsymbol{k})=\text{Re}[\hat{\boldsymbol{u}}^{\ast }(\boldsymbol{k})\hat{\boldsymbol{f}}(\boldsymbol{k})]$
. When (3.4) and (3.5) are summed over the wavenumbers inside a vertical cylinder
 ${\it\Omega}_{h}$
of radius
 ${\it\kappa}_{h}$
in spectral space, we obtain
 $$\begin{eqnarray}\displaystyle & \displaystyle \frac{\text{d}\mathscr{E}_{K}({\it\kappa}_{h})}{\text{d}t}=-{\it\Pi}_{K}({\it\kappa}_{h})-\mathscr{C}({\it\kappa}_{h})-{\it\varepsilon}_{\!K}({\it\kappa}_{h})+P({\it\kappa}_{h}), & \displaystyle\end{eqnarray}$$
 $$\begin{eqnarray}\displaystyle & \displaystyle \frac{\text{d}\mathscr{E}_{P}({\it\kappa}_{h})}{\text{d}t}=-{\it\Pi}_{P}({\it\kappa}_{h})+\mathscr{C}({\it\kappa}_{h})-{\it\varepsilon}_{\!P}({\it\kappa}_{h}), & \displaystyle\end{eqnarray}$$
 $\mathscr{E}_{K}({\it\kappa}_{h})=\sum _{|\boldsymbol{k}_{h}|\leqslant {\it\kappa}_{h},k_{z}}\hat{E}_{K}(\boldsymbol{k})$
,
 ${\it\Pi}_{K}({\it\kappa}_{h})$
is the kinetic flux going outside of
 ${\it\Omega}_{h}$
,
 $\mathscr{C}({\it\kappa}_{h})$
the cumulative conversion rate of kinetic energy into potential energy inside
 ${\it\Omega}_{h}$
,
 ${\it\varepsilon}_{\!K}({\it\kappa}_{h})$
the cumulative kinetic dissipation rate inside
 ${\it\Omega}_{h}$
(not to be confused with the total kinetic dissipation rate
 ${\it\varepsilon}_{\!K}$
) and
 $P({\it\kappa}_{h})$
the cumulative forcing rate inside
 ${\it\Omega}_{h}$
. The quantities with the subscript
 $P$
are defined similarly but for the potential energy. Following Augier et al. (Reference Augier, Chomaz and Billant2012), the horizontal wavenumber
 ${\it\kappa}_{h}$
is discretized as
 ${\it\kappa}_{h}={\it\delta}{\it\kappa}_{h}(1/2+l)$
, where
 ${\it\delta}{\it\kappa}_{h}=2{\rm\pi}/\mathscr{L}_{h}$
and
 $l$
is the discretization integer, in order for the fluxes of the shear modes not to be located at
 $-\infty$
in logarithmic plots. As explained in Augier et al. (Reference Augier, Chomaz and Billant2012), it is interesting to consider the integrated equations (3.6) and (3.7) because the nonlinear terms are conservative and dissipation is non-negligible only at small scales.
The energy fluxes, cumulative conversion and cumulative dissipation are plotted versus
 ${\it\kappa}_{h}$
in figure 9(a) for
 $F_{h}=0.66$
and
 $\mathscr{R}=3560$
(
 $\mathscr{R}_{t}=2.4$
). All of the curves have been averaged over the time interval
 $545\leqslant t\leqslant 555$
in the statistically stationary regime (see figure 2) and are scaled by the mean injection rate
 $\bar{P}$
. The horizontal wavenumber
 ${\it\kappa}_{h}$
is scaled by
 $K$
the horizontal wavenumber associated with the forced dipoles.
Spectral energy budget for (a)
 $F_{h}=0.66$
,
 $\mathscr{R}=3560$
(
 $\mathscr{R}_{t}=2.4$
) and (b)
 $F_{h}=0.85$
and
 $\mathscr{R}=325$
(
 $\mathscr{R}_{t}=0.28$
). Fluxes going out from a vertical cylinder
 ${\it\Omega}_{h}$
of radius
 ${\it\kappa}_{h}$
in spectral space and dissipations inside this cylinder. The continuous dark thin, light thin and black thick curves are respectively the kinetic
 ${\it\Pi}_{K}({\it\kappa}_{h})$
, potential
 ${\it\Pi}_{P}({\it\kappa}_{h})$
and total
 ${\it\Pi}({\it\kappa}_{h})$
horizontal fluxes through the surface of
 ${\it\Omega}_{h}$
. The dashed thick curve is the total cumulative dissipation inside the volume
 ${\it\Omega}_{h}$
. The dotted dashed black curve is
 $\mathscr{C}({\it\kappa}_{h})$
, the cumulative conversion from kinetic into potential energies, i.e. the sum inside the volume
 ${\it\Omega}_{h}$
of the local conversion
 ${\hat{C}}(\boldsymbol{k})$
. The lowest wavenumber corresponds to the shear modes. The sum
 ${\it\Pi}({\it\kappa}_{h})+{\it\varepsilon}({\it\kappa}_{h})$
is shown by a dotted line.

The sum
 ${\it\Pi}({\it\kappa}_{h})+{\it\varepsilon}({\it\kappa}_{h})$
, where
 ${\it\Pi}={\it\Pi}_{K}+{\it\Pi}_{P}$
and
 ${\it\varepsilon}({\it\kappa}_{h})={\it\varepsilon}_{\!K}({\it\kappa}_{h})+{\it\varepsilon}_{\!P}({\it\kappa}_{h})$
, is shown by a dotted line. We see that it increases sharply in the wavenumber range
 $0.3\lesssim {\it\kappa}_{h}/K\lesssim 1.4$
and then remains constant. Since the flow is statistically stationary, this quantity is equal to
 $P({\it\kappa}_{h})$
the mean injection rate by the forcing. Therefore,
 ${\it\Pi}({\it\kappa}_{h})+{\it\varepsilon}({\it\kappa}_{h})$
increases abruptly in the range of wavenumbers forced by the dipole generators.
Positive nonlinear fluxes (continuous lines) dominate the cumulative energy dissipation (thick dashed line) at the typical wavenumber of the forcing
 ${\it\kappa}_{h}\simeq K$
. For this Froude number
 $F_{h}=0.66$
and buoyancy Reynolds number
 $\mathscr{R}=3560$
(
 $\mathscr{R}_{t}=2.4$
) there is a range of wavenumbers between
 ${\it\kappa}_{h}\simeq K$
and
 ${\it\kappa}_{h}\simeq 5K$
for which the flux of total energy (thick continuous line) is of order
 $0.6\bar{P}$
and slowly varies whereas the cumulative dissipation remains relatively weak. This range corresponds therefore to an inertial range with a downscale energy cascade. It is only for
 ${\it\kappa}_{h}>7K$
that the total flux rapidly decreases and the cumulative dissipation increases, indicating that the dissipative range is separated from the forcing range. However, this separation is weak since the cumulative dissipation is of order
 $0.2\bar{P}$
at
 ${\it\kappa}_{h}=K$
and increases up to approximately
 $0.4\bar{P}$
in the inertial range. This is consistent with the relatively low value of the turbulent buoyancy Reynolds number
 $\mathscr{R}_{t}=2.4$
compared with those required to obtain strongly stratified turbulence
 $\mathscr{R}_{t}\simeq 5$
according to Brethouwer et al. (Reference Brethouwer, Billant, Lindborg and Chomaz2007). The cumulative conversion from kinetic to potential energies
 $\mathscr{C}({\it\kappa}_{h})=\sum _{|\boldsymbol{k}_{h}|\leqslant {\it\kappa}_{h_{\vphantom{1}}},k_{z}}{\hat{C}}(\boldsymbol{k})$
(black dot-dashed line) increases slowly in the forcing range and in the inertial range and then decreases slightly in the dissipation range for wavenumber
 ${\it\kappa}_{h}>10K$
indicating that there is a weak conversion back from potential to kinetic energies in this range.
Finally, we can note in figure 9(a) that the nonlinear flux of kinetic energy is slightly negative for
 ${\it\kappa}_{h}\rightarrow 0$
and that this upscale flux is not balanced by dissipation. This corresponds to the transfer toward the shear modes. As is often observed in numerical simulations of strongly stratified turbulence (Smith & Waleffe Reference Smith and Waleffe2002; Lindborg Reference Lindborg2006; Brethouwer et al.
Reference Brethouwer, Billant, Lindborg and Chomaz2007), the energy of these horizontally invariant modes therefore grows slowly. This is not a problem as long as the simulation is not run for too long a time.
Figure 9(b) presents the energy budget for
 $F_{h}=0.85$
and for the highest value of
 $\mathscr{R}$
achieved in the experiments
 $\mathscr{R}=325$
(
 $\mathscr{R}_{t}=0.28$
). The cumulative dissipation
 ${\it\varepsilon}({\it\kappa}_{h})$
(thick dashed line) is approximately equal to
 $0.1\bar{P}$
for the smallest wavenumbers and, then, increases rapidly for the forced wavenumbers:
 $0.4\lesssim {\it\kappa}_{h}/K\lesssim 1.4$
. For
 ${\it\kappa}_{h}=1.4$
,
 ${\it\varepsilon}({\it\kappa}_{h})$
is already around
 $0.85\bar{P}$
meaning that the dissipation occurs mainly at large scales and that only a small portion of the energy is still available to be transferred to smaller scales.
The flux of total energy
 ${\it\Pi}({\it\kappa}_{h})$
(thick continuous line) is negative at small wavenumbers
 ${\it\kappa}_{h}\lesssim 0.4K$
indicating a backward flux but it is completely balanced by dissipation (thick dashed line). In addition, the flux of potential energy (light continuous line) is negligible at these scales. The total flux
 ${\it\Pi}({\it\kappa}_{h})$
becomes positive at wavenumber around
 $0.7K$
and increases up to
 $0.15\bar{P}$
at wavenumbers around
 $1{-}2K$
corresponding to a weak downscale energy flux.
The cumulative conversion from kinetic to potential energy
 $\mathscr{C}({\it\kappa}_{h})$
(dot-dashed line) smoothly increases in the range of forced wavenumbers and then remains constant at smaller scales. The increase of
 $\mathscr{C}({\it\kappa}_{h})$
indicates positive local conversion from kinetic energy to potential energy at the forced wavenumbers. This is due to the bending of the dipoles and to the shear instability.
3.5. Inhomogeneity
Figure 10(a) shows the mean kinetic energy
 $\langle |\boldsymbol{u}|^{2}/2\rangle _{zt}$
averaged over the vertical coordinate
 $z$
and over 20 instantaneous fields belonging to the statistically stationary regime for
 $F_{h}=0.85$
and
 $\mathscr{R}=217$
(
 $\mathscr{R}_{t}=0.19$
). Figure 10(b) shows the quantity
 ${\it\nu}\langle |{\bf\omega}|^{2}\rangle _{tz}/\bar{P}$
which is an estimate of the normalized local kinetic dissipation
 ${\it\varepsilon}_{\!K}(\boldsymbol{x})/\bar{P}$
. We see that both the energy and the enstrophy concentrate in the vicinity of the vortex generators showing that the flow is quite inhomogeneous as in the experiments. This confirms that the dipoles are destabilized quite rapidly, so that they are not able to propagate toward the centre of the numerical box. We see that the local dissipation rate close to the dipole generators is typically twice larger than the space-averaged dissipation rate. This shows that the local turbulent buoyancy Reynolds number near the dipole generators is approximately twice the value of
 $\mathscr{R}_{t}$
. It might be important to take into account this factor two when comparing the present results to those of spatially homogeneous turbulence.
Horizontal cross-section of the mean kinetic energy
 $\langle |\boldsymbol{u}|^{2}/2\rangle _{zt}$
in (a) and of the mean enstrophy scaled by
 $\bar{P}/{\it\nu}$
in (b) for
 $F_{h}=0.85$
and
 $\mathscr{R}=217$
(
 $\mathscr{R}_{t}=0.19$
).

4. Forcing with a randomly located dipole generator
In § 3, we have shown that the numerical simulations with a forcing reproducing the experimental forcing are able on the one hand to reproduce the experimental results when the buoyancy Reynolds number has the same values as in the experiments, and, on the other hand, to approach the characteristic features of strongly stratified turbulence as in Brethouwer et al. (Reference Brethouwer, Billant, Lindborg and Chomaz2007) when the buoyancy Reynolds number is large. This validates the particular numerical forcing with columnar dipoles. However, a drawback of such forcing is that the flow is horizontally inhomogeneous since the dipoles are forced only at the periphery of the numerical box. Moreover, it would be necessary to further increase the buoyancy Reynolds number to have really small dissipation effects at large scales. For this reason, we have modified the numerical methods.
4.1. Modification of the numerical methods
In order to generate a turbulence more homogeneous in the horizontal plane like in strongly stratified turbulence forced in spectral space (Waite & Bartello Reference Waite and Bartello2004; Lindborg Reference Lindborg2006; Brethouwer et al. Reference Brethouwer, Billant, Lindborg and Chomaz2007), we have slightly modified the forcing procedure: dipoles, instead of being generated at fixed locations by pairs, are forced individually at a random location all over the computational domain.
The values of the physical and numerical parameters are reported for each run in table 2. The horizontal size of the computational domain has been reduced to
 $\mathscr{L}_{h}=16a$
. This will allow us to resolve much finer scales for a given resolution and, furthermore, such size is sufficient to capture the largest scales produced by the forcing since the characteristic horizontal length scale of the dipoles is of order
 $R=4a$
. The height of the box is also reduced and set to
 $\mathscr{L}_{z}\simeq 8F_{h}a$
since the characteristic vertical length scale of the layers scales like the buoyancy length scale
 $L_{b}\propto F_{h}a$
. In this way, a sufficient and approximately constant number of layers is simulated for each run. The horizontal Froude number is kept below unity in order to be always in the strongly stratified regime.
Overview of the physical and numerical parameters of the simulations with a randomly located forcing. For all simulations,
 $\mathscr{L}_{h}=16$
. Here
 ${\it\varepsilon}_{{\it\nu}_{4}}$
is the dissipation rate due to hyperviscosity. For these simulations with hyperviscosity, the pseudo-Reynolds numbers are denoted with a tilde
 $\widetilde{\mathit{Re}}$
,
 $\widetilde{\mathscr{R}}$
,
 $\widetilde{\mathit{Re}}_{t}$
 $\widetilde{\mathscr{R}}_{t}$
. The other quantities are defined in table 1 or in the text.

In order to also achieve a larger buoyancy Reynolds number, an isotropic hyperdissipation is added to the Newtonian dissipation. The resolution and the value of the dimensionless hyperviscosity
 $1/\mathit{Re}_{4}={\it\nu}_{4}/({\it\Omega}a^{8})$
are chosen by requiring that the total dissipation frequency at a wavenumber
 ${\it\alpha}k_{max}$
be equal to the dissipation frequency at
 $k_{max}$
for a well-resolved DNS for the same resolution (i.e. a simulation with the same
 $k_{max}$
and a larger viscosity
 ${\it\nu}_{r}(k_{max})$
leading to
 $k_{{\it\eta}}({\it\nu}_{r})=k_{max}$
):
 ${\it\nu}({\it\alpha}k_{max})^{2}+{\it\nu}_{4}({\it\alpha}k_{max})^{8}={\it\nu}_{r}(k_{max}){k_{max}}^{2}$
, where
 ${\it\alpha}$
is a parameter set to 0.85 such that the peak in the dissipation spectra is resolved. We further impose that
 $k_{max}/k_{{\it\eta}}\gtrsim 0.4$
so that the dissipation rate due to hyperviscosity and hyperdiffusivity is smaller than the normal dissipation:
 ${\it\varepsilon}_{{\it\nu}_{4}}/{\it\varepsilon}\leqslant 0.42$
, where
 ${\it\varepsilon}$
is the total dissipation rate and
 ${\it\varepsilon}_{{\it\nu}_{4}}$
the dissipation rate due to hyperviscosity. This constraint imposes that the resolution of the simulations with hyperviscosity can be approximately half (but not less) the resolution that would be necessary to run a full DNS for the same viscosity. It also ensures that the cut-off wavenumber
 $k_{max}$
lies in the viscous dissipation range so that the impact of the hyperdissipation is expected to be weak on the inertial range. This method has been validated against DNS in the case of the transition to turbulence of a dipole in a stratified fluid (Augier et al.
Reference Augier, Chomaz and Billant2012) and for the largest simulation presented in the previous section (
 $F_{h}=0.66$
,
 $\mathscr{R}=3560$
corresponding to
 $\mathscr{R}_{t}=2.4$
). A simulation for the same physical parameters but with approximately twice as coarse resolution and hyperviscosity is compared with the DNS in appendix B. The results of the two simulations are very close confirming that this method provides reliable results and allows one to artificially increase the Reynolds number without increasing the resolution.
Hence, even if the real Reynolds number values of these simulations with hyperviscosity are unknown since they are not DNS, we will continue to indicate, ‘for information’, the Reynolds numbers defined as in (2.4) and (2.6). These Reynolds numbers will however be denoted with a tilde
 $$\begin{eqnarray}\widetilde{\mathit{Re}},\quad \widetilde{\mathscr{R}},\quad \widetilde{\mathscr{R}}_{t},\end{eqnarray}$$
in order to clearly indicate that they should be considered only as ‘pseudo’-Reynolds numbers.
Horizontal (a,c) and vertical (b,d) cross-sections of the flow for
 $F_{h}=0.66$
,
 $\widetilde{\mathscr{R}}=10\,000$
(
 $F_{h}^{t}=0.019$
,
 $\widetilde{\mathscr{R}}_{t}=23$
). In (a,b), the representation is the same as in figure 3. In (c,d), the contours represent the scaled vertical velocity
 $u_{z}/(UF_{h})$
.

The time interval between two successive forcings
 $T_{1}=5$
is lower than in § 3 but note that dipoles were generated by pair with the experiment-like forcing so that, on average, a dipole was forced every
 $T_{1}=3.5$
. However, the horizontal size of the computational domain is now smaller so that the frequency of dipole injection by unit of box surface
 $f_{i}=2{\rm\pi}/(T_{1}\mathscr{L}_{h}^{2})$
is
 $f_{i}=0.005$
for the present random forcing instead of
 $f_{i}=0.002$
for the experiment-like forcing. Due to this difference of forcing intensity, the ratio
 $\widetilde{\mathscr{R}}/\widetilde{\mathscr{R}}_{t}={\it\Omega}^{3}a^{2}/{\it\varepsilon}_{\!K}$
between the buoyancy Reynolds number based on the forced vortices
 $\widetilde{\mathscr{R}}$
and the turbulent one
 $\widetilde{\mathscr{R}}_{t}$
is larger for the experiment-like forcing (
 $\mathscr{R}/\mathscr{R}_{t}\simeq 1300$
) than for the present random forcing (
 $\widetilde{\mathscr{R}}/\widetilde{\mathscr{R}}_{t}\simeq 500$
). In other words, the turbulent buoyancy Reynolds number
 $\widetilde{\mathscr{R}}_{t}$
will be more than twice as high with the present random forcing for a given value of
 $\widetilde{\mathscr{R}}$
.
4.2. Description of the turbulent flow for
$F_{h}=0.66$
,
$\widetilde{\mathscr{R}}_{t}=23$


We first describe the statistically steady state obtained for
 $F_{h}=0.66$
and
 $\widetilde{\mathscr{R}}=10\,000$
, corresponding to a relatively small turbulent horizontal Froude number
 $F_{h}^{t}=0.019$
and to a relatively large turbulent pseudo-buoyancy Reynolds number
 $\widetilde{\mathscr{R}}_{t}=23$
. Figure 11(a,b) display horizontal and vertical cross-sections of the local horizontal and vertical Froude numbers
 $\mathscr{F}_{h}={\it\omega}_{z}/(2N)$
and
 $\mathscr{F}_{v}={\it\omega}_{y}/(2N)$
, respectively. Compared with figure 3, the flow is fully turbulent with small scales nearly everywhere associated with relatively large local Froude numbers. The scaled vertical velocity
 $u_{z}/(UF_{h})$
enables to better see the large scales of the flow (figure 11
c,d). In contrast to the simulations presented in the previous section, the forced dipoles strongly interact together and with the ambient flow. The vertical cross-sections show that the flow is layered with large deformations of the isopycnals and abundant density inversions. We can see that several layers are simulated so that the flow is almost not confined in the vertical direction by the box size.
The energy budget as a function of the horizontal wavenumber
 ${\it\kappa}_{h}$
is presented in figure 12 for the same run. The cumulative dissipation (dashed line) is negligible for wavenumber
 ${\it\kappa}_{h}\lesssim 10K$
. As a result the flux of total energy is nearly constant
 ${\it\Pi}\simeq 0.9\bar{P}$
from
 ${\it\kappa}_{h}\simeq K$
to
 ${\it\kappa}_{h}\simeq 10K$
. In the forcing range for
 ${\it\kappa}_{h}\lesssim K$
and in the inertial range, the cumulative conversion from kinetic to potential energies
 $\mathscr{C}({\it\kappa}_{h})$
(dash-dotted line) increases monotonically. As for lower buoyancy Reynolds number (figure 9
a),
 $\mathscr{C}({\it\kappa}_{h})$
decreases slightly in the dissipation range indicating a weak conversion back from potential to kinetic energies at the dissipative scales. As a consequence of the local conversion of kinetic to potential energies in the inertial range, the flux of potential energy increases and the flux of kinetic energy decreases. Even at such relatively large
 $\widetilde{\mathscr{R}}_{t}$
, there is a weak flux of kinetic energy in the shear modes. Since it is small (5 % of
 $\bar{P}$
) and not balanced by dissipation, it leads to a very slow growth of the energy of the shear modes.
Energy fluxes going out from a vertical cylinder
 ${\it\Omega}_{h}$
of radius
 ${\it\kappa}_{h}$
in spectral space and cumulative dissipation inside this cylinder for
 $F_{h}=0.66$
,
 $\widetilde{\mathscr{R}}=10\,000$
(
 $F_{h}^{t}=0.019$
,
 $\widetilde{\mathscr{R}}_{t}=23$
). The representation is the same as in figure 9. The dotted line is the sum
 ${\it\Pi}({\it\kappa}_{h})+{\it\varepsilon}({\it\kappa}_{h})$
.

In figure 13, we have plotted several instantaneous compensated one-dimensional horizontal spectra of potential energy
 $E_{P}(k_{h}){\it\varepsilon}_{\!K}^{-2/3}{k_{h}}^{5/3}({\it\varepsilon}_{\!K}/{\it\varepsilon}_{\!P})$
(light continuous curves), kinetic energy
 $E_{K}(k_{h}){\it\varepsilon}_{\!K}^{-2/3}{k_{h}}^{5/3}$
(dark continuous curves) and vertical spectrum of kinetic energy
 $E_{K}(k_{z}){\it\varepsilon}_{\!K}^{-2/3}{k_{z}}^{5/3}$
(dashed curves). Due to the unsteadiness of the forcing, the kinetic energy spectrum at the lowest wavenumbers
 ${\it\kappa}_{h}<K$
is never steady but varies in time between 0.6 and 1. For larger wavenumbers, these spectra are close to the
 $C_{1}{{\it\varepsilon}_{\!K}}^{2/3}k_{h}^{-5/3}$
power law with
 $C_{1}=0.5$
(horizontal thick line) as obtained by Lindborg (Reference Lindborg2006), but there is an energy deficit for
 $K<{\it\kappa}_{h}<4K$
and an excess for
 $4K<{\it\kappa}_{h}<30K$
. Between
 ${\it\kappa}_{h}=2K$
and
 ${\it\kappa}_{h}=10K$
, the horizontal kinetic energy spectra are actually slightly shallower than
 $k_{h}^{-5/3}$
and scale approximately as
 $k_{h}^{-4/3}$
(straight dotted dashed line). Horizontal spectra shallower than
 $k_{h}^{-5/3}$
have already been reported for strong stratification and sufficiently large buoyancy Reynolds number (Almalkie & de Bruyn Kops Reference Almalkie and de Bruyn Kops2012; Kimura & Herring Reference Kimura and Herring2012; Bartello & Tobias Reference Bartello and Tobias2013). These shallower spectra could be due to the non-local transfers in Fourier space by the shear instability as already observed by Brethouwer et al. (Reference Brethouwer, Billant, Lindborg and Chomaz2007), Waite (Reference Waite2011) and Augier et al. (Reference Augier, Chomaz and Billant2012). Such rebound cannot be due to a bottleneck effect of the hyperviscosity since this term is negligible in the range
 $K$
to
 $15K$
. The Kolmogorov length scale is nearly resolved (
 $k_{\mathit{max}}{\it\eta}\simeq 0.5$
) so that the hyperviscosity is smaller than the classical dissipation,
 ${\it\varepsilon}_{{\it\nu}_{4}}/{\it\varepsilon}\simeq 0.4$
(table 2). The compensated horizontal potential energy spectra are flatter than the kinetic energy spectra and slightly above the
 $C_{2}{\it\varepsilon}_{\!K}^{2/3}k_{h}^{-5/3}({\it\varepsilon}_{\!P}/{\it\varepsilon}_{\!K})$
law, with
 $C_{2}=0.5$
, found by Lindborg (Reference Lindborg2006) (horizontal thick line).
One-dimensional horizontal and vertical compensated spectra for
 $F_{h}=0.66$
,
 $\widetilde{\mathscr{R}}=10\,000$
(
 $F_{h}^{t}=0.019$
,
 $\widetilde{\mathscr{R}}_{t}=23$
) and for four different times during the statistically steady state with a time interval of two times units. The thin straight line indicates the
 $k_{z}^{-3}$
power law, the dotted dashed line the
 $k_{h}^{-4/3}$
power law and the horizontal thick line the
 $C_{1}{\it\varepsilon}_{\!K}^{2/3}k^{-5/3}$
law for the kinetic energy spectra, with
 $C_{1}=0.5$
and the
 $C_{2}{\it\varepsilon}_{\!K}^{2/3}k^{-5/3}({\it\varepsilon}_{\!P}/{\it\varepsilon}_{\!K})$
law for the potential energy spectra, with
 $C_{2}=0.5$
. The dotted line shows a
 $k^{0}$
power law.

The absence of peak in the potential energy spectra in contrast to the kinetic energy spectra does not seem to be consistent with the hypothesis that the shear instability is responsible for the excess of kinetic energy at small scales. Indeed, one would expect that the associated overturnings should lead also to a peak in the potential energy spectrum. However, the development of the convective instability on the Kelvin–Helmoltz billows could simultaneously decrease this peak. Another tentative explanation could be a difference of the constants of the spectra between the strongly stratified and the weakly stratified ranges. Indeed, one may note that the Kolmogorov constant
 $C_{K}$
for the unidimensional spectra of kinetic energy in homogeneous isotropic turbulence (HIT) is approximately equal to unity (Monin & Yaglom Reference Monin and Yaglom1975; Sreenivasan Reference Sreenivasan1995; Gotoh, Fukayama & Nakano Reference Gotoh, Fukayama and Nakano2002). The departure at large wavenumbers from the Lindborg’s power law could be the sign that for
 $\mathscr{R}_{t}\gg 1$
there is a transition from the strongly stratified constant
 $C_{1}\simeq 0.5$
toward the Kolmogorov constant
 $C_{K}\simeq 1$
. In contrast, the Obukhov–Corrsin constant for the unidimensional spectra of a passive scalar in HIT is around 0.4 (Sreenivasan Reference Sreenivasan1996) and thus closer to the strongly stratified constant
 $C_{2}\simeq 0.5$
for the horizontal spectra of potential energy (Lindborg Reference Lindborg2006).
The vertical kinetic energy spectra (dashed curves) follow a
 ${k_{z}}^{0}$
white noise spectrum at small wavenumbers (figure 13). This means that there is no correlation between the different velocity fields for these large vertical separations. This proves that the height of the computational domain is sufficiently large compared with the largest characteristic vertical length scale which is of the order of the buoyancy length scale
 $L_{b}$
. At vertical wavenumbers around
 $7K$
, the vertical spectra are very steep with nearly a
 $k_{z}^{-3}$
power law. At larger wavenumbers, the vertical spectra approach the horizontal ones and tend to a
 $k_{z}^{-5/3}$
power law. This indicates the beginning of the return to isotropy.
In figure 14, potential (light continuous line), kinetic (dark continuous line) toroidal (dashed line) and poloidal (dash-dotted line) horizontal compensated two-dimensional spectra are presented. As for the one-dimensional spectra, both kinetic and potential spectra seem to be slightly higher than the constant
 $C_{2D}=0.66$
(horizontal line) corresponding to the law reported by Lindborg & Brethouwer (Reference Lindborg and Brethouwer2007) for strongly stratified turbulence. The large horizontal scales are dominated by the toroidal component (dashed line) while at smaller horizontal scales, the toroidal and poloidal spectra nearly collapse on each other.
Compensated horizontal two-dimensional spectra (kinetic, potential, poloidal and toroidal) versus
 ${\it\kappa}_{h}=|\boldsymbol{k}_{h}|$
same as figure 8 but for
 $F_{h}=0.66$
,
 $\widetilde{\mathscr{R}}=10\,000$
(
 $F_{h}^{t}=0.019$
,
 $\widetilde{\mathscr{R}}_{t}=23$
). The black horizontal line corresponds to the constant
 $C_{2D}=0.66$
(Lindborg & Brethouwer Reference Lindborg and Brethouwer2007).

4.3. Effects of the Froude number
We now compare simulations for different Froude numbers
 $F_{h}=0.29$
, 0.5, 0.66 and 0.85 keeping a high pseudo-buoyancy Reynolds number. Figure 15 displays the compensated transverse
 $S_{2T}{\it\varepsilon}_{\!K}^{-2/3}r_{h}^{-2/3}$
and longitudinal
 $S_{2L}{\it\varepsilon}_{\!K}^{-2/3}r_{h}^{-2/3}$
structure functions for these four simulations. In contrast to moderate buoyancy Reynolds number (figure 5
a), the compensated structure functions exhibit for all
 $F_{h}$
, a flat range corresponding to an inertial range. The inset plot shows the effective dimension
 $d_{eff}$
defined in (3.2). After a peak at intermediate scales,
 $d_{eff}$
tends to a value slightly larger than 3 for all horizontal Froude number indicating a nearly complete return to isotropy (
 $d_{eff}=3$
corresponds to three-dimensional HIT).
Compensated transverse (continuous lines) and longitudinal (dashed lines) horizontal second order structure functions for different values of
 $F_{h}$
and
 $\widetilde{\mathscr{R}}_{t}$
. Same as figure 5(a) but for the random forcing and larger
 $\widetilde{\mathscr{R}}_{t}$
. The inset plot shows the effective dimension
 $d_{eff}(r_{h})$
as a function of the horizontal increment
 $r_{h}$
scaled by
 $R$
. The dotted horizontal lines correspond to
 $d_{eff}=2$
and
 $d_{eff}=3$
corresponding to HIT in two and in three dimensions, respectively.

Figure 16 presents horizontal (continuous lines) and vertical (dashed lines) compensated kinetic spectra
 $E_{K}(k_{h}){{\it\varepsilon}_{\!K}}^{-2/3}{k_{h}}^{5/3}$
and
 $E_{K}(k_{z}){{\it\varepsilon}_{\!K}}^{-2/3}{k_{z}}^{5/3}$
, respectively, as a function of the wavenumbers scaled by the buoyancy wavenumber
 $k_{b}=N/U_{h}$
, where
 $U_{h}=\langle (u_{x}^{2}+u_{y}^{2})/2\rangle ^{1/2}$
is the square root of the horizontal kinetic energy. All of the Froude numbers present a relatively flat compensated horizontal spectra corresponding to a
 $k_{h}^{-5/3}$
inertial range. Except for
 $F_{h}=0.29$
for which the pseudo-buoyancy Reynolds number is too low, the horizontal spectra collapse approximately on the horizontal thick line marking the
 $E_{K}(k_{h})=C_{1}{{\it\varepsilon}_{\!K}}^{2/3}k_{h}^{-5/3}$
spectrum, with
 $C_{1}=0.5$
. As for
 $F_{h}=0.66$
(figure 13), there is however a depletion at relatively large horizontal scales and a bump at horizontal wavenumbers slightly larger than
 $k_{b}$
for each Froude number
 $F_{h}$
. The
 $k_{h}^{-4/3}$
power law seems quite robust to variations of the Froude number at least when the pseudo-buoyancy Reynolds number is not too small. Interestingly, the structure functions plotted in figure 15 present much weaker dips and bumps in the inertial range than the horizontal spectra. Almalkie & de Bruyn Kops (Reference Almalkie and de Bruyn Kops2012) and Kimura & Herring (Reference Kimura and Herring2012) also reported differences of scaling between spectra and second-order structure functions but their structure functions are significantly steeper than in figure 15 with slopes between
 $2/3$
and 1.
Horizontal (continuous lines) and vertical (dashed lines) compensated one-dimensional spectra
 $E_{K}(k_{i}){\it\varepsilon}_{\!K}^{-2/3}{k_{i}}^{5/3}$
as a function of the dimensionless wavenumber
 $k_{i}/k_{b}$
for four different values of the Froude number
 $F_{h}=0.29$
, 0.5, 0.66 and 0.85. Same as figure 5(b) but for the random forcing and larger
 $\widetilde{\mathscr{R}}_{t}$
. The thin straight line indicates the
 $k_{z}^{-3}$
power law, the dotted dashed line the
 $k_{h}^{-4/3}$
power law and the horizontal thick line the
 $C_{1}{{\it\varepsilon}_{\!K}}^{~2/3}k^{-5/3}$
law, with
 $C_{1}=0.5$
.

Therefore, except for the simulations with the smallest Froude number
 $F_{h}=0.29$
(
 $\widetilde{\mathscr{R}}_{t}=4.8$
), the horizontal kinetic energy spectra tend to be always slightly higher than the law reported by Lindborg (Reference Lindborg2006) for strongly stratified turbulence.
As already observed for
 $F_{h}=0.66$
, the vertical spectra are very steep near
 $k_{z}=k_{b}$
and show a tendency to follow a
 $k_{z}^{-3}$
slope for all of the Froude numbers (figure 16). However, a transition towards a
 $k_{z}^{-5/3}$
power law is observed only for the two highest pseudo-buoyancy Reynolds number
 $\widetilde{\mathscr{R}}_{t}=23$
and
 $\widetilde{\mathscr{R}}_{t}=32$
(thick lines).
The
 $k_{z}^{-3}$
dependence of the vertical spectra can be better seen in figure 17(a) where the compensated vertical spectra
 $E_{K}(k_{z})N^{-2}{k_{z}}^{3}$
are represented versus
 $k_{z}/k_{b}$
. Plotted in this way, all of the curves collapse for wavenumbers lower than
 $2k_{b}$
. However, the slope around
 $k_{b}$
is closer to
 $-2$
(dashed straight line) than to
 $-3$
(horizontal line). At higher wavenumbers, the spectra evolves rapidly toward the
 $k_{z}^{-5/3}$
power law when
 $k_{z}$
increases all the more than
 $\widetilde{\mathscr{R}}_{t}$
is large (figure 17
a).
Vertical compensated spectra (a)
 $E_{K}(k_{z})N^{-2}{k_{z}}^{3}$
versus
 $k_{z}/k_{b}$
and (b)
 $E_{K}(k_{z}){\it\varepsilon}_{\!K}^{-2/3}{k_{z}}^{5/3}$
versus
 $k_{z}/k_{o}$
. The legend is the same as in figure 16. The thick, thin and dashed straight lines indicate the
 $k_{z}^{-5/3}$
,
 $k_{z}^{-3}$
and
 $k_{z}^{-2}$
power laws, respectively. In (b), the dashed curve corresponds to the composite spectrum (4.2) with
 $C_{N}=0.3$
and
 $C_{K}=1$
.

Decomposition of the vertical compensated spectra for (a)
 $F_{h}=0.66$
(
 $F_{h}^{t}=0.019$
,
 $\widetilde{\mathscr{R}}_{t}=23$
) and (b)
 $F_{h}=0.29$
(
 $F_{h}^{t}=0.0076$
,
 $\widetilde{\mathscr{R}}_{t}=4.8$
). The black thin continuous curves correspond to vertical spectra
 $E_{[K,0<{\it\kappa}_{h}\leqslant 0.4k_{b}]}(k_{z})$
computed with modes for which
 $0<{\it\kappa}_{h}\leqslant 0.4k_{b}$
, the dashed curves to the shear modes vertical spectra
 $E_{[K,{\it\kappa}_{h}=0]}(k_{z})$
and the light curves to spectra
 $E_{[K,{\it\kappa}_{h}>0.4k_{b}]}(k_{z})$
computed with modes for which
 ${\it\kappa}_{h}>0.4k_{b}$
. The continuous vertical lines indicate the conditional wavenumber
 $0.4k_{b}$
and the dotted vertical lines the Ozmidov wavenumber
 $k_{o}$
. The thick and thin straight lines indicate respectively the
 $k_{z}^{-5/3}$
and the
 $k_{z}^{-3}$
power laws.

Augier et al. (Reference Augier, Chomaz and Billant2012) described such mixed-type vertical kinetic spectra with a composite spectrum proposed by Lumley (Reference Lumley1964):
 $$\begin{eqnarray}E_{K}(k_{z})=C_{N}N^{2}k_{z}^{-3}+C_{K}{\it\varepsilon}_{\!K}^{2/3}k_{z}^{-5/3}=(C_{N}(k_{z}/k_{o})^{-4/3}+C_{K}){\it\varepsilon}_{\!K}^{2/3}k_{z}^{-5/3}\end{eqnarray}$$
where
 $k_{o}=(N^{3}/{\it\varepsilon}_{\!K})^{1/2}$
is the Ozmidov wavenumber. According to (4.2), the transition between the
 $k_{z}^{-3}$
and
 ${k_{z}}^{-5/3}$
power laws should occur approximately at the Ozmidov wavenumber. To check this, the compensated vertical spectra
 $E_{K}(k_{z}){\it\varepsilon}_{\!K}^{-2/3}{k_{z}}^{5/3}$
are plotted as a function of
 $k_{z}/k_{o}$
in figure 17(b). Apart from the Froude number
 $F_{h}=0.29$
, all of the curves collapse over a large range of vertical wavenumbers including the Ozmidov wavenumber. Furthermore, the spectrum (4.2) with
 $C_{N}=0.3$
(dashed line) describes remarkably well the observed spectra except near the dissipative range. We stress that
 $C_{N}$
is the only adjustable parameter because
 ${\it\varepsilon}_{\!K}$
is measured and
 $C_{K}=1$
is an universal constant.
To summarize, the vertical spectra tend to present a
 $k_{z}^{-2}$
scaling law at relatively large wavelengths, a
 $N^{2}{k_{z}}^{-3}$
scaling law for a narrow intermediate wavelength range between the buoyancy length scale and the Ozmidov length scale and a
 ${k_{z}}^{-5/3^{\vphantom{1}}}$
scaling law at smaller wavelengths. Interestingly, these characteristic features are also observed in spectra computed from oceanic and atmospheric measurements (see e.g. Garrett & Munk Reference Garrett and Munk1979; Gargett et al.
Reference Gargett, Hendricks, Sanford, Osborn and Williams1981; Dewan & Good Reference Dewan and Good1986; Dewan Reference Dewan1997; Alisse & Sidi Reference Alisse and Sidi2000; Waite & Bartello Reference Waite and Bartello2006; Riley & Lindborg Reference Riley and Lindborg2008).
Compensated horizontal buoyancy flux spectrum
 $|C({\it\kappa}_{h}){{\it\kappa}_{h}}^{5/3}|$
as a function of the horizontal wavenumber
 ${\it\kappa}_{h}$
compensated by
 $K$
in (a),
 $k_{b}$
in (b),
 $k_{o}$
in (c) and
 $1/{\it\eta}$
in (d). The lines are solid when
 $C({\it\kappa}_{h})$
is positive and dashed when it is negative. The legend is the same as in figure 16.

Figure 18 further presents a decomposition of the vertical kinetic spectra for
 $F_{h}=0.66$
(figure 18
a) and for
 $F_{h}=0.3$
(figure 18
b). The black thin curves correspond to conditional vertical spectra
 $E_{[K,0<{\it\kappa}_{h}\leqslant 0.4k_{b}]}(k_{z})$
computed with modes for which
 $0<{\it\kappa}_{h}\leqslant 0.4k_{b}$
, i.e. associated with the large horizontal scales. These conditional vertical spectra are very steep and constitute the major part of the
 $N^{2}k_{z}^{-3}$
spectra. The dashed curves correspond to the conditional vertical spectrum of the shear modes
 $E_{[K,{\it\kappa}_{h}=0]}(k_{z})$
. Remarkably, the shear-mode spectrum dominates the total vertical spectrum for vertical wavenumbers lower than
 $k_{b}$
and decrease abruptly for
 $k_{z}>k_{b}$
. The light thin curves correspond to conditional spectra
 $E_{[K,{\it\kappa}_{h}>0.4k_{b}]}(k_{z})$
computed with modes for which
 ${\it\kappa}_{h}>0.4k_{b}$
, i.e. associated with relatively small horizontal scales. We see that these conditional compensated vertical spectra are negligible for
 $k_{z}\lesssim k_{b}$
and then nearly flat from
 $k_{z}/k_{b}\simeq 2{-}3$
down to the dissipative range, corresponding to a
 $k_{z}^{-5/3}$
power law. This suggests that these range of horizontal wavenumbers is dominated by nearly isotropic structures such as Kelvin–Helmholtz billows. In the case of the transition to turbulence of a dipole in a strongly stratified fluid, Augier et al. (Reference Augier, Chomaz and Billant2012) have also found that the overturnings due to the shear instability scale as the buoyancy scale, are nearly isotropic and lead to a turbulence with a
 $k_{z}^{-5/3}$
kinetic energy spectrum for
 $k_{z}>k_{b}$
. This feature is hidden in the non-decomposed vertical kinetic energy spectra at the large vertical scales between the buoyancy length scale and the Ozmidov length scale because of the dominance of the very steep
 $k_{z}^{-3}$
spectrum associated with the large horizontal scales.
Finally, figure 19 displays the compensated two-dimensional cospectra
 $C({\it\kappa}_{h}){{\it\kappa}_{h}}^{5/3}$
, where
 $C({\it\kappa}_{h})=\text{d}\mathscr{C}({\it\kappa}_{h})/\text{d}{\it\kappa}_{h}$
. This quantity measures the local conversion from kinetic to potential energy. The curves are solid when
 $C({\it\kappa}_{h})$
is positive and dashed otherwise. Various scalings for the horizontal wavenumber
 ${\it\kappa}_{h}$
are tested: it is scaled by
 $K$
in (a),
 $k_{b}$
in (b),
 $k_{o}$
in (c) and
 $1/{\it\eta}$
in (d). At low wavenumber around
 $K$
(figure 19
a),
 $C({\it\kappa}_{h}){{\it\kappa}_{h}}^{5/3}$
is lower than 0.1 for all Froude numbers. At a larger wavenumber,
 $C({\it\kappa}_{h}){{\it\kappa}_{h}}^{5/3}$
suddenly increases toward a much larger value of order 0.5. This sharp increase can be due in particular to the shear instability which generates strong overturnings. In a range of wavenumbers, the cospectra then approximately follow a
 ${\it\kappa}_{h}^{-5/3}$
power law before again decreasing abruptly. Then, they reach negative values at small scales (dashed lines) and finally vanish at the largest wavenumbers. Such negative
 $C({\it\kappa}_{h})$
corresponding to conversion from potential to kinetic energies, i.e. to fluid parcels going back to their equilibrium position, has been already reported and described as restratification (Holloway Reference Holloway1988; Staquet & Godeferd Reference Staquet and Godeferd1998; Brethouwer et al.
Reference Brethouwer, Billant, Lindborg and Chomaz2007).
In order to understand the underlying mechanisms driving such features, it is interesting to study at which scales they occur. We see that the first sharp increase at large scales perfectly collapse when
 ${\it\kappa}_{h}$
is scaled by the buoyancy wavenumber
 $k_{b}$
(figure 19
b) whereas no such good collapse is observed for the three other scalings tested. This strongly suggests that, in contrast to the classical interpretation of the Ozmidov length scale (Lesieur Reference Lesieur1997; Riley & Lindborg Reference Riley and Lindborg2008), the largest horizontal scale that can overturn is not the Ozmidov length scale but the buoyancy length scale as reported recently by Waite (Reference Waite2011) and Augier et al. (Reference Augier, Chomaz and Billant2012).
This result is not in contradiction with a transition for the vertical spectra at the Ozmidov length scale as explained above and shown in figure 18. From figure 19, it is difficult to decide at which scale the abrupt decrease of the cospectrum
 $C({\it\kappa}_{h})$
occurs but it seems to happen for wave numbers slightly larger than the Ozmidov wavenumber although it does not scale perfectly with
 $k_{o}$
(figure 19
c). As seen in figure 19(d), the final decrease of
 $|C({\it\kappa}_{h})|$
toward zero collapse relatively well with the Kolmogorov length scale.
5. Summary and conclusions
We have presented a numerical study of forced strongly stratified turbulence. The simulations differ from previous simulations of forced stratified turbulence since the forcing consists in vertically invariant columnar vortex pairs generated intermittently, as in the experiments of Augier et al. (Reference Augier, Billant, Negretti and Chomaz2014). A wide range of horizontal Froude number
 $F_{h}$
and buoyancy Reynolds number
 $\mathscr{R}=Re{F_{h}}^{2}$
, or equivalently
 $\mathscr{R}_{t}={\it\varepsilon}_{\!K}/({\it\nu}N^{2})$
, have been investigated, from moderate stratification to strong stratification and from moderate values of the buoyancy Reynolds number of the order of those achieved in the experiments to relatively high values that can be reached only by means of high-resolution numerical simulations.
For moderate buoyancy Reynolds number and with a forcing very similar to the experimental one consisting of static dipole generators placed at the periphery of the computational domain, the simulations are able to recover the experimental results of Augier et al. (Reference Augier, Billant, Negretti and Chomaz2014). We observe a rapid three-dimensionalization of the flows leading to statistically stationary disordered flows exhibiting thin horizontal layers associated to relatively strong vertical gradients. Remarkably, when the buoyancy Reynolds number is increased from the lowest value of the buoyancy Reynolds number investigated in the experiments
 $\mathscr{R}=90$
(
 $\mathscr{R}_{t}=0.1$
, with
 $F_{h}=0.85$
) to the largest value
 $\mathscr{R}=330$
(
 $\mathscr{R}_{t}=0.3$
, with
 $F_{h}=0.85$
), there is a transition from quasi-horizontal flows with low local vertical Froude number and smooth large structures strongly affected by viscous effects to turbulent-like flows with local vertical Froude number of order unity, small-scale structures superimposed on the large-scale horizontal layers and abundant overturning events. When the buoyancy Reynolds number is further increased to
 $\mathscr{R}\simeq 2000$
(
 $\mathscr{R}_{t}\simeq 1.5$
), this transition is amplified with increasingly small scales and overturnings. This value of the buoyancy Reynolds number is much larger than those achieved in the experiments (Augier et al.
Reference Augier, Billant, Negretti and Chomaz2014) but is still comparable with what could be obtained in large-scale experiments since the buoyancy Reynolds number
 $\mathscr{R}=\mathit{Re}{F_{h}}^{2}={\it\Omega}^{3}a^{2}/({\it\nu}N^{2})$
varies like
 $a^{2}$
if the maximum angular velocity of the vortices
 ${\it\Omega}$
and the Brunt–Väisälä frequency
 $N$
are kept constant. Therefore, it would be sufficient to generate vortices with a radius
 $a$
only three times larger than in the experiments of Augier et al. (Reference Augier, Billant, Negretti and Chomaz2014). The horizontal second-order structure functions only exhibit a strong increase at small scales, but even for
 $\mathscr{R}=2000$
no clear
 $r_{h}^{2/3}$
dependence is observed as one would expect for an inertial range. Nevertheless, such inertial range seems to be present since the horizontal kinetic energy spectra exhibit a
 $k_{h}^{-5/3}$
power law as soon as
 $\mathscr{R}\geqslant 1000$
(
 $\mathscr{R}_{t}\geqslant 0.8$
). These differences may come from the spatial inhomogeneity of the flow. These results support and extend the experimental study (Augier et al.
Reference Augier, Billant, Negretti and Chomaz2014) where the first signs of the transition from the viscosity affected stratified regime (Godoy-Diana et al.
Reference Godoy-Diana, Chomaz and Billant2004) to the strongly stratified turbulent regime (Brethouwer et al.
Reference Brethouwer, Billant, Lindborg and Chomaz2007) were observed.
In order to produce a less inhomogeneous turbulence, high-resolution simulations have been carried on with a slightly different forcing in which a single dipole is forced periodically at a random location in the computational domain. In this way, the forced vortices strongly interact with the ambient flow and together so that the flow is horizontally homogeneous in the statistically stationary regime. The Kolmogorov length scale is only nearly resolved in these simulations and an isotropic hyperdissipation is added to the classical dissipation. The Reynolds numbers are denoted with a tilde since they should be considered as pseudo-Reynolds numbers. The range of horizontal Froude number investigated is
 $0.3\leqslant F_{h}\leqslant 0.85$
(corresponding to
 $0.008\leqslant F_{h}^{t}\leqslant 0.02$
) and the range of pseudo-buoyancy Reynolds number is
 $5\leqslant \widetilde{\mathscr{R}}_{t}\leqslant 32$
(corresponding to
 $2300\leqslant \widetilde{\mathscr{R}}\leqslant 15\,000$
). For these simulations, the second-order structure functions exhibit a
 ${r_{h}}^{2/3}$
inertial range. The horizontal spectra are in good agreement with previous numerical results (Lindborg Reference Lindborg2006; Brethouwer et al.
Reference Brethouwer, Billant, Lindborg and Chomaz2007; Lindborg & Brethouwer Reference Lindborg and Brethouwer2007) with horizontal unidimensional spectra of kinetic energy and potential energy scaling like
 $C_{1}{\it\varepsilon}_{\!K}^{2/3}k_{h}^{-5/3}$
and
 $C_{2}{\it\varepsilon}_{\!K}^{2/3}k_{h}^{-5/3}({\it\varepsilon}_{\!P}/{\it\varepsilon}_{\!K})$
respectively, with
 $C_{1}=C_{2}\simeq 0.5$
and with horizontal toroidal (vortical) and poloidal spectra nearly collapsing in the inertial range. As shown by Lindborg & Brethouwer (Reference Lindborg and Brethouwer2007), this equipartition does not mean that half of the flow is composed of waves but only reflects the value of order unity of the vertical Froude number in the flow.
By forcing columnar dipoles in spatial space in numerical simulations, we have been therefore able to reproduce both the experimental results at moderate buoyancy Reynolds numbers and the previous numerical results on strongly stratified turbulence at large buoyancy Reynolds numbers forced in spectral space. This validates the numerical implementation of this new method of forcing and shows that the characteristics of strongly stratified turbulence are robust since they can be obtained with different forcing techniques.
Like Brethouwer et al. (Reference Brethouwer, Billant, Lindborg and Chomaz2007) and Waite (Reference Waite2011), we have observed a depletion in the horizontal kinetic energy spectrum for scales between the integral length scale and the buoyancy length scale and an anomalous energy excess around the buoyancy length scale probably due to direct transfers resulting from the shear instability. However, the horizontal potential energy spectra are closer to the Lindborg’s spectra and do not exhibit an energy excess around the buoyancy length scale as one would expect if overturnings were responsible for these anomalies. We have tentatively conjectured that this behaviour of the one-dimensional kinetic energy spectrum might come from the difference between the Kolmogorov constant
 $C_{K}\simeq 1$
for HIT and the Lindborg constant
 $C_{1}\simeq 0.5$
for strongly stratified turbulence. In contrast, there is almost no difference between the Obukhov–Corrsin constant for the unidimensional spectra of a passive scalar in HIT and the Lindborg constant
 $C_{2}\simeq 0.5$
for the horizontal potential energy spectra in strongly stratified turbulence. Some simulations with higher resolutions would be needed to test this conjecture. Such transition could be also present in atmospheric and oceanic spectra but it does not seem to be observed.
Remarkably, the vertical spectra tend to present a
 $k_{z}^{-2}$
scaling law at relatively large wavelengths, a
 $N^{2}{k_{z}}^{-3}$
scaling law for a narrow intermediate wavelength range between the buoyancy length scale and the Ozmidov length scale and an inertial
 $C_{K}{\it\varepsilon}_{\!K}^{2/3}k_{z}^{-5/3}$
spectrum, with
 $C_{K}=1$
at scales smaller than the Ozmidov length scale. Note that the
 $k_{z}^{-2}$
and
 $N^{2}{k_{z}}^{-3}$
scaling laws in the oceans and the atmosphere are usually interpreted as the effects of internal waves (see e.g. Garrett & Munk Reference Garrett and Munk1979; Gargett et al.
Reference Gargett, Hendricks, Sanford, Osborn and Williams1981; Dewan & Good Reference Dewan and Good1986; Dewan Reference Dewan1997; Alisse & Sidi Reference Alisse and Sidi2000; Waite & Bartello Reference Waite and Bartello2006). It is therefore very interesting to see that high-resolution simulations of strongly stratified turbulence can reproduce these scalings and the inertial scaling at large wavenumbers. Following Augier et al. (Reference Augier, Chomaz and Billant2012), we have shown that the vertical kinetic energy spectrum is very well modelled by a composite spectrum summing the strongly stratified and inertial spectra. Using vertical spectra conditioned on the value of the horizontal wavenumber, we have further shown that the
 $N^{2}k_{z}^{-3}$
spectrum is dominated by the contribution of the large horizontal scales with
 $0<{\it\kappa}_{h}\leqslant 0.4k_{b}$
whereas the
 $C_{K}{\it\varepsilon}_{\!K}^{2/3}k_{z}^{-5/3}$
spectrum correspond to the small horizontal scales
 ${\it\kappa}_{h}>0.4k_{b}$
.
An abrupt increase of the horizontal buoyancy flux cospectrum at the buoyancy scale has been interpreted as a signature of the shear instability. This indicates also that the size of the largest overturnings scales with the buoyancy length scale and not like the Ozmidov length scale in contrast to what has been proposed previously (Lesieur Reference Lesieur1997; Riley & Lindborg Reference Riley and Lindborg2008).
From these results and Waite (Reference Waite2011), we can envision a new interpretation of the different regimes in strongly stratified turbulence. In the classical representation (see e.g. Lindborg Reference Lindborg2006; Brethouwer et al.
Reference Brethouwer, Billant, Lindborg and Chomaz2007; Riley & Lindborg Reference Riley and Lindborg2008), the turbulence in strongly stratified fluids is divided in two different regimes with a transition at the Ozmidov length scale. At scales larger than the Ozmidov length scale, the energy cascades via a strongly anisotropic cascade with
 $l_{v}\simeq l_{b}(l_{h})\simeq u(l_{h})/N$
at each scale
 $l_{h}$
. All along this cascade, the horizontal Froude number
 $F_{h}(l_{h})$
remains low and it is only at the Ozmidov length scale that overturnings can occur since the Froude number is then of order unity
 $F_{h}(l_{o})\sim 1$
.
However, the present results and the recent study of Waite (Reference Waite2011) highlight the physical importance of the buoyancy length scale
 $L_{b}$
. This has been also recently pointed out for the turbulent evolution of a dipole (Augier et al.
Reference Augier, Chomaz and Billant2012). In order to interpret the regimes in strongly stratified turbulence, we need to distinguish three different scale ranges (Waite Reference Waite2011). From the large integral scale to the buoyancy scale
 $L_{b}$
, the energy cascades mainly via the strongly stratified hydrostatic cascade with
 $F_{h}(l_{h})\ll 1$
, whereas at scales smaller than the Ozmidov length scale, the turbulence becomes nearly isotropic as described above.
Between the buoyancy length scale
 $L_{b}$
and the Ozmidov length scale, the strongly stratified hydrostatic cascade associated to horizontal Froude number
 $$\begin{eqnarray}F_{h}(l_{h})=u(l_{h})/(Nl_{h})=(l_{o}/l_{h})^{2/3}\end{eqnarray}$$
lower than one seems to coexist with another type of stratified turbulence associated to overturnings with
 $F_{h}\sim F_{v}\sim 1$
. These nearly isotropic overturning structures are directly generated from the destabilization of the large anisotropic scales of the strongly stratified cascade via non-local transfers in spectral space driven by instabilities of the layers such as the shear and the gravitational instabilities. This explains why their velocity can be high enough to be associated to
 $F_{h}\sim F_{v}\sim 1$
. Therefore, this intermediate range consists of a mixture of balanced strongly stratified turbulence as described by Lindborg (Reference Lindborg2006) and unbalanced billows. This intermediate range excited through non-local interactions directly with the largest scales implies that there is a sink of energy on the large-scale range and not only a strongly stratified cascade.
Acknowledgements
We wish to thank F. Moisy and E. Lindborg for helpful discussions. This work was supported by the OLA (Oceanic LAyering) ANR Project (ANR2011 Blanc SIMI 5-6 012-02).
Appendix A. Inhibition of shear modes
Here, we present a simulation in which the shear modes are suppressed numerically and compare it with the same simulation but with shear modes. The forcing and the numerical methods are the same as in § 4. The horizontal Froude number and the pseudo-Reynolds number are equal to
 $F_{h}=0.66$
and
 $\widetilde{\mathit{Re}}=10\,000$
, leading to a pseudo-turbulent buoyancy Reynolds number
 $\widetilde{\mathscr{R}}_{t}\simeq 12$
high enough to reach the strongly stratified turbulent regime. Figure 20 presents the time evolution of the kinetic energy (figure 20
a,b) and the total dissipation rate (figure 20
c,d) for both simulations. The energy of the shear modes (dashed lines) increases after
 $t\simeq 60$
from zero up to a value of the order of one-quarter of the total energy. This ratio is consistent with previous numerical studies of forced strongly stratified turbulence (Smith & Waleffe Reference Smith and Waleffe2002; Waite & Bartello Reference Waite and Bartello2004; Lindborg Reference Lindborg2006; Brethouwer et al.
Reference Brethouwer, Billant, Lindborg and Chomaz2007). At the same time, the energy in the vertically invariant modes,
 $E_{2D}$
, decreases rapidly (light lines in figure 20
a,b). Remarkably, this decrease is much slower and less regular in the simulation without shear modes (figure 20
b). The kinetic energy is also larger around
 $t=125$
when the shear modes are absent. However, the levels of kinetic energy reached after
 $t=250$
during the statistically stationary regime are approximately equal for both simulations. It seems that there are larger variations and slightly higher values of the two-dimensional energy in the simulation without shear modes than in the one with shear mode. Another difference between the two simulations concerns
 $\tilde{P}(t)$
the injection rate averaged over one injection period
 ${\rm\Delta}t=5$
, which varies much more in the simulation without shear modes than in the other one. This could be due to a difference of structure between the two flows with fewer layers and more columnar structures when the shear modes are absent.
Temporal evolution of energy (a,b) and dissipation rate (c,d) for
 $F_{h}=0.66$
and
 $\widetilde{\mathit{Re}}=10\,000$
(
 $F_{h}^{t}\simeq 0.02$
,
 $\widetilde{\mathscr{R}}_{t}\simeq 12$
). (b,d) correspond to a simulation in which the shear modes have been inhibited and (a,c) to the same simulation with shear modes. Here
 $E_{2D}$
is the energy in the two-dimensional modes (with
 $k_{z}=0$
) and
 $E_{SM}$
is the energy in the shear modes (with
 $k_{x}=k_{y}=0$
). The staircase curve shows
 $\breve{P}(t)$
the injection rate averaged over one injection sequence of one dipoles (see figure 2).

Horizontal (continuous lines) and vertical (dashed lines) compensated one-dimensional spectra of kinetic energy
 $E_{K}(k_{i}){\it\varepsilon}_{\!K}^{-2/3}{k_{i}}^{5/3}$
as a function of the scaled wavenumber
 $k_{i}/k_{b}$
, where
 $k_{i}$
denotes either the horizontal wavenumber
 $k_{h}$
or the vertical wavenumber
 $k_{z}$
. Black lines correspond to a simulation with shear modes and light lines to a simulation without shear mode.

In figure 21, the horizontal compensated unidimensional spectra of kinetic energy
 $E_{K}(k_{h}){\it\varepsilon}_{\!K}^{-2/3}{k_{h}}^{5/3}$
are plotted as a function of the horizontal wavenumber
 $k_{h}$
scaled by the buoyancy wavenumber
 $k_{b}$
for both simulations with (black lines) and without (light lines) shear modes. The vertical compensated spectra
 $E_{K}(k_{z}){\it\varepsilon}_{\!K}^{-2/3}{k_{z}}^{5/3}$
are also shown with dashed lines. The horizontal spectra are similar but there is more energy at the large horizontal scales in the simulation without shear mode. This lead to a different shape with weaker anomalies at intermediate scales and at the buoyancy scale compared with the simulation with shear modes. The compensated spectrum for the simulation without shear modes is also slightly higher than 0.5. The vertical compensated spectra differ mainly by the presence of two peaks in the simulation with shear modes: a large one at
 $k_{z}\simeq 0.7k_{b}$
and a much smaller one at
 $k_{z}\simeq 1.5k_{b}$
, i.e. at a wavenumber corresponding approximately to the first harmonic of the first peak. The first large peak should be related to the shear modes. The spectrum for the simulation without shear modes is slightly higher at the lowest vertical wavenumbers.
Figure 22 presents a decomposition of the vertical kinetic spectra as done in figure 18. As already mentioned, for the simulation with shear modes, the conditional vertical spectra
 $E_{[K,0<{\it\kappa}_{h}\leqslant 0.4k_{b}]}(k_{z})$
associated to the large horizontal scales:
 $0<{\it\kappa}_{h}\leqslant 0.4k_{b}$
(thin black continuous line), is approximately equal to the conditional vertical spectrum of the shear modes
 $E_{[K,{\it\kappa}_{h}=0]}(k_{z})$
(dotted line). The conditional vertical spectra
 $E_{[K,0<{\it\kappa}_{h}\leqslant 0.4k_{b}]}(k_{z})$
is higher at wavenumber
 $k_{z}<0.5k_{b}$
for the simulation without shear modes leading to a total vertical spectra of the same order in both simulations. The second peak at
 $k_{z}\simeq 1.5k_{b}$
in the total vertical spectra appears in the conditional vertical spectra
 $E_{[K,0<{\it\kappa}_{h}\leqslant 0.4k_{b}]}(k_{z})$
meaning that it corresponds to relatively large horizontal scales. The spectra
 $E_{[K,{\it\kappa}_{h}>0.4k_{b}]}(k_{z})$
corresponding to small horizontal length scales are almost similar except that it is slightly higher for the simulation without shear modes than for the other.
Decomposition of the vertical compensated spectra. Black lines correspond to a simulation with shear modes and light lines to a simulation without shear mode. The continuous thick curves correspond to the total vertical spectra, the continuous thin curves to vertical spectra
 $E_{[K,0<{\it\kappa}_{h}\leqslant 0.4k_{b}]}(k_{z})$
computed with modes for which
 $0<{\it\kappa}_{h}\leqslant 0.4k_{b}$
, the dotted curve to the shear-mode vertical spectra
 $E_{[K,{\it\kappa}_{h}=0]}(k_{z})$
and the dashed curves to spectra
 $E_{[K,{\it\kappa}_{h}>0.4k_{b}]}(k_{z})$
computed with modes for which
 ${\it\kappa}_{h}>0.4k_{b}$
. The thin straight line indicates the
 $k_{z}^{-3}$
power law.

To conclude, the shear modes represent a non-negligible part of the total energy and seems to play an important role in the dynamics but essential features of turbulence are the same with or without shear modes. Further investigations are needed to better understand this issue.
Appendix B. Comparison between direct and hyperviscous simulations
In this appendix, we compare the largest DNS of § 3 (for which
 $N_{h}=1600$
and
 $N_{z}=320$
) with a simulation with hyperviscosity and coarser resolution (
 $N_{h}=768$
and
 $N_{z}=192$
) for the same forcing and physical parameters (table 3). For this latter smaller simulation, the ratio
 $k_{max}/k_{{\it\eta}}$
is equal to 0.52, i.e. of the same order as for the simulations with hyperviscosity described in § 4.
Same as figure 8 except that the simulation is not a DNS but uses hyperviscosity with a coarser resolution (
 $N_{h}=768$
and
 $N_{z}=192$
).

Same as figure 9(a) except that the simulation is not a DNS but uses hyperviscosity with a coarser resolution (
 $N_{h}=768$
and
 $N_{z}=192$
).

Comparison of the physical and numerical parameters of two simulations with experimental-like dipole generators. The first simulation is the largest DNS of table 1 while the second is a simulation with hyperviscosity and a coarser resolution for the same physical parameters.

Figure 23 displays the compensated horizontal two-dimensional spectra for the simulation with hyperviscosity. Except in the dissipative range, the results are quite similar to those of the DNS (figure 8). In particular, the bump at the buoyancy length scale is clearly present in both figures. This strongly indicates that the similar bumps obtained in the simulations of § 4 are not due to hyperviscosity. Figure 24 shows the spectral energy budget for the simulation with hyperviscosity like in figure 9(a) for the DNS. The two figures are remarkably similar, which once again validates our choice of using hyperviscosity for the simulations of § 4 in order to artificially increase the Reynolds number without increasing the resolution.