Introduction
Neuropogonoid lichens include species of the speciose genus Usnea that are morphologically characterized by a yellow thallus with a patchy or fasciated dark pigmented cortex and generally darkly pigmented apothecial discs. These lichens occur almost exclusively on siliceous rocks and are most common in polar regions (especially the Southern Hemisphere) and high altitudes of temperate and tropical regions. The group was formerly often treated as a separate taxonomic entity, at different levels. However, molecular studies employing ITS sequence data revealed that the group was polyphyletic with a core group nested within Usnea subgen. Usnea (Wirtz et al. Reference Wirtz, Printzen, Sancho and Lumbsch2006). Hence we use the informal name ‘neuropogonoid’ for these Usnea spp. that seem to have adapted to harsh environmental conditions by producing melanoid substances in the thalline cortex and apothecial discs. Subsequent studies on these lichens have focused on species circumscriptions using molecular data (Seymour et al. Reference Seymour, Crittenden, Wirtz, Ovstedal, Dyer and Lumbsch2007; Wirtz et al. Reference Wirtz, Printzen and Lumbsch2008; N. Wirtz, C. Printzen and H. T. Lumbsch, unpublished data) and on clarifying the extrolites present in the species (Elix et al. Reference Elix, Wirtz and Lumbsch2007). However, the phylogenetic relationships among species within the core group of neuropogonoid lichens, as circumscribed in Wirtz et al. (Reference Wirtz, Printzen, Sancho and Lumbsch2006), have not been studied. Therefore, we assembled a complete data set of three genes (including two nuclear ribosomal and one protein-coding loci) of 45 samples representing 14 species (Wirtz et al. Reference Wirtz, Printzen and Lumbsch2008; N. Wirtz, C. Printzen and H. T. Lumbsch, unpublished data) to address the phylogenetic relationships among these taxa.
Material and Methods
Taxon sampling
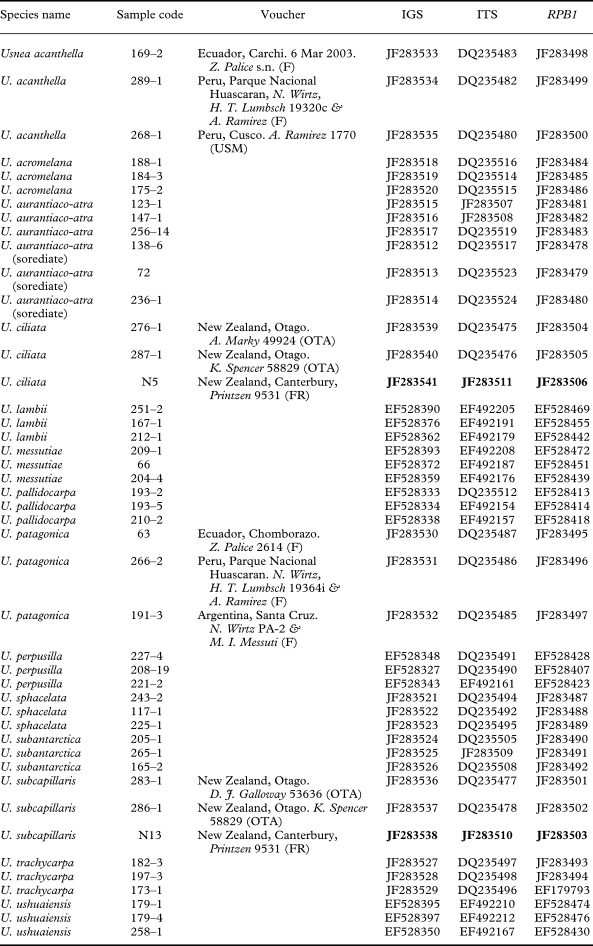
Data matrices of 45 samples, including three samples of U. acanthella that were used as an outgroup following a recent molecular study (Wirtz et al. Reference Wirtz, Printzen, Sancho and Lumbsch2006), were assembled using sequences of nuclear IGS, ITS and nuclear, protein-coding RPB1 sequences. Specimens and sequences used for the phylogenetic analyses are listed in Table 1. The data set mainly includes sequences used in studies previously addressing species delimitation (Wirtz et al. Reference Wirtz, Printzen, Sancho and Lumbsch2006, Reference Wirtz, Printzen and Lumbsch2008; N. Wirtz, C. Printzen and H. T. Lumbsch, unpublished data). Genbank accession numbers of newly obtained sequences are indicated in bold. Laboratory methods to obtain these sequences have been described in the above mentioned references.
Species and specimens used in the present study, with GenBank accession numbers of IGS, ITS and RPB1 sequences used in this study. New sequences in bold.

Chemical analyses
The chemical constituents were identified using high performance thin-layer chromatography with solvent systems A and C (HPTLC) (Arup et al. Reference Arup, Ekman, Lindblom and Mattsson1993), and gradient-elution high performance liquid chromatography (HPLC) (Feige et al. Reference Feige, Lumbsch, Huneck and Elix1993).
Sequence alignments and phylogenetic analysis
Alignments were made using Clustal W (Thompson et al. Reference Thompson, Higgins and Gibson1994). Ambiguously aligned regions were removed manually. The alignments were analyzed by maximum likelihood (ML) and a Bayesian approach (B/MCMC). Maximum likelihood analysis was performed using the program GARLI (Zwickl Reference Zwickl2006), employing the general time reversible model of nucleotide substitution (Rodriguez et al. Reference Rodriguez, Oliver, Marin and Medina1990) including estimation of invariant sites and assuming a discrete gamma distribution with six rate categories. Bootstrapping (Felsenstein Reference Felsenstein1985) was performed based on 2000 replicates. The B/MCMC analysis was conducted using the program MrBayes 3.1.2 (Huelsenbeck & Ronquist Reference Huelsenbeck and Ronquist2001), using the same substitution model as in the ML analysis. A run with 20 M generations starting with a random tree and employing four simultaneous chains was executed. Every 100th tree was saved into a file. The first 500 000 generations (i.e. the first 5000 trees) were deleted as the ‘burn in’ of the chain. We used AWTY (Nylander et al. Reference Nylander, Wilgenbusch, Warren and Swofford2007) to compare split frequencies in the different runs and to plot cumulative split frequencies to ensure that stationarity was reached. Of the remaining 390 000 trees (1925 000 from each of the parallel runs), a majority rule consensus tree with average branch lengths was calculated using the sumt option of MrBayes. Posterior probabilities were obtained for each clade. Only clades that received bootstrap support equal or above 70% under ML and posterior probabilities ≥ 0·95 were considered as strongly supported. Phylogenetic trees were visualized using Treeview (Page Reference Page1996).
Results and Discussion
A matrix of 1650 unambiguously aligned nucleotide position characters was produced; 1403 characters in the alignment were constant. ML analysis yielded a maximum likelihood tree that did not contradict the Bayesian tree topology. In the B/MCMC analysis of the combined data set, the likelihood parameters in the sample had the following mean (variance): LnL = −4584·318 (0·86), while the likelihood of the ML tree was –4582·382.
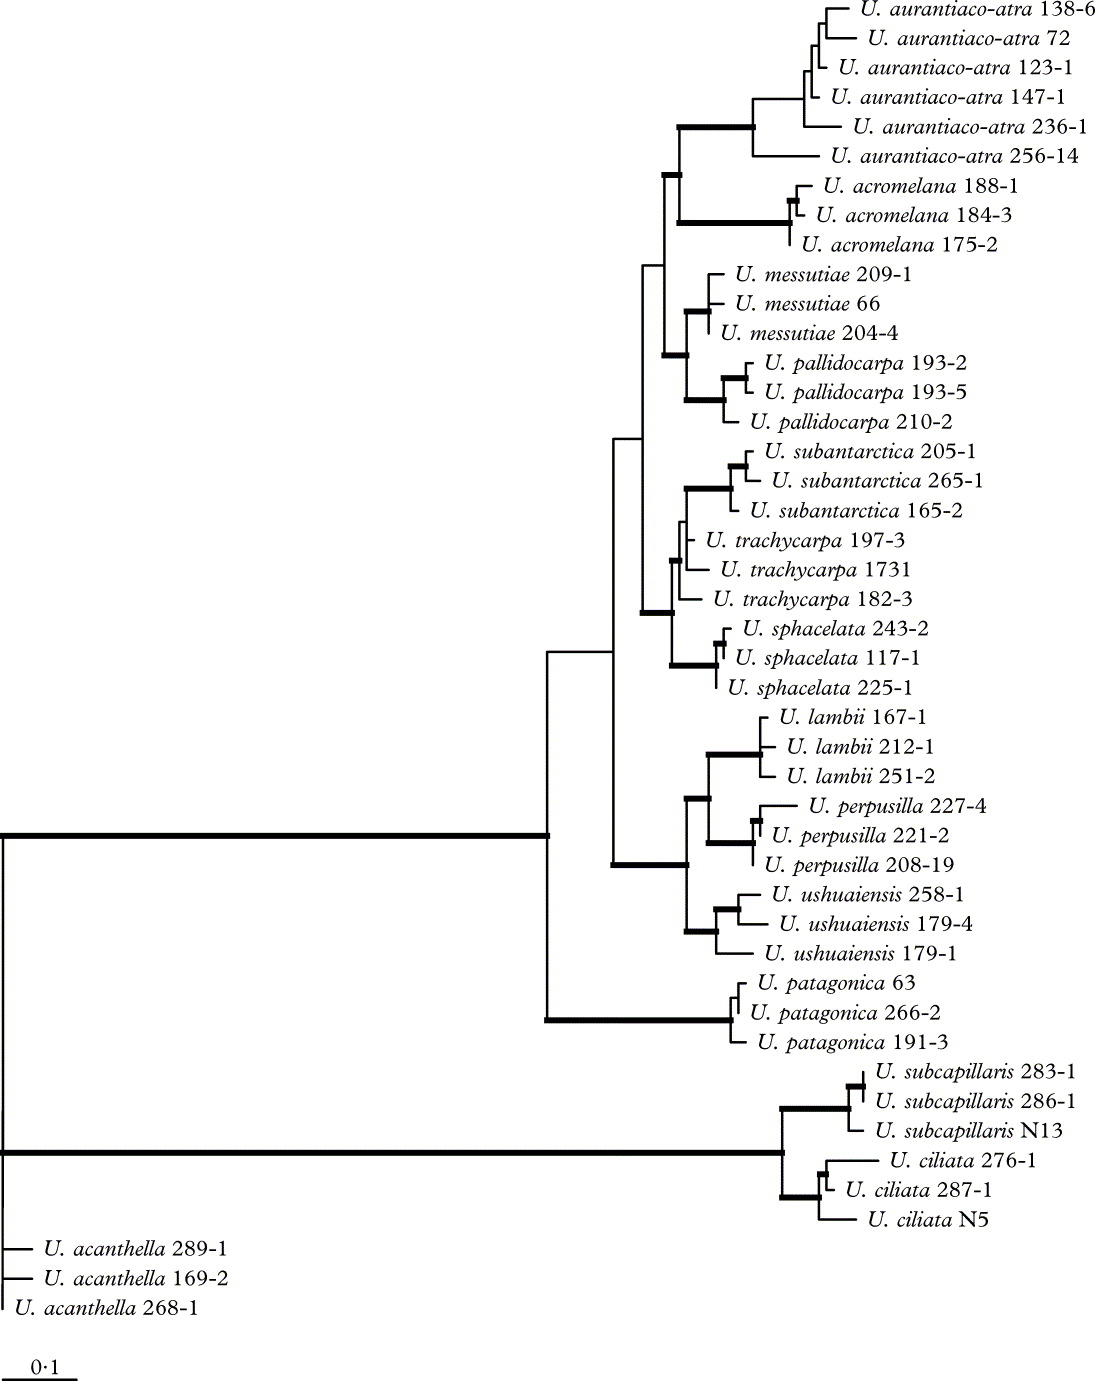
Since the topologies of the ML and B/MCMC analyses did not show any strongly supported conflicts, only the tree of the ML analysis is shown (Fig. 1). All species in the circumscriptions based on recent network-based studies (Wirtz et al. Reference Wirtz, Printzen and Lumbsch2008) form strongly supported monophyletic groups, with the exception of U. trachycarpa, which is paraphyletic with a monophyletic U. subantarctica nested within it. The latter is consistent with N. Wirtz, C. Printzen and H. T. Lumbsch (unpublished data) who discussed that the distinction of these two species requires additional studies. The two species, Usnea ciliata and U. subcapillaris, form a strongly supported lineage separate from the remaining species of the neuropogonoid core group. The remaining eleven species form a strongly supported monophyletic group. The backbone of the topology within this group lacks support. However, relationships of groups of two to three species each receive statistical support. Usnea aurantiaco-atra (incl. U. antarctica) is sister to U. acromelana with strong support, as shown previously (Wirtz et al. Reference Wirtz, Printzen, Sancho and Lumbsch2006). Usnea pallidocarpa and the new species U. messutiae, which is formally described below, form a strongly supported monophyletic group. The latter was referred to previously as Usnea sp. 2 and U. pallidocarpa as U. sp. 1 (Wirtz et al. Reference Wirtz, Printzen and Lumbsch2008). Usnea pallidocarpa was recently described (Lumbsch et al. Reference Lumbsch, Ahti, Altermann, Amo, Aptroot, Arup, Barcenas Peña, Bawingan, Benatti and Betancourt2011). The bipolar Usnea sphacelata is sister to U. subantarctica and U. trachycarpa. Another bipolar species is U. lambii, which has a strongly supported sister-group relationship to U. perpusilla, and these two taxa form a sister clade to U. ushuaiensis. Usnea patagonica is the earliest deviating lineage in the group, agreeing with previous results (Wirtz et al. Reference Wirtz, Printzen, Sancho and Lumbsch2006) but in both studies this phylogenetic placement lacks support.
Phylogenetic relationships of the neuropogonoid core group in Usnea as inferred from a concatenated alignment of nuclear ribosomal IGS and ITS DNA, and RPB1 sequences. This is the optimal tree under maximum likelihood. Branches in bold received likelihood bootstrap support values above 70% and posterior probabilities equal to or above 0·95.
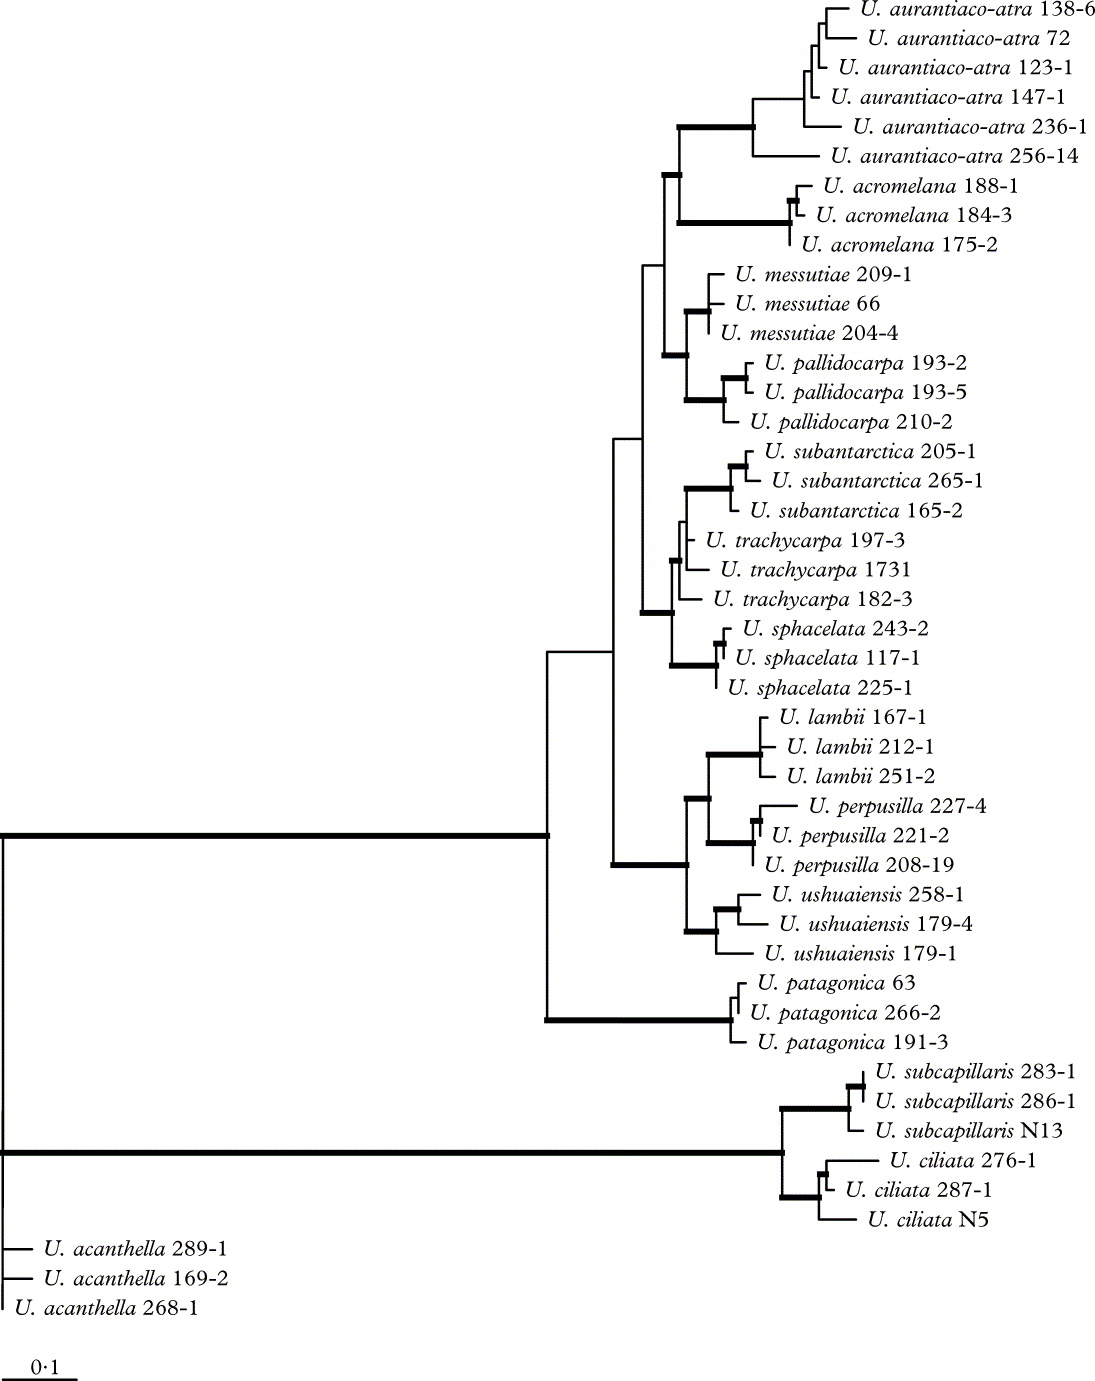
This study and previous analyses (Wirtz et al. Reference Wirtz, Printzen, Sancho and Lumbsch2006, Reference Wirtz, Printzen and Lumbsch2008; Seymour et al. Reference Seymour, Crittenden, Wirtz, Ovstedal, Dyer and Lumbsch2007) show that the diversity of neuropogonoid lichens has been underestimated by a morphology-based species concept and this is in agreement with studies in other groups of lichenized fungi (Crespo & Pérez-Ortega Reference Crespo and Pérez-Ortega2009; Crespo & Lumbsch Reference Crespo and Lumbsch2010). Our three-gene data set did not allow us to resolve the backbone of the phylogeny within the main group of neuropogonoid lichens. This is probably due to the low amount of variable characters in our data set (c. 85% of the characters in the alignment are constant). Currently, a major challenge of DNA sequence-based approaches to species delimitation and phylogeny of groups of closely related species is the lack of fungal specific primers for fast-evolving loci. Recently, primers for two protein-coding genes have been published (Schmitt et al. Reference Schmitt, Crespo, Divakar, Fankhauser, Herman-Sackett, Nelsen, Nelson, Rivas Plata, Shimp, Widhelm and Lumbsch2009) with great potential to resolve phylogenetic relationships. It has been demonstrated that they outperformed other commonly used loci at higher phylogenetic levels (Aguileta et al. Reference Aguileta, Marthey, Chiapello, Lebrun, Rodolphe, Fournier, Gendrault-Jacquemard and Giraud2008), but there are no data at hand to determine if these genes allow more robust phylogenetic estimates for closely related taxa.
Although phylogenetic analyses strongly suggest that dark pigmentation of cortex and/or apothecial discs has evolved several times independently in the genus Usnea, there has not been any study to test whether this character state can be reversed, and there is also no clear picture on how often the pigmentation has evolved. These issues need to be addressed using a much larger taxon sampling, including more species groups of non-neuropogonoid species of Usnea.
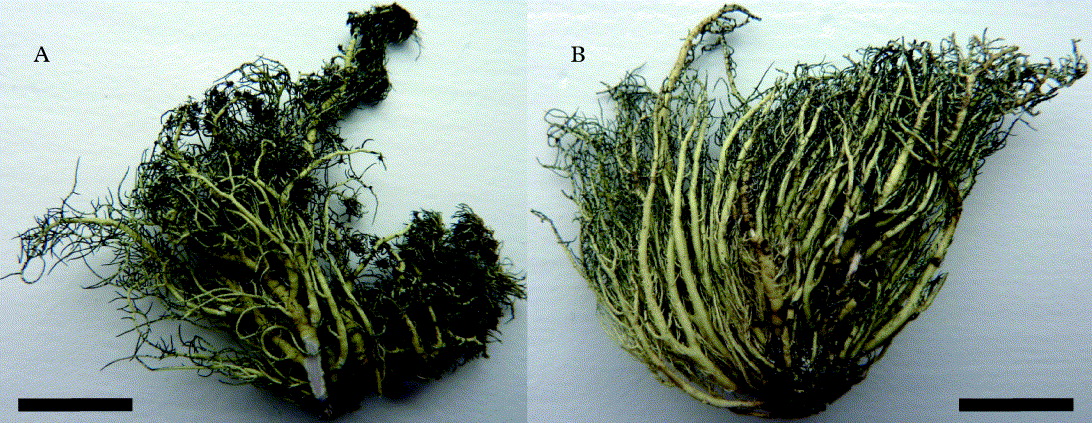
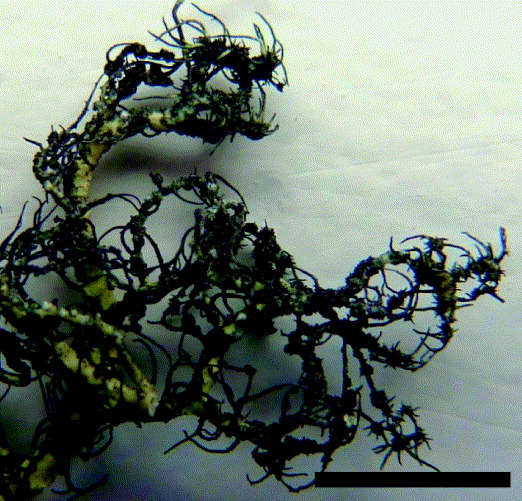
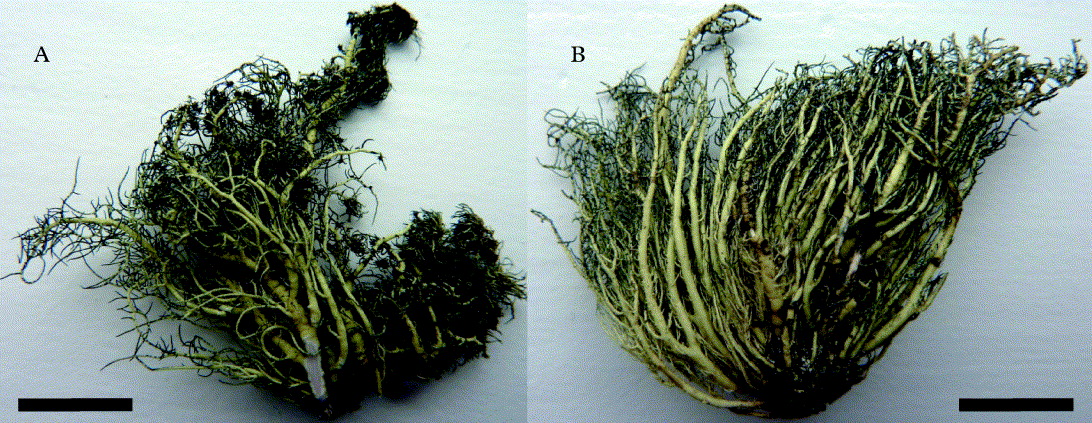
The results of our phylogenetic analyses require two nomenclatural changes; the combination of Neuropogon lambii into Usnea (the reference to “Usnea lambii Imshaug” in Elix et al. Reference Elix, Wirtz and Lumbsch2007 was erroneous) and the description of U. messutiae as a new species (Fig. 2), both of which are proposed below.
Taxonomy
Usnea lambii (Imshaug) Wirtz & Lumbsch comb. nov
MycoBank no.: MB 561368
Basionym: Neuropogon lambii Imshaug, Rhodora 61: 154 (1954).
Usnea messutiae Wirtz & Lumbsch sp. nov
MycoBank no.: MB 561369
A Usnea pallidocarpa soralis punctiformis continentes et apotheciis destitis differt.
Typus: Argentina, Santa Cruz, c. 30km N of El Chalten, N of National Park ‘Los Glaciares’, Cerro Creston, above Laguna del Desierto, below Glaciar Huemul, c. 800 m alt, 9 December 2003, N. Wirtz & M. I. Messuti PA-1 (F—holotypus).
Usnea messutiae, habit (holotype, F). A & B, thalli. Scales: A & B = 1 cm. In colour online.
Usnea messutiae, soralia and isidiomorphs (holotype, F). Scale 0·5 cm. In colour online.
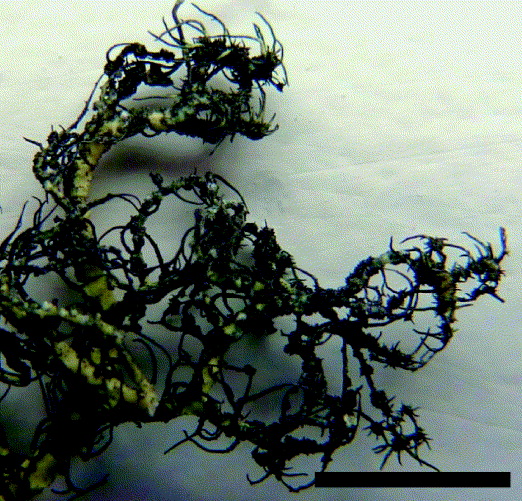
Thallus approx. 3–4 cm tall, arising from a proliferating, mostly unpigmented holdfast with main branches tapered towards the holdfast; erect, shrubby and richly branched with terete branches and usually one stronger ramifying main branch, sometimes eventually bifurcating at the tip; thallus surface yellow-green, foveolate, rarely smooth; main branches unpigmented, side branches unpigmented or sparsely variegated with bands of black pigment or entirely black towards the tips. Cortex annulations common, sometimes pigmented. Papillae rare; unpigmented and black pigmented fibrils common. Medulla dense. Axis thick, (35)–47–(60)% of branch diam. Soralia punctiform, hemispherical, convex, fusing, mostly on tips of side branches and developing from fibril scars. Isidiomorphs frequent, mainly blackish, sometimes growing into fibril-like structures, developing within soralia.
Apothecia not seen.
Pycnidia not seen.
Chemistry. ±Hypostrepsilic acid chemosyndrome (Elix et al. Reference Elix, Wirtz and Lumbsch2007), ±unidentified substance, and usnic acid.
Etymology. The epithet honours our friend and colleague, the Argentinean lichenologist Maria Ines Messuti (Bariloche).
Distribution and habitat. Known from a few localities in the Andean Cordillera in southern South America (Argentina) and Ecuador. It is an alpine species found on rocks at higher altitudes about 800 m in southern South America in communities with U. aurantiaco-atra, U. acromelana, U. subantarctica, U. trachycarpa and U. sphacelata and at high altitudes of about 5000 m in Ecuador in a community with U. sphacelata.
Usnea messutiae (referred to as U. sp. 2 in Wirtz et al. Reference Wirtz, Printzen and Lumbsch2008) is characterized by a mostly unpigmented dense thallus with pigmented tips, fibrils, soralia and isidiomorphs. Its thallus surface is rough. Soredia are mostly convex and frequently growing into isidiomorphs and longer fibril-like structures. The new species is similar to U. subantarctica, but is distinguished by a more dense growth form, almost no papillae, a dense medulla and thick axis. It is also similar to U. acromelana because of pigmented thallus annulations, dark soralia and a thick axis, but distinguished by a rough, ornamented thallus surface with faveoles and an unpigmented, proliferating holdfast.
Additional specimens examined. Argentina: Rio Negro: Cerro Catedral, 1850 m alt., N. Wirtz & M .I. Messuti PA-24 (F).—Ecuador: Chimborazo, volcano, alt. 4900 m, Z. Palice & Soldán 4291 (F); Chimborazo, alt. 4600 m, Z. Palice 2614 (F).
This study was financially supported by a grant from the German Science Foundation (DFG) to HTL and a DAAD scholarship to NW. We are grateful to Maria Ines Messuti (Bariloche), who organized a field trip through Patagonia to Tierra del Fuego, and to Christian Printzen (Frankfurt) for collecting lichen samples in New Zealand for this project.