



1. Introduction
In various industrial processes such as manufacturing and aviation, it is inevitable that small, hot particles are produced. Such hot particles are also known as mechanical sparks since they usually glow because of the exceedingly high temperature (Hawksworth et al. Reference Hawksworth, Rogers, Proust, Beyer and Schenk2005; Beyer & Markus Reference Beyer and Markus2012). The nature of the high temperature makes the mechanical spark an efficient ignition source. When a mechanical spark enters a flammable environment, the possibility of unwanted explosion due to ignition on the particle surface is substantially promoted (Eckhoff & Thomassen Reference Eckhoff and Thomassen1994; Hawksworth et al. Reference Hawksworth, Rogers, Proust, Beyer and Schenk2005; Proust et al. Reference Proust, Hawksworth, Rogers, Beyer and Lakic2007). Such accidental ignition and explosion can lead to tremendous damage and hazards. Besides, hot particle induced ignition is one of the important pathways to wildland and urban spot fires (Wang et al. Reference Wang, Huang, Chen and Liu2016; Urban Reference Urban2017; Urban et al. Reference Urban, Zak, Song and Fernandez-Pello2017). Therefore, an in-depth understanding of the underlying physics behind hot particle induced ignition is of crucial importance for industrial and fire safety.
The ignition of a combustible mixture by a mechanical spark takes place close to the hot surface (Law Reference Law2010). Such an ignition process is essentially inhomogeneous since there is large temperature gradient around the hot particle. Stamatov, King & Zhang (Reference Stamatov, King and Zhang2005) conducted experiments on the ignition of quiescent CH4/air mixtures caused by a laser-heated particle. They showed that the ignition delay time depends on the equivalence ratio and has a minimum value for a stoichiometric mixture. Beyer & Markus (Reference Beyer and Markus2012) investigated the ignition capability of inert particles in a static explosive mixture. Their experiments and simulations showed that reducing the particle size promotes the critical ignition temperature. Roth et al. (Reference Roth, Sharma, Haeber, Schiessl, Bockhorn and Maas2014) considered the thermal ignition of a quiescent H2/air mixture by a small hot particle whose diameter was in the range from 0.3 to 0.8 mm. Their experiments showed that the critical ignition temperature strongly depends on the material of the hot particle. However, such a phenomenon can hardly be reproduced in numerical simulation. It was hypothesized that the surface reaction, i.e. quenching and catalysis, might contribute to the large difference in the critical ignition temperatures corresponding to different materials. Roth, Häber & Bockhorn (Reference Roth, Häber and Bockhorn2017) examined the ignition process of different fuel/air mixtures by a silicon nitride particle. They found that the critical ignition temperature varies widely among different fuels and increases consistently as the equivalence ratio approaches the ignition limit. Wang & Chen (Reference Wang and Chen2020) conducted transient one-dimensional simulations on the ignition of CH4/air and H2/air mixtures by an inert hot particle, and found that the ignition delay time strongly depends on the particle size. Besides, Wang et al. (Reference Wang, Zhang, Zirwes, Zhang, Bockhorn and Chen2021) found that the low-temperature chemistry plays an important role in hot particle induced ignition.
In general, the creation of mechanical sparks by means of mechanical action at the solid surface is associated with a non-vanishing momentum of the hot particle. Therefore, in most situations, the hot particle moves relative to the explosive mixture, leading to convective heat transfer around the particle surface in addition to pure heat conduction under quiescent conditions. Coronel et al. (Reference Coronel2016, Reference Coronel, Melguizo-Gavilanes, Mével and Shepherd2018) used a novel experimental set-up in observing the ignition of n-hexane/air mixture by a moving hot particle. Implementing a shear interferometer, they visualized the ignition kernel formation and the subsequent flame propagation. Melguizo-Gavilanes et al. (Reference Melguizo-Gavilanes, Nové-Josserand, Coronel, Mével and Shepherd2016, Reference Melguizo-Gavilanes, Coronel, Mével and Shepherd2017a,Reference Melguizo-Gavilanes, Mével, Coronel and Shepherdb) conducted a series of two-dimensional simulations on ignition induced by a hot particle falling into a combustible mixture. They observed that the boundary layer development and flow separation have crucial impacts on the ignition process, which is consistent with the experimental results of Mével et al. (Reference Mével, Niedzielska, Melguizo-Gavilanes, Coronel and Shepherd2016, Reference Mével, Melguizo-Gavilanes, Boeck and Shepherd2019). Usually, ignition occurs between the front stagnation point and the location of flow separation, and the ignition position moves downstream as the particle temperature decreases. In particular, ignition first takes place adjacent to the separation point when the particle temperature is close to the threshold value. Zirwes et al. (Reference Zirwes, Zhang, Häber and Bockhorn2019) revisited the ignition of a combustible mixture by a moving hot particle based on both two-dimensional (2-D) and 3-D simulations. An in-depth understanding was obtained concerning the dependence of the critical ignition temperature on the relative velocity, ranging from creeping flow to flow with unsteady vortex shedding. They showed that a 2-D simulation assuming axisymmetric flow agrees well with a 3-D simulation in predicting the critical ignition temperature for relatively small velocities. However, the deviation becomes noticeable at higher flow velocities due to the 3-D unsteady vortices appearing behind the hot particle.
Ignition of a combustible mixture by a hot particle can be considered as the particular situation of ignition by a hot surface (Law Reference Law2010). Concerning thermal ignition of methane/air mixtures by a hot surface, Laurendeau (Reference Laurendeau1982) developed a simple scaling correlation among particle temperature, size, pressure and flow velocity, using van't Hoff's ignition criterion. However, the temperature inhomogeneity was not fully considered in his work. The temperature inhomogeneity is represented by its gradient adjacent to the particle surface, whose magnitude is dominated by the local curvature. Law (Reference Law1978a,Reference Lawb, Reference Law1979) conducted a large activation energy asymptotic analysis for hot particle induced ignition in a quiescent reactive mixture and obtained the ignition criterion in terms of a reduced Damköhler number, which interpreted the thermal energy balance between heat release from chemical reaction and heat loss due to conduction in steady state. Su & Sirignano (Reference Su and Sirignano1981) revisited the same problem and in their asymptotic analysis, the second-order correction terms were retained for both temperature and mass fraction of the reactive species. Compared with a transient calculation (Su, Homan & Sirignano Reference Su, Homan and Sirignano1979), the second-order solution provided an improved ignition criterion. Based on the consideration that the ignition process was minimally affected by the geometry of the body, Law (Reference Law1979) analysed the transient ignition of a combustible exposed to hot isothermal bodies. The flow field adjacent to the surface was shown to be diffusive–reactive in nature and satisfied local similarity, which enables the derivation of an explicit expression for the ignition delay time, denoted by  ${\tau _{ig}}$. However, at moderate to large Reynolds numbers, the flow separates at the rear hemisphere of the particle, and moreover the flow field before separation does not satisfy self-similarity. Consequently, the explicit analytical description of the velocity profile becomes unavailable (Johnson & Patel Reference Johnson and Patel1999; Schlichting & Gersten Reference Schlichting and Gersten2016). This imposes further difficulty in analytically solving temperature inhomogeneity at the particle surface due to convection (Riley Reference Riley1986; Paterson & Hayhurst Reference Paterson and Hayhurst2000).
Ignition is essentially a transient process involving multiple time scales. Ignition is characterized by the appearance of sustained combustion, where the rate of heat release due to chemical reaction is balanced by the rate of heat loss. For ignition by a hot particle with constant temperature in a quiescent mixture, the heat loss can be solely attributed to the temperature inhomogeneity at the particle surface. The critical ignition condition defines the largest rate of heat loss that can support combustion in the limit situation of steady state, i.e.  ${\tau _{ig}} \to \infty $, and accordingly, the critical ignition temperature can be derived.
The relative motion between the hot particle and the combustible mixture introduces additional transient effects during the ignition process. On the one hand, the enhanced heat transfer resulting from both conduction and convection on the particle surface may shorten the cooling time (denoted by  ${\tau _{pc}}$) of the hot particle (Leal Reference Leal2007). On the other hand, ignition takes place at some distance from the hot surface, implying that the fluid parcel where ignition first occurs has a finite residence time (denoted by
 ${\tau _{res}}$) adjacent to the hot particle (Melguizo-Gavilanes et al. Reference Melguizo-Gavilanes, Nové-Josserand, Coronel, Mével and Shepherd2016, Reference Melguizo-Gavilanes, Coronel, Mével and Shepherd2017a; Mével et al. Reference Mével, Niedzielska, Melguizo-Gavilanes, Coronel and Shepherd2016). The time scales
 ${\tau _{pc}}$ and
 ${\tau _{res}}$ introduce transient effects to the ignition process. Under such situations, the critical ignition condition is revised to the equality of the ignition delay time and the characteristic time of the corresponding unsteady process, e.g.
 ${\tau _{ig}} = {\tau _{pc}}$ or
 ${\tau _{ig}} = {\tau _{res}}$. In comparison with steady state situations, we hypothesize that the finiteness of
 ${\tau _{pc}}$ and
 ${\tau _{res}}$ may increase the critical ignition temperature. Coronel (Reference Coronel2016) proposed a simplified ignition model in which the relevant time scales were discussed in the scaling sense. However, quantitative comparison among these time scales was not conducted.
Based on the above-mentioned considerations, this work aims to develop a theoretical model for the ignition of a combustible mixture by a hot spherical particle. The present model can quantitatively interpret the role of temperature inhomogeneity and various transient effects on ignition behaviour and provide the dependence of the critical ignition temperature on relevant parameters in explicit form, which is so far not in place. The remaining parts of this paper proceed as follows. In § 2, Semenov's transient ignition criterion is revised by introducing a hypothetical volumetric heat loss to account for the temperature inhomogeneity, and accordingly, the ignition delay time can be evaluated analytically. In § 3, an in-depth discussion is presented on the effect of temperature inhomogeneity, resulting from both conductive and convective heat transfer, on the hot particle induced ignition process. An explicit formula for the critical ignition temperature, interpreting its dependence upon various affecting parameters, is derived. In § 4, the transient effect due to particle cooling is discussed. The particle cooling time is determined by solving the thermal energy equation of the solid particle and is compared with the  ${\tau _{ig}}$ obtained in § 2. In § 5, the transient effect due to the motion of the ignition fluid parcel is taken into account, and its contribution to the change of critical ignition temperature is assessed. The general conclusions are given in § 6.
2. The inhomogeneous ignition criterion
Discharging a hot particle into a combustible mixture can lead to ignition. According to thermal ignition theory, ignition is most likely to take place first on the particle surface, where the temperature is highest. In addition to thermal runaway, ignition is also controlled by complicated chemical reaction pathways. The active radicals, e.g. H and OH, can be destroyed due to collision with the particle surface (Glassman, Yetter & Glumac Reference Glassman, Yetter and Glumac2014). Therefore, the fluid parcel, where ignition occurs first, should be slightly elevated from the solid surface such that its temperature is almost identical to that of the particle and meanwhile the accumulation of radicals exceeds termination. This fact was found in previous simulations by Melguizo-Gavilanes et al. (Reference Melguizo-Gavilanes, Mével, Coronel and Shepherd2017b).
The hot particle continuously transfers thermal energy into the relatively cool ambient gas, leading to large temperature gradient in the vicinity of the particle surface. Pertaining to such inhomogeneous ignition process, Law (Reference Law1978a) analysed the hot particle induced ignition in the absence of relative motion between the particle and the environmental gas, and the temperature of the particle was assumed constant. The diffusive–reactive nature of the ignition process was analysed via large activation energy asymptotics. Adopting a simplified one-order Arrhenius-type model, the chemical reaction rate is
 \begin{equation}\omega = B{c_{F0}}\ {\rm exp} ( - {T_a}/{T_s}),\end{equation}
where B represents the reaction frequency factor,  ${T_a}$ the activation temperature,
 ${T_s}$ the particle temperature and
 ${c_{F0}}$ the fuel concentration in the mixture. The balance of heat release from chemical reaction and the heat loss due to temperature inhomogeneity gives the critical ignition condition, which is indicated by the following reduced Damköhler number (Law Reference Law2010)
 \begin{equation}{\varDelta _I} = \frac{{2R_0^2B{\rho _g}{c_{pg}}({T_{ad}} - {T_\infty })\ {\rm exp} ( - {T_a}/{T_s})}}{{{\lambda _g}{T_a}{{(1 - {T_\infty }/{T_s})}^2}(\textrm{d}\theta /\textrm{d}\tilde{r})_{\tilde{r} = 1}^2}} \ge 1,\end{equation}
where  ${\lambda _g}$,
 ${\rho _g}$ and
 ${c_{pg}}$ are respectively the thermal conductivity, density and the heat capacity of the combustible gaseous mixture,
 ${R_0}$ is the radius of the spherical particle,
 ${T_{ad}}$ is the adiabatic flame temperature,
 ${T_\infty }$ is the temperature of combustible mixture and
 $\theta = (T - {T_\infty })/({T_s} - {T_\infty })$ is the normalized temperature. The normalized radial coordinate is defined by
 $\tilde{r} = r/{R_0}$. The term
 ${(\textrm{d}\theta /\textrm{d}\tilde{r})_{\tilde{r} = 1}}$ denotes the non-dimensional temperature gradient on the particle surface, and it depends on the geometry of the particle. For a spherical particle in a quiescent frozen mixture, we have
 ${(\textrm{d}\theta /\textrm{d}\tilde{r})_{\tilde{r} = 1}} ={-} 1$, which will be shown in § 3.1.
The modified Damköhler number, given by (2.2), is a general formula that interprets the ignition of a quiescent combustible mixture close to the hot surface of a spherical particle of constant and uniform temperature. To derive (2.2) from first principles, the non-dimensional temperature is defined as  $\tilde{T} = {c_p}T/{q_c}$, where
 ${q_c}$ is the heat release from a unit mass of reactant mixture. According to the energy conservation law and the definition of the adiabatic flame temperature
 ${T_{ad}}$, we have
 ${c_p}({T_{ad}} - {T_\infty }) = {q_c}$, which is substituted into the non-dimensional temperature and results in the appearance of
 ${T_{ad}}$ in the modified Damköhler number.
The condition of  ${\varDelta _I} = 1$ gives the critical ignition temperature of the particle,
 ${T_{cr}}$, below which ignition fails since the heat generation from chemical reaction cannot compete with the heat loss to the ambient gas.
Fixing the frame of reference at the centre of the spherical particle, the relative motion between particle and combustible mixture can be equivalently regarded as the uniform flow of the environmental gas. Such relative motion between the combustible mixture and the hot particle modifies the ignition behaviour in three aspects. First, the convection accelerates heat transfer from the hot particle to the surrounding mixture and thus intensifies the temperature inhomogeneity at the particle surface. Second, the enhanced heat transfer facilitates the cooling of the hot particle, which leads to a decrease of the particle temperature. Last but not least, the fluid parcel where ignition occurs has finite residence time close to the hot particle, after which the fluid parcel cools down as it moves downstream. The steady state ignition criterion (Law Reference Law1978a,Reference Lawb, Reference Law2010) considers rigorously the non-homogeneous temperature profile in a quiescent environment and can predict the ignitability of the reactant gas subject to a hot particle with constant temperature. However, it meets exceeding difficulty in describing the temperature inhomogeneity caused by convective heat transfer because the velocity profiles adjacent to the particle surface may not be obtained in a mathematically explicit form. Consequently, the energy equation for the combustible mixture cannot be converted into the conventional conductive–reactive type, and the derivation route leading to (2.2) becomes inaccessible. Besides, the steady ignition theory is unable to evaluate the ignition delay time. To account for the unsteady effect, an additional term involving temporal evolution of the temperature should be included in the energy equation, which escalates the mathematical complexity in obtaining an analytical solution.
From the perspective of a Lagrangian description of the flow, we may trace the history of the ignition fluid parcel (abbreviated as IFP hereinafter) which ignites first. Since the size of the IFP can be arbitrarily small, we may assume that it has uniform temperature. In addition, appropriate heat loss must be associated with the IFP to account for the inhomogeneity of the temperature profile close to the particle surface. Therefore, we may equivalently regard ignition as a local, non-adiabatic thermal explosion within the IFP. It is recognized that the consumption of reactant species appears to be negligible prior to ignition (Law Reference Law1978a, Reference Law2010). Consequently, the ignition process is solely characterized by the following energy equation for the IFP:
 \begin{equation}{\rho _g}{c_{vg}}\frac{{\textrm{d}{T_I}}}{{\textrm{d}t}} = {q_c}B{c_{F0}}\ {\rm exp} ( - {T_a}/{T_I}) - h({T_I} - {T_\infty }),\end{equation}
where  ${T_I}$ represents the temperature of the IFP,
 ${c_v}$ the heat capacity at constant volume,
 ${q_c}$ the heat release per unit mass of the reactant and h the effective volumetric heat loss coefficient to be determined. Conventionally, the non-dimensional temperature is defined by
 \begin{equation}\tilde{T} = {\rho _g}{c_{vg}}T/{q_c}{c_{F0}},\end{equation}
where  ${c_{vg}}$ is the heat capacity at constant volume and
 ${q_c}$ the heat release per unit mass of reactant. According to energy conservation, we may correlate
 ${q_c}$ with
 ${T_{ad}}$ via
 ${q_c}{c_{F0}} = {\rho _g}{c_{vg}}({T_{ad}} - {T_\infty })$, and consequently, we may alternatively write
 $\tilde{T} = T/({T_{ad}} - {T_\infty })$. The characteristic time for chemical reaction can be defined in terms of the non-dimensional temperature of the particle,
 \begin{equation}{\tau _{ch}} = \frac{{\tilde{T}_s^2\ {\rm exp} ({{\tilde{T}}_a}/{{\tilde{T}}_s})}}{{{{\tilde{T}}_a}B}}.\end{equation}
The heat loss coefficient h can also be written in non-dimensional form,
 \begin{equation}\tilde{h} = \frac{{h{\tau _{ch}}}}{{{\rho _g}{c_{vg}}}} = \frac{{h\tilde{T}_s^2\ {\rm exp} ({{\tilde{T}}_a}/{{\tilde{T}}_s})}}{{{\rho _g}{c_{vg}}{{\tilde{T}}_a}B}}.\end{equation}
In terms of  $\tilde{T}$ and
 $\tilde{h}$, we can write (2.3) in dimensionless form
 \begin{equation}\frac{{\textrm{d}{{\tilde{T}}_I}}}{{\textrm{d}\tilde{t}}} = \frac{{\tilde{T}_s^2}}{{{{\tilde{T}}_a}}}\ {\rm exp} \left[ { - {{\tilde{T}}_a}\left( {\frac{1}{{{{\tilde{T}}_I}}} - \frac{1}{{{{\tilde{T}}_s}}}} \right)} \right] - \tilde{h}({\tilde{T}_I} - {\tilde{T}_\infty }).\end{equation}
Since the IFP is close to the particle surface, we have  ${T_I} \approx {T_s}$. Assuming that
 ${\tilde{T}_a} \gg {\tilde{T}_I}$, we can write an asymptotic series for the latter, i.e.
 \begin{equation}{\tilde{T}_I} = {\tilde{T}_s} + \epsilon \chi ,\end{equation}
where  $\epsilon = \tilde{T}_s^2/{\tilde{T}_a} \ll 1$ is a small parameter, and
 $\chi $ is the first-order perturbation to the non-dimensional temperature of the IFP. Substituting (2.8) into (2.7) and collecting terms of like powers of
 $\epsilon $, we obtain:
The leading-order equation for  ${\tilde{T}_s}$
 \begin{equation}\frac{{\textrm{d}{{\tilde{T}}_s}}}{{\textrm{d}\tilde{t}}} ={-} \tilde{h}({\tilde{T}_s} - {\tilde{T}_\infty }).\end{equation}
The first-order equation for  $\chi $
 \begin{equation}\frac{{\textrm{d}\chi }}{{\textrm{d}\tilde{t}}} = {e^\chi } - \tilde{h}\chi .\end{equation}
The leading-order (2.9) demonstrates that the temperature of the IFP continues to decay due to volumetric heat loss characterized by  $\tilde{h}$. However, the magnitude of the first-order correction to the temperature
 $\chi $, according to (2.10), is also affected by heat release from chemical reaction. For a sufficiently large heat loss coefficient
 $\tilde{h}$, (2.10) suggests that
 $\chi $ approaches a finite value in the limit of
 $\tilde{t} \to \infty $. In association with the decay of
 ${\tilde{T}_s}$ according to (2.9), ignition is prohibited. To achieve successful ignition, the heat loss rate must be bounded from above, which is characterized by the explosive increase of
 $\chi $ in the course of time (Law Reference Law2010). The condition that ensures successful ignition can be determined according to the Semenov ignition criterion as
 \begin{equation}\tilde{h} \le e.\end{equation}
The equality,  $\tilde{h} = e$, holds for the critical ignition condition, which should be equivalent to
 ${\varDelta _I} = 1$ derived by rigorously considering temperature inhomogeneity in the steady state theory. The critical ignition condition defines the reference state, at which the ignition could occur after a sufficiently long time, or the heat release by chemical reaction is balanced by heat transfer to the surroundings during the whole ignition process. Physical plausibility suggests that the heat loss effect could be varied independently from the chemical reaction rate. We solve for the reaction frequency factor B from the condition
 ${\varDelta _I} = 1$ in terms of
 ${(\textrm{d}\theta /\textrm{d}\tilde{r})_{\tilde{r} = 1}}$ using (2.2) and substitute the results into the equivalent ignition condition
 $\tilde{h} = e$, in which
 $\tilde{h}$ is given by (2.6). Consequently we can obtain
 \begin{equation}h = \frac{{e{\lambda _g}T_a^2{{(1 - {T_\infty }/{T_s})}^2}}}{{2\gamma R_0^2T_s^2}}\left( {\frac{{\textrm{d}\theta }}{{\textrm{d}\tilde{r}}}} \right)_{\tilde{r} = 1}^2,\end{equation}
where  $\gamma = {c_{pg}}/{c_{vg}}$ is the heat capacity ratio. With knowledge of h given by (2.12), the non-dimensional effective heat loss coefficient can be determined according to (2.6) as
 \begin{equation}\tilde{h}({T_s}) = \frac{{{\alpha _g}{T_a}{{(1 - {T_\infty }/{T_s})}^2}\ {\rm exp} ({T_a}/{T_s} + 1)}}{{2BR_0^2({T_{ad}} - {T_\infty })}}\left( {\frac{{\textrm{d}\theta }}{{\textrm{d}\tilde{r}}}} \right)_{\tilde{r} = 1}^2,\end{equation}
where  ${\alpha _g} = {\lambda _g}/{\rho _g}{c_{pg}}$ is the thermal diffusivity of the combustible mixture. Equation (2.13) indicates that the effective heat loss coefficient is inversely proportional to the surface area of the particle, i.e.
 $\tilde{h} \sim 1/R_0^2$. This means that ignition becomes more difficult for smaller particles, which is consistent with previous experimental and numerical results. In addition, (2.13) demonstrates that the effective heat loss coefficient varies with the square of the normalized temperature gradient on the particle surface, which substantially increases in the presence of convective heat transfer. Therefore, the relative motion between the hot particle and the combustible mixture may greatly affect the ignition behaviour.
Taking the derivative of  $\tilde{h}$ with respect to
 ${T_s}$, one obtains
 \begin{equation}\frac{{\textrm{d}\tilde{h}}}{{\textrm{d}{T_s}}} ={-} \frac{{{\alpha _g}}}{{2BR_0^2}}\left( {1 - \frac{{{T_\infty }}}{{{T_s}}}} \right)\left[ {1 - \frac{{{T_\infty }}}{{{T_s}}}\left( {1 + 2\frac{{{T_s}}}{{{T_a}}}} \right)} \right]\frac{{T_a^2{e^{{T_a}/{T_s} + 1}}}}{{T_s^2({T_{ad}} - {T_\infty })}}\left( {\frac{{\textrm{d}\theta }}{{\textrm{d}\tilde{r}}}} \right)_{\tilde{r} = 1}^2\; .\end{equation}
The conditions  ${T_s} \gg {T_\infty }$ and
 ${T_s}/{T_a} \ll 1$ suggest that
 $\textrm{d}\tilde{h}/\textrm{d}{T_s} < 0$. Therefore, as the particle temperature falls, the heat loss coefficient becomes larger and thereby heat loss is more pronounced.
The critical ignition temperature, denoted by  ${T_{ig,cr}}$, can be determined by setting
 ${T_s} = {T_{ig,cr}}$ in (2.13) and using the ignition condition of
 $\tilde{h} = e$. After rearrangement, we have the following expression the for the critical ignition temperature:
 \begin{equation}\frac{{{T_a}}}{{{T_{ig,cr}}}} = \ln \frac{{2BR_0^2({T_{ad}} - {T_\infty })}}{{{\alpha _g}{T_a}{{(1 - {T_\infty }/{T_{ig,cr}})}^2}(\textrm{d}\theta /\textrm{d}\tilde{r})_{\tilde{r} = 1}^2}}.\end{equation}
When the particle temperature is greater than the critical ignition temperature, i.e.  ${T_s} > {T_{ig,cr}}$, the ignition delay time can be evaluated by integrating equation (2.10)
 \begin{equation}{\tau _{ig}} = {\tau _{ch}}\int_0^\infty {\frac{{\textrm{d}\chi }}{{{e^\chi } - \tilde{h}({T_s})\chi }}} .\end{equation}
In particular, (2.13) indicates that  $\tilde{h}$ vanishes for
 ${(\textrm{d}\theta /\textrm{d}\tilde{r})_{\tilde{r} = 1}} = 0$, i.e. the particle temperature is equal to that in the ambient. In such circumstances, the integral in (2.16) is equal to unity, indicating that
 ${\tau _{ig}} = {\tau _{ch}}$, i.e. ignition occurs under adiabatic conditions. For finite temperature difference, the magnitude of
 ${(\textrm{d}\theta /\textrm{d}\tilde{r})_{\tilde{r} = 1}}$ describes the temperature inhomogeneity. For a spherical particle in a quiescent mixture, the heat transfer is only through thermal conduction and we have
 ${(\textrm{d}\theta /\textrm{d}\tilde{r})_{\tilde{r} = 1}} ={-} 1$, which will be shown in § 3.1. When there is relative motion between the particle and the environment, the heat transfer consists of convection and conduction and we have
 $|{(\textrm{d}\theta /\textrm{d}\tilde{r})_{\tilde{r} = 1}}|> 1$, which will be discussed in §§ 3.2–3.4.
3. The effect of temperature inhomogeneity on ignition by a hot particle
According to (2.13), the temperature gradient on the particle surface,  ${(\textrm{d}\theta /\textrm{d}\tilde{r})_{\tilde{r} = 1}}$, needs to be obtained so that the effective volumetric heat loss coefficient
 $\tilde{h}$ can be evaluated, and subsequently the critical ignition temperature can be determined via (2.15). We consider a hot particle placed in a combustible mixture with different flow velocities, including the quiescent situation, creeping flow and flow with separation. For each flow condition, solving the thermal energy equation for the gas mixture yields the temperature distributions, by means of which the temperature gradient on the particle surface
 ${(\textrm{d}\theta /\textrm{d}\tilde{r})_{\tilde{r} = 1}}$ can be evaluated. Adopting two assumptions, that the particle temperature remains constant during the ignition process and that the IFP is anchored at the particle surface, the ignition criterion of the combustible mixture by the hot particle can be described by the critical ignition condition in steady state theory, i.e.
 $\tilde{h} = e$, which gives the correlation between the critical ignition temperature and various parameters that affect it, e.g. the radius of the particle, the temperature inhomogeneity and the transport properties of the combustible mixture. The fall of the particle temperature and the motion of the IFP lead to transient effects in the ignition process, and their impacts will be discussed in §§ 4 and 5, respectively.
3.1. Quiescent combustible mixture
First, we consider the hot particle placed in a quiescent combustible mixture so that the heat transfer at the surface is pure conduction. So far, we have assumed that the particle temperature is constant during the ignition process. The solution of the thermal equation for a solid particle presented in § 4 will confirm that the effect of particle cooling is negligible before ignition occurs. For a particle with a constant temperature, we can employ the quasi-steady state assumption to deal with heat transfer at the particle surface. The energy equation for the gas mixture can be written in the form (Leal Reference Leal2007)
 \begin{equation}{\tilde{\nabla }^2}\theta = 0,\end{equation}
where  $\tilde{\nabla } = {R_0}\boldsymbol{\nabla }$ is the non-dimensional gradient operator. The solution of (3.1) satisfying the boundary conditions of
 $\theta = 1$ at
 $\tilde{r} = 1$ and
 $\theta = 0$ as
 $r \to \infty $ is
 \begin{equation}\theta = \frac{1}{{\tilde{r}}}.\end{equation}
Accordingly, the non-dimensional temperature gradient on the particle surface is
 \begin{equation}- {\left( {\frac{{\textrm{d}\theta }}{{\textrm{d}\tilde{r}}}} \right)_{\tilde{r} = 1}} = 1.\end{equation}
3.2. Creeping flow without separation for  ${Re}$ $\ll 1$


In the presence of relative motion between the particle and the ambient gas, convection contributes to additional heat transfer, and the energy equation should be revised to
 \begin{equation}Pe(\tilde{\boldsymbol{u}}\boldsymbol{\cdot }\tilde{{\bf }\boldsymbol{\nabla }{\bf }}\theta ) = {\tilde{\nabla }^2}\theta ,\end{equation}
where the non-dimensional velocity  $\tilde{\boldsymbol{u}}$ is normalized by the uniform flow velocity,
 ${U_\infty }$, of the ambient gas, i.e.
 $\tilde{\boldsymbol{u}} = \boldsymbol{u}/{U_\infty }$. The Péclet number is defined as
 $Pe = {U_\infty }{R_0}/{\alpha _g}$. The Péclet number can equivalently be written as the product of the Reynolds number,
 $Re = {U_\infty }{R_0}/{\nu _g}$, and the Prandtl number,
 $Pr = {\nu _g}/{\alpha _g}$, where
 ${\nu _g}$ is the kinematic viscosity of the ambient gas. The Prandtl number depends only on the fluid properties and is around unity for most gases under atmospheric pressure at room temperature. Consequently, the Péclet number and the Reynolds number are of the same order, i.e.
 $Pe \sim Re$.
The flow field is affected by changing the Reynolds number. For creeping flow with  $Re \ll 1$, i.e. the flow velocity distribution can be described by the Stokes solution (Landau & Lifshitz Reference Landau and Lifshitz1987)
 \begin{equation}{\tilde{u}_r} ={-} \cos \phi \left( {1 - \frac{3}{{2\tilde{r}}} + \frac{1}{{2{{\tilde{r}}^3}}}} \right),\quad {\tilde{u}_\phi } ={-} \sin \phi \left( {1 - \frac{3}{{4\tilde{r}}} - \frac{1}{{4{{\tilde{r}}^3}}}} \right),\end{equation}
where  $\phi $ represents the polar angle and its origin
 $(\phi = 0)$ is selected at the front stagnation point of the sphere, and thereby
 $\phi = {\rm \pi} $ corresponds to the rear stagnation point.
For  $Re \ll 1$ and
 $Pe \sim Re$, the temperature distribution can be expanded in asymptotic series in terms of
 $Pe$. However, separate solutions must be sought respectively in the inner region for
 $1 \le \tilde{r} \le O(P{e^{ - 1}})$, where the heat conduction term is much larger than the convection term, and in the outer region for
 $O(P{e^{ - 1}}) < \tilde{r} < \infty $, where the convection term is of equal importance to the conduction term. The detailed derivation of the asymptotic solution of the temperature distribution can be found in Leal (Reference Leal2007), and here we only briefly present key processes.
In the inner region, the proper length scale is  ${R_0}$, and the asymptotic series for
 $\theta $ in terms of
 $Pe$ is
 \begin{equation}{\theta _{in}} = {\theta _{in, 0}}(\tilde{r},\phi ) + Pe{\theta _{in, 1}}(\tilde{r},\phi ) + O(P{e^2}).\end{equation}
Substituting equation (3.6) into (3.4) and collecting terms of like powers of  $Pe$, one obtains the leading-order solution
 ${\theta _{in, 0}} = 1/\tilde{r}$, and the first-order correction
 ${\theta _{in, 1}}$ which satisfies the following equation
 \begin{equation}{\tilde{\nabla }^2}{\theta _{in,1}} = \tilde{\boldsymbol{u}}\boldsymbol{\cdot }\boldsymbol{\nabla }{\theta _{in,0}}.\end{equation}
The solution of (3.7) subject to the boundary condition of  ${\theta _{in,1}} = 0$ at
 $\tilde{r} = 1$ can be written as
 \begin{equation}{\theta _{in, 1}} = \mathop \sum \limits_{n = 0}^\infty {A_n}[{\tilde{r}^n} - {\tilde{r}^{ - (n + 1)}}]{P_n}( - \eta ) + \left( {\frac{1}{2} - \frac{3}{{4\tilde{r}}} + \frac{3}{{8{{\tilde{r}}^2}}} - \frac{1}{{8{{\tilde{r}}^3}}}} \right){P_1}( - \eta ),\end{equation}
where  ${P_n}$ represents the Legendre polynomial of order n, and
 $\eta = \cos \phi $. The integration constants
 ${A_n}$ should be determined through matching with the asymptotic solution in the outer region. The fact that
 ${P_1}( - \eta )/2$ does not vanish as
 $\tilde{r} \to \infty $ suggests that
 ${\theta _{in,1}}$ does not satisfy the boundary condition at infinity. Therefore, the solution in the outer region needs to be obtained.
In the outer region, the length scale should be redefined because the temperature distribution appears to be less sensitive to the particle radius at remote distance. A suitable rescaling is  $\xi = \tilde{r}Pe$, in terms of which, the leading order of the normalized temperature in the outer region,
 ${\theta _{out}}$, satisfies
 \begin{equation}\tilde{\nabla }_\xi ^2{\theta _{out}} ={-} \left[ {\frac{{\partial {\theta_{out}}}}{{\partial \xi }} + \left( {\frac{{1 - {\eta^2}}}{\xi }} \right)\frac{{\partial {\theta_{out}}}}{{\partial \eta }}} \right].\end{equation}
The right-hand side of the above equation represents the modification of the temperature distribution in the outer region by uniform flow of ambient gas. The solution of (3.9) subject to the boundary condition of  ${\theta _{out}} \to 0$ as
 $\xi \to \infty $ is
 \begin{equation}{\theta _{out}} = \sqrt {\frac{{\rm \pi} }{\chi }} {e^{ - \chi \eta /2}}\mathop \sum \limits_{k = 0}^\infty {B_k}{K_{k + 1/2}}\left( {\frac{\chi }{2}} \right){P_k}( - \eta ),\end{equation}
where the coefficients  ${B_k}$ must be determined by matching with the inner solution
 ${\theta _{in}}$. The functions
 ${K_{k + 1/2}}$ represent the modified Bessel functions of order
 $k + 1/2$. The matching of
 ${\theta _{in}}$ and
 ${\theta _{out}}$ is conducted in an overlap region in which,
 $\tilde{r}$ and
 $\xi $ could be interchangeably selected as the characteristic length scale. From the matching we have
 \begin{gather}{A_0} ={-} {\textstyle{1 \over 2}},\quad {A_k} = 0\quad \textrm{for}\;k \ge 1,\end{gather}
 \begin{gather}{B_0} = \frac{1}{{\rm \pi} },\quad {B_k} = 0\quad \textrm{for}\;k \ge 1.\end{gather}
Substituting equations (3.11) and (3.12) into (3.8) and (3.10) respectively, the inner and outer solutions for the normalized temperature are fully determined. The composite solution valid in the whole domain can be constituted by summarizing  ${\theta _{in}}$ and
 ${\theta _{out}}$ and subtracting their common part in the overlapping region, and it is
 \begin{equation}\theta = \frac{1}{{\tilde{r}}}{e^{ - \tilde{r}Pe(1 + \eta )/2}} + Pe\left[ {\frac{1}{{2\tilde{r}}} - \eta \left( { - \frac{3}{{4\tilde{r}}} + \frac{3}{{8{{\tilde{r}}^2}}} - \frac{1}{{8{{\tilde{r}}^3}}}} \right)} \right].\end{equation}
In contrast to  ${\theta _{in}}$, the composite solution of
 $\theta $ given by (3.13) satisfies the boundary condition
 $\theta \to 0$ as
 $\tilde{r} \to \infty $ at finite
 $Pe$. Subsequently, the negative of the temperature gradient on the particle surface can be obtained as
 \begin{equation}- {\left( {\frac{{\partial \theta }}{{\partial \tilde{r}}}} \right)_{\tilde{r} = 1}} = \frac{1}{2}\left( {1 + \frac{3}{4}\eta } \right)Pe + {e^{ - (1 + \eta )Pe/2}}\left[ {1 + \frac{1}{2}(1 + \eta )Pe} \right].\end{equation}
The heat transfer rate changes with polar angle, represented by  $\eta = \cos \phi $. It takes the largest and smallest values at the front
 $(\eta = 1)$ and rear
 $(\eta ={-} 1)$ stagnation points, respectively, i.e.
 \begin{gather}- {\left( {\frac{{\partial \theta }}{{\partial \tilde{r}}}} \right)_{\tilde{r} = 1, max}} = {e^{ - Pe}}(1 + Pe) + \frac{7}{8}Pe \approx 1 + \frac{7}{8}Pe,\end{gather}
 \begin{gather}- {\left( {\frac{{\partial \theta }}{{\partial \tilde{r}}}} \right)_{\tilde{r} = 1,min}} = 1 + \frac{1}{8}Pe.\end{gather}
The heat transfer on the particle surface plays the role of heat loss during the ignition process. Equations (3.15) and (3.16) indicate that ignition first occurs at the rear stagnation point (i.e.  $\phi = {\rm \pi}$) where the temperature inhomogeneity is the smallest over the particle surface. This is consistent with previous simulation results (Zirwes et al. Reference Zirwes, Zhang, Häber and Bockhorn2019; Wang et al. Reference Wang, Zhang, Zirwes, Zhang, Bockhorn and Chen2021).
3.3. Boundary layer flow with separation for Re $\gg 1$

At high Reynolds number, i.e. increasing either the particle size or the flow velocity of the ambient gas, flow separation takes place at the rear hemisphere of the spherical particle. The IFP adjacent to the particle surface continues to absorb thermal energy from the front stagnation location to the separation point, beyond which the IFP is taken away from the particle surface by the recirculating flow. The relative motion between the particle and the combustible mixture facilitates the heat transfer on the particle surface due to convection, which thereby increases the critical ignition temperature.
Previous studies (Mével et al. Reference Mével, Niedzielska, Melguizo-Gavilanes, Coronel and Shepherd2016, Reference Mével, Melguizo-Gavilanes, Boeck and Shepherd2019; Melguizo-Gavilanes et al. Reference Melguizo-Gavilanes, Coronel, Mével and Shepherd2017a,Reference Melguizo-Gavilanes, Mével, Coronel and Shepherdb) demonstrated that, at the critical ignition state, i.e.  ${T_s} = {T_{cr}}$, ignition first occurs around the separation point. This can be understood as follows. Flow decelerates on approaching the separation point, suggesting that convective heat transfer becomes less intensive and hence decreases the heat loss for ignition. Near the separation point, the temperature variation becomes gentle and thereby provides favourable conditions for ignition. Accordingly, we define the critical ignition condition based on the assumption that the resulting ignition location coincides with the separation point, where the local temperature gradient has the least magnitude and thus preferentially supports ignition. Moreover, the IFP would be taken away from the hot particle passing over the separation point and therefore lose the capability of ignition. While, as the particle temperature continues to increase, the ignition location moves upstream since an elevation of particle temperature can sustain more severe heat loss during ignition.
For large Reynolds number, i.e.  $Re \gg 1$, the flow field consists of a boundary layer on the particle surface. Across the boundary layer, the flow velocity decelerates to zero on the particle surface. In the outer region above the boundary layer, viscous stress can be neglected. For uniform flow across a spherical particle, the velocity components in the outer region are given by (Leal Reference Leal2007; Schlichting & Gersten Reference Schlichting and Gersten2016)
 \begin{equation}{\tilde{u}_\phi } = \left( {1 + \frac{1}{{2{{\tilde{r}}^3}}}} \right)\sin \phi ,\quad {\tilde{u}_r} ={-} \left( {1 - \frac{1}{{{{\tilde{r}}^3}}}} \right)\cos \phi .\end{equation}
On the particle surface with  $\tilde{r} = 1$, the radial component becomes zero while the tangential component is
 ${\tilde{u}_{\phi ,\tilde{r} = 1}} = (3/2)\sin \phi \ne 0$, which does not satisfy the no-slip condition. This indicates the necessity of solving the velocity distribution in the momentum boundary layer.
The boundary layer theory suggests rescaling the non-dimensional transverse coordinate and velocity component, defined by
 \begin{equation}Y = \sqrt {Re} (\tilde{r} - 1),\quad V = {\tilde{u}_r}\sqrt {Re} ,\end{equation}
for suitable description of the velocity distribution in the boundary layer. In the limit of  $Re \to \infty $, the governing equations for the momentum boundary layer covering a spherical particle are
 \begin{gather}\frac{{\partial V}}{{\partial Y}} + \frac{1}{{\sin \phi }}\frac{\partial }{{\partial \phi }}(u\sin \phi ) = 0,\end{gather}
 \begin{gather}\frac{{{\partial ^2}u}}{{\partial {Y^2}}} = \frac{{\textrm{d}p}}{{\textrm{d}\phi }} + V\frac{{\partial u}}{{\partial Y}} + u\frac{{\partial u}}{{\partial \phi }},\end{gather}
where we denote the non-dimensional tangential component of the flow velocity in the momentum boundary layer by u. Since the flow outside the momentum boundary layer is almost potential, the pressure gradient can be solved in terms of the  ${\tilde{u}_\phi }$ given by (3.17a,b) based on Bernoulli's equation, which, at the particle surface
 $\tilde{r} = 1$, yields
 \begin{equation}\frac{{\textrm{d}p}}{{\textrm{d}\phi }} ={-} {\tilde{u}_{\phi ,\tilde{r} = 1}}\frac{{\textrm{d}{{\tilde{u}}_{\phi ,\tilde{r} = 1}}}}{{\textrm{d}\phi }} ={-} \frac{9}{8}\sin 2\phi ,\end{equation}
where the pressure is non-dimensionalized by  ${\rho _g}U_\infty ^2$.
Equations (3.19) and (3.20) can be solved by means of a Blasius series, i.e. a series of velocity components in terms of  ${\phi ^n}$ with n being integer. The detailed description of the mathematical method can found in Leal (Reference Leal2007) and Schlichting & Gersten (Reference Schlichting and Gersten2016). Here, we only briefly present key steps in our solution.
According to (3.17a,b), the tangential component of the potential flow  ${\tilde{u}_\phi }$ at
 $\tilde{r} = 1$ can be expanded in a series of
 $\phi $,
 \begin{equation}{\tilde{u}_{\phi
,\tilde{r} = 1}} = \tfrac{3}{2}\sin \phi = \tfrac{3}{2}\phi -
\tfrac{1}{4}{\phi ^3} + \tfrac{1}{{80}}{\phi ^5} -
\tfrac{1}{{3360}}{\phi ^7} + \cdots
.\end{equation}
Correspondingly, the tangential velocity in the momentum boundary layer can also be expanded as a series of  $\phi $ with coefficients being general functions of the rescaled transverse coordinate Y. To obtain a relatively accurate interpretation to the velocity profile in the rear hemisphere, we retain terms of
 ${\phi ^n}$ with
 $n \le 7$ in the expansion of u, i.e.
 \begin{equation}u = {F^{\prime}_1}(Y)\phi + {F^{\prime}_3}(Y){\phi ^3} + {F^{\prime}_5}(Y){\phi ^5} + {F^{\prime}_7}(Y){\phi ^7},\end{equation}
where the prime in coefficient function F refers to derivative with respect to Y. The no-slip boundary condition requires that the coefficient functions F's satisfy
 \begin{equation}{F^{\prime}_1}(0) = {F^{\prime}_3}(0) = {F^{\prime}_5}(0) = {F^{\prime}_7}(0) = 0.\end{equation}
Matching with outer potential flow suggests that
 \begin{equation}{F^{\prime}_1}(Y) \to {\textstyle{3 \over 2}},\quad {F^{\prime}_3}(Y) \to - {\textstyle{1 \over 4}},\quad {F^{\prime}_5}(Y) \to {\textstyle{1 \over {80}}},\quad F_7^{\prime}(Y) \to - {\textstyle{1 \over {3360}}}\;\textrm{as}\;Y \to \infty .\end{equation}
Substituting the series of u given by (3.23) into the continuity equation (3.19), one obtains the series for  $\partial V/\partial Y$. Integrating with respect to Y yields
 \begin{align}V &={-} 2{F_1} +
({\textstyle{1 \over 3}}{F_1} - 4{F_3}){\phi ^2} +
({\textstyle{1 \over {45}}}{F_1} + {\textstyle{1 \over
3}}{F_3} - 6{F_5}){\phi ^4}\nonumber\\ &\quad + ({\textstyle{2 \over
{945}}}{F_1} + {\textstyle{1 \over {45}}}{F_3} +
{\textstyle{1 \over 3}}{F_5} - 8{F_7}){\phi
^6},\end{align}
whose coefficients are functions of Fi values instead of their derivative with respect to Y. The no-penetration boundary condition on the particle surface, i.e.  $V = 0$ at
 $Y = 0$, requires that the functions
 $F$ satisfy
 \begin{equation}{F_1}(0) = {F_3}(0) = {F_5}(0) = {F_7}(0) = 0.\end{equation}
Substituting the series forms of (3.23) and (3.26) into the momentum equation (3.20) and collecting the powers of  $\phi $, we have
 \begin{gather}{F^{\prime\prime\prime}_1} + 2{F_1}{F^{\prime\prime}_1} - F^{\prime 2}_1 + {\textstyle{9 \over 4}} = 0,\end{gather}
 \begin{gather}{F^{\prime\prime\prime}_3} + 2{F_1}{F^{\prime\prime}_3} - 4{F^{\prime}_1}{F^{\prime}_3} - {F^{\prime\prime}_1}({\textstyle{1 \over 3}}{F_1} - 4{F_3}) - {\textstyle{3 \over 2}} = 0,\end{gather}
 \begin{gather}\begin{array}{ccccc} & {{F^{\prime\prime\prime}_5}} + 2{F_1}{{F^{\prime\prime}_5}} - 6{{F^{\prime}_1}}{{F^{\prime}_5}} - {\textstyle{1 \over {45}}}{{F^{\prime\prime}_1}}({F_1} + 15{F_3} - 270{F_5})\\ & \hspace{-5pc}- F_3^{^{\prime\prime}}({\textstyle{1 \over 3}}{F_1} - 4{F_3}) - 3F^{\prime 2}_3 + {\textstyle{3 \over {10}}} = 0, \end{array}\end{gather}
 \begin{gather}\begin{array}{ccccc} & \hspace{-3pc}{{F^{\prime\prime\prime}_7}} + 2{F_1}{{F^{\prime\prime}_7}} - 8{{F^{\prime}_1}}{{F^{\prime}_7}} - {\textstyle{1 \over {945}}}{{F^{\prime\prime}_1}}(2{F_1} + 21{F_3} + 315{F_4} - 7560{F_7}) \\ & \quad- {{F^{\prime\prime}_5}}({\textstyle{1 \over 3}}{F_1} - 4{F_3}) - 8{{F^{\prime}_3}}{{F^{\prime}_5}} - \textstyle{1\over 45}{{F^{\prime\prime}_3}}({F_1} + 15{F_3} - 270{F_5}) - {\textstyle{1 \over {35}}} = 0, \end{array}\end{gather}
Which, subject to boundary conditions given by (3.24), (3.25) and (3.27), and can be solved numerically.
With knowledge of Fi values, the profiles of u and V can be determined through (3.23) and (3.26), respectively. According to the boundary layer theory, the separation point is characterized by the relation (Leal Reference Leal2007)
 \begin{equation}{\left( {\frac{{\partial u}}{{\partial Y}}} \right)_{Y = 0,\phi = {\phi _{sep}}}} = 0,\end{equation}
which, with our numerical results of u and V, gives  ${\phi _{sep}} \approx 108^\circ $ and is consistent with previous studies (Schlichting & Gersten Reference Schlichting and Gersten2016). This separation angle holds for
 $Re \to \infty $ which can be understood as meaning that the boundary layer equations (3.19) and (3.20) in fact give the leading-order solution of the flow field at the limit
 $Re \to \infty $. For moderate
 $Re$, the polar angle representing the separation point moves downstream on reducing the Reynolds number (Rimon & Cheng Reference Rimon and Cheng1969). To interpret such relation, we have to retain higher-order terms in the boundary layer equations, which results in exceeding difficulty in the mathematics and is thus beyond the scope of the present study.
Figure 1 shows that the tangential velocity increases from zero on the particle surface to the potential flow solution in the outer region. According to (3.21), the outer potential flow accelerates from the front stagnation point  $(\phi = 0)$ to the peripheral side of the sphere
 $(\phi = {\rm \pi}/2)$, after which the pressure gradient becomes adverse, leading to flow separation around
 $\phi \approx 0.6{\rm \pi} = 108^\circ $.
Change of the tangential velocity u with scaled transverse coordinate Y across the momentum boundary layer for different polar angles of  $\phi = 0.1{\rm \pi} \sim 0.6{\rm \pi} $.

The outer edge of the boundary layer is characterized by  $u = 0.99{\tilde{u}_{\phi ,\tilde{r} = 1}}$, and its distance from the particle surface is defined as the thickness of the momentum boundary layer, denoted by
 ${\delta _m}$. Figure 2 shows that
 ${\delta _m}$ increases monotonically with
 $\phi $, particularly beyond
 $\phi = {\rm \pi}/4$, where the favourable pressure gradient at
 $Y = 0$ is of largest magnitude according to (3.21). Besides, the tangential velocity gradient, interpreting the frictional resistance experienced by the particle, achieves the largest value around
 $\phi = 1.0$ and vanishes around
 ${\phi _{sep}} = 0.6{\rm \pi} \; $. This is consistent with the velocity profiles shown in figure 1.
Change of the tangential velocity gradient adjacent to the particle surface and the thickness of the momentum boundary layer with polar angle  $\phi $.

Since  $Pe \sim Re$, large Reynolds number also implies that
 $Pe \gg 1$. This indicates that the temperature of the gaseous premixture also exhibits a rapid transition from
 $\theta = 1$ on the particle surface to
 $\theta \to 0$ in the ambient, which is known as the thermal boundary layer. Since the Prandtl number of the gaseous premixture is of
 $O(1)$, the rescaling relation (3.18a,b) holds in the thermal boundary layer as well. Therefore, neglecting dissipation of kinetic energy to thermal energy, the governing equation for the thermal boundary layer can be written in the following form:
 \begin{equation}u\frac{{\partial \theta }}{{\partial \phi }} + V\frac{{\partial \theta }}{{\partial Y}} = \frac{1}{{Pr}}\frac{{{\partial ^2}\theta }}{{\partial {Y^2}}},\end{equation}
where the coefficients u and V, given by (3.23) and (3.26), are known functions of  $\phi $ and Y. Equation (3.33) is subject to the following boundary conditions:
 \begin{gather}\theta = 1\;\textrm{at}\;Y = 0,\end{gather}
 \begin{gather}\theta \to 0\;\textrm{as}\;Y \to \infty .\end{gather}
In analogy to the Blasius series representing the velocity profiles u and V, the normalized temperature in the thermal boundary layer can also be expanded in the series form as
 \begin{equation}\theta = {H_0}(Y) + {H_2}(Y){\phi ^2} + {H_4}(Y){\phi ^4} + {H_6}(Y){\phi ^6}.\end{equation}
Since the temperature profile is an even function about the axis of symmetry, i.e.  $\theta (\phi ) = \theta ( - \phi )$, only terms of even power in
 $\phi $ appear. To obtain consistent accuracy with the Blasius series of the velocity profiles, we retain four terms up to
 ${\phi ^6}$. Substituting the series representations of u, V and
 $\theta $, given by (3.23), (3.36) and (3.36), respectively, into (3.33), we obtain
 \begin{gather}\frac{{{{H^{\prime\prime}_0}}}}{{Pr}} ={-} 2{F_1}{H^{\prime}_0},\end{gather}
 \begin{gather}\frac{{{{H^{\prime\prime}_2}}}}{{Pr}} = \left( {\frac{{{F_1}}}{3} - 4{F_3}} \right){H^{\prime}_0} + 2{F^{\prime}_1}{H_2} - 2{F_1}{H^{\prime}_2},\end{gather}
 \begin{gather}\frac{{{{H^{\prime\prime}_4}}}}{{Pr}} = \left( {\frac{{{F_1}}}{{45}} + \frac{{{F_3}}}{3} - 6{F_5}} \right){H^{\prime}_0} + 2{F^{\prime}_3}{H_2} + \left( {\frac{{{F_1}}}{3} - 4{F_3}} \right){H^{\prime}_2} + 4{F^{\prime}_1}{H_4} - 2{F_1}{H^{\prime}_4},\end{gather}
 \begin{gather}\begin{array}{ccccc} & \hspace{-1pc}\dfrac{{{{H^{\prime\prime}_6}}}}{{Pr}} = \left( {\dfrac{{2{F_1}}}{{945}} + \dfrac{{{F_3}}}{{45}} + \dfrac{{{F_5}}}{3} - 8{F_7}} \right){{H^{\prime}_0}} + 2{{F^{\prime}_5}}{H_2} + \left( {\dfrac{{{F_1}}}{{45}} + \dfrac{{{F_3}}}{3} - 6{F_5}} \right){{H^{\prime}_2}} + 4{{F^{\prime}_3}}{H_4}\\ & \hspace{-12pc} + \left( {\dfrac{{{F_1}}}{3} - 4{F_3}} \right){{H^{\prime}_4}} + 6{{F^{\prime}_1}}{H_6} - 2{F_1}{{H^{\prime}_6}}. \end{array}\end{gather}
The boundary conditions for Hi are given by
 \begin{gather}{H_0}(0) = 1,\quad {H_2}(0) = {H_4}(0) = {H_6}(0) = 0,\end{gather}
 \begin{gather}{H_0}(Y) = {H_2}(Y) = {H_4}(Y) = {H_6}(Y) = 0\;\textrm{as}\;Y \to \infty .\end{gather}
The numerical solution to (3.37)–(3.40) subject to boundary conditions (3.41) and (3.42) can be sought following the same procedure as that used to obtain the coefficients Fi for the Blasius series of u and V. The representative parameter of the Prandtl number is selected to be that of air, i.e.  $Pr = 0.71$, in the numerical solution.
Figure 3 indicates that the normalized temperature tends to decrease linearly with Y around the particle surface, whose slope continues to reduce as  $\phi $ increases. At some elevated distance in the transverse direction, the change of
 $\theta $ becomes very slow and exhibits a long tail on relaxing to
 $\theta = 0$. The outer edge of the thermal boundary layer refers to the transverse coordinate where
 $\theta = 0.01$, and its distance from the particle surface is defined as the thickness of the thermal boundary layer, denoted by
 ${\delta _T}$.
Change of the normalized temperature with scaled transverse coordinate across the thermal boundary layer for different polar angles of  $\phi = 0.1{\rm \pi} \sim 0.6{\rm \pi} $.

Figure 4 shows the temperature gradient adjacent to the particle surface and the thickness of the thermal boundary layer. Similar to  ${\delta _m}$, the thermal boundary layer grows monotonically with
 $\phi $. Besides, comparison between figures 2 and 4 indicates that the thermal boundary layer is thicker than the momentum boundary layer. This is because
 $Pr < 1$.
Change of the temperature gradient adjacent to the particle surface and the thickness of the thermal boundary layer with polar angle  $\phi $.

The rate of heat transfer on the particle surface can be quantified by the magnitude of the temperature gradient there, which, as seen from figure 4, decreases to almost one third from the front stagnation point to the separation point. According to (2.13), the fall in temperature gradient reduces the heat loss for ignition of the combustible mixture. This is consistent with the experimental observation (Coronel Reference Coronel2016; Coronel et al. Reference Coronel, Melguizo-Gavilanes, Mével and Shepherd2018) that ignition most probably takes place near the separation point, where the temperature gradient calculated from (3.36) is
 \begin{equation}{-}{\left( {\frac{{\partial \theta }}{{\partial \tilde{r}}}} \right)_{\tilde{r} = 1,\phi = {\phi _{sep}}}} = \sqrt {Re} [{H^{\prime}_0}(0) + {H^{\prime}_2}(0)\phi _{sep}^2 + {H^{\prime}_4}(0)\phi _{sep}^4 + {H^{\prime}_6}(0)\phi _{sep}^6] = 0.276\sqrt {Re} .\end{equation}
3.4. The critical ignition temperature
According to (2.13), the non-dimensional heat loss coefficient is proportional to the square of the temperature gradient. Consequently, ignition occurs at the point where the magnitude of the local temperature gradient is the smallest, which is defined as the ignition temperature gradient, denoted by  ${(\textrm{d}\theta /\textrm{d}\tilde{r})_{ig}}$. In a quiescent environment, the temperature gradient is uniform over the particle surface according to (3.3), yielding
 \begin{equation} {-} {(\textrm{d}\theta /\textrm{d}\tilde{r})_{ig,0}} = 1.\end{equation}
For creeping flow over the hot particle, the lowest heat transfer rate occurs at the rear stagnation point, for which the temperature gradient is given by (3.16). Consequently, the ignition temperature gradient for creeping flow is
 \begin{equation}{-} {(\textrm{d}\theta /\textrm{d}\tilde{r})_{ig,c}} = 1 + {\textstyle{1 \over 8}}RePr.\end{equation}
At large  $Re$, flow separation takes place and the ignition temperature can be evaluated by the boundary layer solution given by (3.43). Therefore, the ignition temperature gradient for large
 $Re$ is
 \begin{equation}{-} {(\textrm{d}\theta /\textrm{d}\tilde{r})_{ig,\infty }} = 0.276\sqrt {Re} .\end{equation}
The correlations between the ignition temperature gradients and the Reynolds number for  $Re \ll 1$ and
 $Re \to 1$ are respectively presented by (3.45) and (3.46). However, for hot particle induced ignition, the Reynolds number usually varies in the intermediate range from
 $O(1)$ to
 $O({10^2})$, in which there exists a gap in the ignition temperature gradients predicted by (3.45) and (3.46) because the controlling mechanism of heat transfer alters as
 $Re$ increases.
Since the Blasius series holds at the limit condition of  $Re \to \infty $, the result given by (3.46) is not qualitatively accurate in the intermediate range of
 $Re$. It would be convenient to obtain an explicit formula that can predict the ignition temperature gradient in a wide range of Reynolds numbers from
 $Re = 0$ (for pure conduction) to
 $Re \sim O({10^2})$ (flow separation without unsteady vortex shedding) (Johnson & Patel Reference Johnson and Patel1999; Schlichting & Gersten Reference Schlichting and Gersten2016). Combining the mathematical forms of (3.45) and (3.46), we can specify the dependence of
 ${(\textrm{d}\theta /\textrm{d}\tilde{r})_{ig}}$ on
 $Re$ in the following form:
 \begin{equation}{-} {(\textrm{d}\theta /\textrm{d}\tilde{r})_{ig,m}} = 1 + {\alpha _T}R{e^{1/2}},\end{equation}
which reduces to pure conduction for  $Re = 0$ and scales with
 $\sqrt {Re} $ for large Reynolds numbers. The parameter
 ${\alpha _T}$ shall be determined with the help of the Frossling formula (Hughmark Reference Hughmark1980; McAllister, Chen & Fernandez-Pello Reference McAllister, Chen and Fernandez-Pello2011). The detailed procedures are presented as follows.
The Frossling formula (Hughmark Reference Hughmark1980; McAllister et al. Reference McAllister, Chen and Fernandez-Pello2011) interprets the total heat transfer from the particle in terms of the Nusselt number, which can be equivalently correlated to an average temperature gradient, i.e.
 \begin{equation}{-} {(\textrm{d}\theta /\textrm{d}\tilde{r})_{av,m}} = 1 + 0.282R{e^{1/2}}P{r^{1/3}}.\end{equation}
In spite of a similar mathematical form, the coefficient  ${\alpha _T}$ in (3.47) differs from that in (3.48). Considering similarity in the boundary layer, we suppose that the proportionality between the temperature gradient at the flow separation point,
 ${(\textrm{d}\theta /\textrm{d}r)_{ig,m}}$ given by (3.47), and its average value over the whole particle surface,
 ${(\textrm{d}\theta /\textrm{d}r)_{ave}}$ given by (3.48), would be less than unity and tends to vary slowly with
 $Re$. Thereby, we can determine the coefficient
 ${\alpha _T}$ with the help of both the Frossling formula and the Blasius series solution of thermal boundary layer.
The average temperature gradient in the limit of  $Re \to \infty $ can be calculated via the boundary layer solution, giving
 \begin{equation}{-} {(\textrm{d}\theta /\textrm{d}\tilde{r})_{av,\infty }} ={-} {\left( {\int_0^{{\phi_{sep}}} {\sin \phi \,\textrm{d}\phi } } \right)^{ - 1}}\int_0^{{\phi _{sep}}} {{{(\textrm{d}\theta /\textrm{d}\tilde{r})}_{\tilde{r} = 1}}\sin \phi \,\textrm{d}\phi } = 0.582\sqrt {Re} ,\end{equation}
where  ${\phi _{sep}} \approx 108^\circ $ as obtained before and (3.36) is used.
Therefore, the ratio in the limit of  $Re \to \infty $ can be determined,
 \begin{equation}{c_\infty } = \frac{{{{(\textrm{d}\theta /\textrm{d}\tilde{r})}_{ig,\infty }}}}{{{{(\textrm{d}\theta /\textrm{d}\tilde{r})}_{av,\infty }}}} = 0.474.\end{equation}
If we assume that the value of  ${c_\infty }$ is independent of the Reynolds number, then we can determine the parameter
 ${\alpha _T}$ in the limit of
 $Re \to \infty $ through the subsequent relation,
 \begin{equation}\mathop {\lim }\limits_{Re \to \infty } \frac{{{{(\textrm{d}\theta /\textrm{d}\tilde{r})}_{ig,m}}}}{{{{(\textrm{d}\theta /\textrm{d}\tilde{r})}_{av,m}}}} = \frac{{{\alpha _T}}}{{0.282P{r^{1/3}}}} \to 0.474,\end{equation}
which gives  ${\alpha _T} = 0.117$ for
 $Pr = 0.71$. Substituting the value of
 ${\alpha _T}$ into (3.47), the ignition temperature gradient in this intermediate range of Re can be determined.
Substituting equation (3.47) into (2.13), we obtain the effective heat loss coefficient in the presence of relative motion between hot particle and the combustible mixture
 \begin{equation}\tilde{h}({T_s}) = \frac{{{\alpha _g}{T_a}{{(1 - {T_\infty }/{T_s})}^2}{e^{{T_a}/{T_s} + 1}}}}{{2BR_0^2{T_{ad}}(1 - {T_\infty }/{T_{ad}})}}{(1 + {\alpha _T}R{e^{1/2}})^2}.\end{equation}
This expression indicates that the non-dimensional heat loss coefficient increases monotonically with the Reynolds number. The critical ignition temperature  ${T_{ig,cr}}$ can be determined by substituting equation (3.47) into (2.15), which gives
 \begin{equation}\frac{{{T_a}}}{{{T_{ig,cr}}}} = \ln \frac{{2{T_{ad}}(1 - {T_\infty }/{T_{ad}})R_0^2B}}{{{T_a}{{(1 - {T_\infty }/{T_{ig,cr}})}^2}{\alpha _g}}} - 2\ln (1 + {\alpha _T}R{e^{1/2}}).\end{equation}
In quiescent environment with  $Re = 0$, the second term on the right-hand side of (3.53) vanishes and we have
 \begin{equation}\frac{{{T_a}}}{{{T_{ig,cr}}}} = \ln \frac{{2{T_{ad}}(1 - {T_\infty }/{T_{ad}})R_0^2B}}{{{T_a}{{(1 - {T_\infty }/{T_{ig,cr}})}^2}{\alpha _g}}},\end{equation}
which is equivalent to the ignition theory given by the steady state theory with  ${\varDelta _I} = 1$. In the absence of relative motion between the particle and the combustible mixture, the temperature inhomogeneity is attributed solely to heat conduction at the particle surface, and thus depends on the square of the particle radius.
Usually,  ${T_{ig,cr}}$ and
 ${T_{ad}}$ are much higher than
 ${T_\infty }$, and thereby we can assume
 $1 - {T_\infty }/{T_{ig,cr}} \approx 1$ and
 $1 - {T_\infty }/{T_{ad}} \approx 1$. Accordingly, a simplified ignition criterion can be obtained from (3.54)
 \begin{equation}\frac{{{T_a}}}{{{T_{ig,cr}}}} \approx \ln \frac{{2{T_{ad}}BR_0^2}}{{{T_a}{\alpha _g}}},\end{equation}
which shows that the inverse of the critical ignition temperature is linearly proportional to the logarithm of the particle radius or the surface area. It agrees with the scaling relation for ignition in a stagnant environment proposed by Laurendeau (Reference Laurendeau1982).
To determine the critical ignition temperature through (3.53), we need to know the reaction rate factor B and activation temperature  ${T_a}$. In this work, we consider both CH4/air and H2/air mixtures in stoichiometric conditions, and accordingly, the parameters B and
 ${T_a}$ for an individual mixture should be determined independently by fitting the ignition delay time calculated from simulation using detailed chemistry based on (2.5). According to ignition behaviour, we specify the reaction related parameters for the CH4/air mixture at a relatively high temperature range, e.g.
 $T > 1500\;\textrm{K}$, giving
 $B = 9.5 \times {10^8}\;{\textrm{s}^{ - 1}}$ and
 ${T_a} = 25\;000\;\textrm{K}$, and for the H2/air mixture at a comparably lower temperature range, e.g.
 $T > 900\;\textrm{K}$, obtaining,
 $B = {10^{14}}\;{\textrm{s}^{ - 1}}$ and
 ${T_a} = 28\;500\;\textrm{K}$.
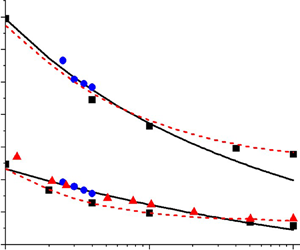
Figure 5 compares the critical ignition temperature predicted by the present theory, i.e. (3.54), and previous simulations and experiments. Good agreement is shown to be achieved. For both CH4/air and H2/air mixtures, the critical ignition temperature  ${T_{ig,cr}}$ is shown to increase rapidly when the particle radius
 ${R_0}$ decreases. In particular,
 ${T_{ig,cr}}$ for CH4/air for is around 1500 K at
 ${R_0} = 1\;\textrm{mm}$, while it is around 2200 K at
 ${R_0} = 0.1\;\textrm{mm}$. The quantitative difference between theoretical prediction and numerical/experimental results may be primarily attributed to the simplified one-step reaction model considered in present analysis. According to the numerical study by Häber et al. (Reference Häber, Zirwes, Roth, Zhang, Bockhorn and Maas2017), the critical ignition temperature of spherical particle (with radius 0.8 mm) determined using the Gas Research Institute (GRI) 3.0 mechanism tends to be uniformly lower than that calculated utilizing the University of California at San Diego (UCSD) mechanism for a wide range of stoichiometric ratios, and the maximum difference could be greater than 50 K. This suggests that the chemical reaction mechanism has a considerable effect on the quantitative evaluation of the critical ignition temperature.
Change of the critical ignition temperature with the particle radius. The mixture is stoichiometric CH4/air at 300 K and 1 atm. The theoretical results are from (3.54); the experimental data were reported by Roth et al. (Reference Roth, Häber and Bockhorn2017); and the simulation results are from Beyer & Markus (Reference Beyer and Markus2012), Häber et al. (Reference Häber, Zirwes, Roth, Zhang, Bockhorn and Maas2017) and Wang & Chen (Reference Wang and Chen2020).

The actual chemical reaction involves multiple stages and various elementary rate coefficients, which can hardly be characterized by two constant parameters (activation temperature and reaction frequency) in a wide range of temperatures. Generalizing the activation temperature and reaction frequency as functions of temperature, i.e.  ${T_a} = {T_a}(T)$ and
 $B = B(T)$, would improve the accuracy of the reaction model, which, however, is beyond the scope of the present study.
In this work, we neglected the effect of thermal radiation from the hot particle to the combustible mixture in the environment. Based on scaling analysis, the rate of heat transfer per unit area due to radiation and conduction can be evaluated as  ${h_{radiation}} \sim {\alpha _r}\sigma {T^4}$ and
 ${h_{conduction}} \sim \lambda \boldsymbol{\nabla }T$, respectively, where
 $\sigma $ is the Stefan–Boltzmann constant, and
 ${\alpha _r} < 1$ indicates the deviation from black-body radiation. For particles with of temperature around 1000 K and radius around 1 mm, the magnitudes of
 ${h_{conduction}}$ and
 ${h_{radiation}}$ approximately satisfy
 ${h_{conduction}}/{h_{radiation}} \sim 1/2{\alpha _r}$. However, the emissivity
 ${\alpha _r}$ in this temperature range would be considerably smaller than unity (corresponding to black-body radiation) and thus the rate of heat transfer by conduction would be greater than that due to radiation. Besides, the radiative heat transfer is of long range, i.e. only a slight portion of the thermal energy carried by the propagating electromagnetic waves could be absorbed by the reactive mixture close to the particle surface. Therefore, thermal radiation of the hot particle on the ignition of combustible mixture should be secondary.
For particle in non-static mixture, i.e.  $Re > 0$, the second term on the right-hand side of (3.53) is greater than zero, suggesting that the enhanced temperature inhomogeneity due to convective heat transfer tends to increase the critical ignition temperature. For small Reynolds number, (3.53) can be simplified to
 \begin{equation}\frac{{{T_a}}}{{{T_{ig,cr}}}} \approx \ln \frac{{2{T_{ad}}R_0^2B}}{{{T_a}{\alpha _g}}} - 2{\alpha _T}R{e^{1/2}},\end{equation}
while at large Reynolds number it becomes
 \begin{equation}\frac{{{T_a}}}{{{T_{ig,cr}}}} \approx \ln \frac{{2{T_{ad}}R_0^2B}}{{{T_a}{\alpha _g}}} - \ln (\alpha _T^2Re).\end{equation}
Equations (3.56) and (3.57) show that the relative motion between the particle and the ambient gas increases the critical ignition temperature, and that  ${T_{ig,cr}}$ increases with the Reynolds number. Nevertheless, the logarithmic scaling relation between
 ${T_{ig,cr}}$ and
 ${U_\infty }$ (proportional to Reynolds number) appears to differ from the fitting formulas given by Zirwes et al. (Reference Zirwes, Zhang, Häber and Bockhorn2019), which interpret
 ${T_{ig,cr}}$ as power functions of
 ${U_\infty }$.
Figure 6 plots the critical ignition temperature predicted by the present analysis and simulations in Zirwes et al. (Reference Zirwes, Zhang, Häber and Bockhorn2019). Using the average temperature gradient in (3.48) greatly overestimates the heat loss coefficient and thereby the critical ignition temperature. On the contrary, the ignition temperature gradient given by (3.47) appropriately evaluates the temperature inhomogeneity at the ignition location and thereby has predictions agreeing well with those from simulations. The slight elevation of the theoretically predicted critical ignition temperature can be attributed to the fact that the viscosity of the gaseous mixture is evaluated based on the far-field temperature rather than the particle temperature, which results in a larger Reynolds number and thereby a greater temperature gradient at the ignition location.
Change of the critical ignition temperature with flow velocity. Stoichiometric mixtures of CH4/air and H2/air are considered at conditions of 300 K and 1 atm, and the particle radius is 0.4 mm. The solid line represents prediction by (3.53) in comparison with the dashed line obtained by replacing  ${(\textrm{d}\theta /\textrm{d}\tilde{r})_{ig,m}}$ with
 ${(\textrm{d}\theta /\textrm{d}\tilde{r})_{av,m}}$ given by (3.48). The symbols denote simulation results in Zirwes et al. (Reference Zirwes, Zhang, Häber and Bockhorn2019).

Based on energy budget analysis, Häber et al. (Reference Häber, Zirwes, Roth, Zhang, Bockhorn and Maas2017) proposed a theoretical formula for the ignition temperature, which scales with  ${R_0}$ in the form of
 ${T_a}/{T_{ig,cr}} \sim \ln (R_0^2/\sqrt {Re} )$ in contrast to
 $\ln (R_0^2/Re)$ in (3.53). In the work of Häber et al. (Reference Häber, Zirwes, Roth, Zhang, Bockhorn and Maas2017), the rate of heat loss is approximated by
 ${\lambda _g}({T_s} - {T_\infty })/{\delta _T}$, which underestimates the temperature inhomogeneity during ignition and thus results in a lower critical ignition temperature.
Rewriting (3.57) in an alternative form
 \begin{equation}\frac{{{T_a}}}{{{T_{ig,cr}}}} \approx \ln \frac{{2{\nu _g}B{T_{ad}}{R_0}}}{{{\alpha _g}{T_a}\alpha _T^2{U_\infty }}},\end{equation}
we obtain that  ${T_a}/{T_{ig,cr}} \propto \ln ({R_0}/{U_\infty })$, which agrees well with the scaling relation given by Laurendeau (Reference Laurendeau1982) for ignition under the condition of forced convection.
4. The effect of particle cooling on ignition
In general, ignition occurs when the heat release from chemical reaction exceeds the heat loss due to the surroundings. In addition to temperature inhomogeneity, various transient processes during the ignition process may also affect the ignition behaviour and thus modify the ignition condition, such as the drop of particle temperature and the finite residence time of the IFP staying close to the particle for  $Re > 0$. In this section, we shall consider the effect of particle cooling on the ignition behaviour. The impacts of finite residence time of IFP will be discussed in the next section.
When a hot particle is in a flowing environment, heat is continuously removed from the hot particle through a combination of conduction and convection. Since the thermal conductivity of a solid is substantially greater than that of a gas, the particle temperature can be considered uniform prior to ignition. Accordingly, the energy equation for the solid particle is given by
 \begin{equation}\frac{{\textrm{d}{T_s}}}{{\textrm{d}t}} = \frac{1}{{{\rho _s}{c_{vs}}{V_s}}}\int {{\lambda _g}} {\left( {\frac{{\textrm{d}T}}{{\textrm{d}r}}} \right)_{r = {R_0}}}\,\textrm{d}{A_s},\end{equation}
where  ${\rho _s}$,
 ${c_{vs}}$ and
 ${V_s}$ are, respectively, the density, heat capacity and volume of the particle and
 ${A_s}$ is the area of the particle surface. The integration on the right-hand side represents heat conduction over the particle surface. The Nusselt number representing the dimensionless total heat transfer rate is usually defined in the following general form (Leal Reference Leal2007):
 \begin{equation}Nu \equiv{-} \frac{{2{R_0}}}{{{A_s}{\lambda _g}({T_s} - {T_\infty })}}\int {{\lambda _g}} {\left( {\frac{{\textrm{d}T}}{{\textrm{d}r}}} \right)_{r = {R_0}}}\,\textrm{d}{A_s}.\end{equation}
In terms of Nusselt number, the energy equation for the spherical particle can be written as
 \begin{equation}\frac{{\textrm{d}{T_s}}}{{\textrm{d}t}} ={-} \frac{{3{\alpha _g}{\rho _g}{c_{pg}}Nu}}{{2{\rho _s}{c_{vs}}R_0^2}}({T_s} - {T_\infty }).\end{equation}
When the Nusselt number is assumed to be constant, the above equation can be integrated and we obtain the following expression for the temporal change of particle temperature:
 \begin{equation}{T_s} = {T_\infty } + ({T_{s0}} - {T_\infty })\ {\rm exp} \left( { - \frac{{3Nu{\rho_g}{c_{pg}}{\alpha_g}t}}{{2{\rho_s}{c_{vs}}R_0^2}}} \right),\end{equation}
where  ${T_{s0}}$ is the initial temperature of the hot particle.
According to the thermal ignition theory (Vázquez-Espí & Liñán Reference Vázquez-Espí and Liñán2001, Reference Vázquez-Espí and Liñán2002), relatively small temperature variation (of  $O({T_s}/{T_a})$) may lead to substantial change (of
 $O(1)$) in the chemical reaction rate. From (4.4), the time required for the particle temperature to drop from
 ${T_{s0}}$ to
 ${T_{s0}}(1 - {T_{s0}}/{T_a})$ is
 \begin{equation}{\tau _{pc}} = \frac{{2{\rho _s}{c_{vs}}R_0^2T_{s0}^2}}{{3Nu{\rho _g}{c_{pg}}{\alpha _g}{T_a}({T_{s0}} - {T_\infty })}},\end{equation}
which is the characteristic time for particle cooling.
For given initial particle temperature  ${T_{s0}}$, the non-dimensional heat loss coefficient
 $\tilde{h}$ is determined by (2.13) and the non-adiabatic ignition delay time is given by (2.16). For
 $\tilde{h}$ slightly smaller than e, the integral on the right-hand side of (2.16) would be of
 $O(1)$. For simplicity, we may use
 ${\tau _{ch}}$ given by (2.5) to represent the characteristic time for chemical reaction. Evaluating
 ${\tau _{ch}}$ by setting
 ${T_s} = {T_{s0}}$ in (2.5) and expressing the reaction frequency factor B in terms of the reduced Damköhler number
 ${\varDelta _I}$ given by (2.2), we obtain the ratio between characteristic time for particle cooling and that for chemical reaction time
 \begin{equation}\frac{{{\tau _{pc}}}}{{{\tau _{ch}}}} = \frac{{{\rho _s}{c_{vs}}{\mathrm{\Delta }_I}{T_a}(1 - {T_\infty }/{T_{s0}})}}{{3Nu{\rho _g}{c_{pg}}{T_{s0}}}}\left( {\frac{{\textrm{d}\theta }}{{\textrm{d}\tilde{r}}}} \right)_{\tilde{r} = 1}^2.\end{equation}
Near the critical ignition state, we may analyse the order of magnitude of each term on the right-hand side of (4.4), yielding that  ${\varDelta _I} \sim O(1)$,
 $({T_{s0}} - {T_\infty })/{T_{s0}} \sim O(1)$,
 ${(\textrm{d}\theta /\textrm{d}\tilde{r})_{\tilde{r} = 1}} \sim Nu$ and
 $({c_{vs}}/{c_{pg}})({T_a}/{T_{s0}}) \sim O(1)$ for most solid particles. Consequently, the ratio
 ${\tau _{pc}}/{\tau _{ch}}$ can be evaluated as
 \begin{equation}\frac{{{\tau _{pc}}}}{{{\tau _{ch}}}} \sim \frac{{{\rho _s}}}{{{\rho _g}Nu}},\end{equation}
which is of  $O({10^3})$ for most solid materials at moderate Nusselt numbers. Despite the fact that the non-adiabatic ignition delay time
 ${\tau _{ig}}$ tends to be higher than
 ${\tau _{ch}}$, the value of the integral on the right-hand side of (2.16) may not be as large as
 ${\rho _s}/{\rho _g}$. Therefore, we have
 ${\tau _{pc}} \gg {\tau _{ch}}$, which indicates that the change of particle temperature is negligible during the ignition process. Consequently, the particle temperature
 ${T_s}$ can be assumed to be constant. This assumption is used § 3.
Despite the fact that the time scale ratio scale depends on the particle radius by following  ${\tau _{pc}}/{\tau _{ch}} \sim R_0^{1/2}$, it is noted that the magnitude of the ratio
 ${\tau _{pc}}/{\tau _{ch}}$ changes slightly because of the significant density difference. Therefore, we can always have
 ${\tau _{pc}} \gg {\tau _{ch}}$, which can be understood as follows. On the one hand, the total thermal energy of the particle is proportional to the volume, while the heat transfer occurs on the particle surface. The relatively large surface-to-volume ratio for a small particle tends to increase the cooling rate. On the other hand, according to (3.53), the critical ignition temperature for the particle increases rapidly as the particle radius decreases. Meanwhile, the reaction rate grows exponentially with the particle temperature according to (2.5), and exceeds the increasing cooling rate due to shrinking of the particle size. In general, we conclude that the particle temperature change is not important during the ignition process, and the assumption of a constant particle temperature before ignition is validated.
5. The effect of finite residence time of IFP on ignition
In the preceding analysis, we determine the critical ignition temperature by equating the heat loss coefficient to its maximum value, i.e.  $\tilde{h} = e$, which implies that the ignition delay time is infinitely large. Since ignition occurs slightly away from the particle surface, uniform flow of the reactant mixture suggests that the IFP has a finite residence time, denoted by
 ${\tau _{res}}$, as it moves around the hot particle. Consequently, the critical ignition condition should be revised to
 ${\tau _{res}} = {\tau _{ig}}$.
Since the IFP must be located within the thermal boundary layer, its velocity, denoted by  ${u_{IFP}}$, depends on the transverse distance from the hot particle. The largest speed of the IFP is
 ${\tilde{u}_{\phi ,\tilde{r} = 1}}$ of the potential flow, given by (3.17a,b). In such a situation, the arrival time of the IFP at polar angle
 $\phi $ can be calculated as
 \begin{equation}{\tau _\phi } = \frac{{{R_0}}}{{{U_\infty }}}\int_0^\phi {\frac{{\textrm{d}\phi ^{\prime}}}{{{{\tilde{u}}_{\phi ,\tilde{r} = 1}}}}} \to \frac{{2{R_0}}}{{3{U_\infty }}}\left[ {\left( {\ln \left|{\tan \frac{{\phi^{\prime}}}{2}} \right|} \right)_0^\phi } \right].\end{equation}
The evaluation of the integral on the right-hand side requires discussion in depth. On the one hand, for  $\phi = 0$, we should have
 ${\tau _\phi } = 0$ according to the definition of integration. On the other hand, the integrand in (5.1) becomes divergent at
 $\phi = 0$, i.e.
 ${\lim _{\theta \to 0}}\ln |\tan \theta /2|\to \infty$. This is because both
 ${\tilde{u}_\phi }$ and
 $\textrm{d}p/\textrm{d}\theta $ vanish simultaneously at the front stagnation point according to (3.17a,b) and (3.21), i.e. there is no impetus for the fluid element to move downstream. Consequently, the residence time
 ${\tau _{res}}$ cannot be calculated by direct integration.
Due to unavoidable flow perturbations, it would be very likely that the IFP confronts the hot particle with an impact parameter, which may be arbitrarily small and which indicates the deviation of the IFP from the stagnation point. Therefore, it is plausible to retain the condition that  ${\tau _\phi } = 0$ for
 $\phi = 0$, as suggested by Coronel (Reference Coronel2016). Then the analytical expression for
 ${\tau _\phi }$, represented by the last term on the right-hand side of the arrow symbol in (5.1), should be slightly revised by adding a unit within the logarithmic operator, as suggested by Coronel (Reference Coronel2016). Accordingly, characteristic time for the potential flow moving from the front stagnation point to the separation point can be evaluated as
 \begin{equation}{\tau _{sep}} \approx \frac{{2{R_0}}}{{3{U_\infty }}}\ln \left|{1 + \tan \frac{{{\phi_{sep}}}}{2}} \right|.\end{equation}
Nevertheless, equating  ${u_{IFE}}$ to the tangential component of the potential flow, i.e.
 ${u_{IFP}} = {\tilde{u}_{\phi ,\tilde{r} = 1}} = (3/2)\sin \phi $, considerably underestimates the residence time of the IFP and may lead to overestimation in the critical ignition temperature.
For large activation temperature,  ${T_a} \gg {T_s}$, asymptotic analysis shows that intensive chemical reaction is concentrated in a relatively small region, known as Frank–Kamenetskii region (Vázquez-Espí & Liñán Reference Vázquez-Espí and Liñán2001, Reference Vázquez-Espí and Liñán2002). In the Frank–Kamenetskii region, the temperature falls from the peak value to the Frank–Kamenetskii temperature, denoted by
 ${T_{FK}}$, which is lower than
 ${T_{max}}$ by an
 $O(\epsilon )$ with
 $\epsilon = T_s^2/{T_a}({T_{ad}} - {T_\infty })$. In our problem, the maximum temperature is
 ${T_s}$ on the particle surface and for each
 ${T_s}$ the value of
 $\epsilon $ can be determined uniquely, for instance,
 $\epsilon $ increases from 0.05 to 0.1 as particle temperature changes from 1500 to 2200 K and, for convenience, we may specify
 $\epsilon = 0.1$ and thus determine the normalized Frank–Kamenetskii as
 ${\theta _{FK}} = 1 - \epsilon = 0.9$ in the subsequent discussions.
The thermal boundary layer accounts for the transition of the temperature from  $\theta = 1$ on the particle surface to
 $\theta = 0$ at the far field. The transverse coordinate corresponding to
 $\theta = {\theta _{FK}}$ defines the outer edge of the Frank–Kamenetskii region, denoted by
 ${Y_{FK}}$. According to Vázquez-Espí & Liñán (Reference Vázquez-Espí and Liñán2001, Reference Vázquez-Espí and Liñán2002), ignition occurs within the Frank–Kamenetskii region, where the IFP must be situated. We assume that the IFP parcel is located at the edge of the Frank–Kamenetskii region and thereby define its moving velocity based on the boundary layer solution. This assumption is based on the fact that, for a fluid parcel outside the Frank–Kamenetskii region, the local reaction rate is so low that ignition can never occur during its passage across the particle. The tangential velocity of the IFP thus defined, i.e.
 ${u_{FK}} = u(\phi ,{Y_{FK}})$, provides the upper limit describing the effects of finite residence time of IFP on the ignition behaviour and the critical ignition condition. The value of
 ${u_{FK}}$ can be expressed in series form according to (3.23)
 \begin{equation}{u_{FK}} = {F^{\prime}_1}({Y_{FK}})\phi + {F^{\prime}_3}({Y_{FK}}){\phi ^3} + {F^{\prime}_5}({Y_{FK}}){\phi ^5} + {F^{\prime}_7}({Y_{FK}}){\phi ^7}.\end{equation}
Figure 7 shows that the outer edge of the Frank–Kamenetskii region is slightly above the particle. From the front stagnation position to the separation point, we may approximately have  ${Y_{FK}}/{\delta _m} \sim 0.1$, which is consistent with previous studies (Coronel Reference Coronel2016; Coronel et al. Reference Coronel, Melguizo-Gavilanes, Mével and Shepherd2018). Consequently, the magnitude of
 ${u_{FK}}$ at
 $Y = {Y_{FK}}$ is one order lower than
 ${\tilde{u}_{\phi ,\tilde{r} = 1}}$ of the potential flow.
The blue and black solid lines respectively give the variation of Frank–Kamenetskii region thickness  ${Y_{FK}}$, corresponding to
 ${\theta _{FK}} = 0.9$, and the tangential velocity component
 ${u_{FK}}$ at that distance. The blue and black dashed lines provide the boundary layer thickness
 ${\delta _m}$ and the tangential component of the potential velocity for comparison.

For convenience, we may approximately correlate  ${u_{FK}}$ to
 ${\tilde{u}_{\phi ,\tilde{r} = 1}}$ through a linear relation,
 \begin{equation}{u_{FK}} = {\alpha _{FK}}{\tilde{u}_{\phi ,\tilde{r} = 1}} = {\textstyle{3 \over 2}}{\alpha _{FK}}\sin \phi ,\end{equation}
where the numerical value of the proportional factor  ${\alpha _{FK}}$ can be calculated by means of the series solution of the tangential velocity in the momentum boundary layer, giving
 ${\alpha _{FK}} \approx 0.15$. Replacing
 ${\tilde{u}_{\phi ,\tilde{r} = 1}}$ by
 ${u_{FK}}$ in (5.1) provides the correction of the residence time for IFP, i.e.
 \begin{equation}{\tau _{res}} = \frac{{2{R_0}}}{{3{U_\infty }{\alpha _{FK}}}}\ln \left|{1 + \tan \frac{{{\phi_{sep}}}}{2}} \right|.\end{equation}
According to (5.5) and (5.2), we have  ${\tau _{res}}/{\tau _{sep}} = 1/{\alpha _{FK}}$, which is considerably greater than unity. This demonstrates that the residence time of the IFP should not be evaluated by the characteristic time for potential flow past a spherical particle.
Equating  ${\tau _{res}}$ in (5.5) to the ignition delay time
 ${\tau _{ig}}$ calculated via (2.16), we revise the ignition criterion by considering the motion of the IFP and thereby determine the critical ignition temperature.
To derive an explicit formula for  ${T_{cr}}$, the integral on the right-hand side of (2.16), which is defined as a function of
 $\tilde{h}$,
 \begin{equation}{F_{ig}}(\tilde{h}) = \int_0^\infty {\frac{{\textrm{d}\chi }}{{{e^\chi } - \tilde{h}\chi }}} ,\end{equation}
must be evaluated in analytical sense. Here,  ${F_{ig}}$ can be understood as the amplifying factor of ignition delay in the presence of heat loss. The series of
 ${F_{ig}}$ in powers of
 $\tilde{h}$ converges very slowly. To reproduce the asymptotic behaviour of
 ${F_{ig}} \to \infty $ as
 $\tilde{h} \to e$, one has to retain terms of
 ${\tilde{h}^{100}}$, and thus the series exhibits little applicability in analytical operations. However, the general behaviour of
 ${F_{ig}}(\tilde{h})$ suggests that we may approximately evaluate its value through a simplified model in the subsequent form
 \begin{equation}{F^{\prime}_{ig}}(\tilde{h}) = \frac{1}{{1 - \tilde{h}/e}}.\end{equation}
The model  ${F^{\prime}_{ig}}$ is consistent with
 ${F_{ig}}$ satisfying that
 ${F^{\prime}_{ig\,}}(0) = {F_{ig}}(0) = 1$ and the asymptotic behaviour that
 ${F^{\prime}_{ig}} \to \infty $ as
 $\tilde{h} \to e$. Figure 8 shows that, in almost the whole range of
 $\tilde{h}$, the relative deviation between
 ${F^{\prime}_{ig}}$ and
 ${F_{ig}}$, defined by
 ${f_{err}} = |{F_{ig}} - {F^{\prime}_{ig}}|/{F_{ig}}$, is of
 $O(1)$, suggesting qualitative agreement between the simplified model
 ${F^{\prime}_{ig}}$ and the exact integral
 ${F_{ig}}$. Replacing
 ${F_{ig}}$ by
 ${F^{\prime}_{ig}}$ enables solution of
 $\tilde{h}$ (or equivalently
 ${T_s}$) with knowledge of
 ${\tau _{ig}}$ (or equivalently
 ${\tau _{res}}$) and hence provides convenience in deriving an explicit expression for
 ${T_{cr}}$.
Comparison of  ${F^{\prime}_{ig}}$ predicted by simplified model (5.7) with
 ${F_{ig}}$ calculated by integral (5.6). The solid lines represent the variation of
 ${F_{ig}}$ or
 ${F^{\prime}_{ig}}$ with the non-dimensional heat loss coefficient, whose deviations
 ${f_{err}}$ are indicated by the dashed lines.

Using the simplified model  ${F^{\prime}_{ig}}$ in the ignition criterion
 ${\tau _{res}} = {\tau _{ig}}$, we obtain
 \begin{align}\begin{aligned}
\dfrac{{{T_a}}}{{{T_{ig, cr}}}} & = \ln
\dfrac{{2{T_{ad}}(1 - {T_\infty
}/{T_{ad}})BR_0^2}}{{{T_a}{{(1 - {T_\infty
}/{T_{ig,cr}})}^2}{\alpha _g}}} - 2\ln (1 + {\alpha
_T}R{e^{1/2}})\\ & \quad - \ln \left[ {1 +
\dfrac{{3{\alpha_{FK}}Pe}}{{A{r^2}\ln |1 + \tan
({\phi_{sep}}/2)|{{(1 + {\alpha_T}R{e^{1/2}})}^2}}}}
\right], \end{aligned}\end{align}
where  $Ar = {T_a}/{T_{ig, cr}}$ is the Arrhenius number and is usually of
 $O(10)$.
The first and second terms on the right-hand side of (5.8) are identical to those in (3.53), which interprets the effect of temperature inhomogeneity, resulting from respectively conductive and convective heat transfer, on the critical ignition temperature. The additional growth of  ${T_{cr}}$ due to the motion of IFP is represented by the last term on the right-hand side of (5.8), which vanishes identically by either taking
 ${\alpha _{FK}} = 0$ (i.e. IFP attached to the particle surface) or
 $Pe = 0$ (i.e. the combustible mixture in a quiescent condition). The magnitude of this additional term appears to be considerably smaller than the remaining terms, which implies that the motion of the IFP can hardly contribute to the elevation of
 ${T_{ig,cr}}$.
Figure 9 shows the change of critical ignition temperature, corresponding to a spherical particle of radius 0.4 mm in a stoichiometric CH4/air mixture, with uniform flow velocity. It is observed that the discrepancies between the solid lines appears to be indiscernible, which demonstrates that considering the motion of the IFP results in negligible change in the critical ignition temperature. Replacing  ${F_{ig}}$ by its simplified model
 ${F^{\prime}_{ig}}$ results in the elevation of
 ${T_{ig,cr}}$, as indicated by the difference between the blue and red lines of either solid or dashed type in figure 9. This can be attributed to the fact that the magnitude of
 ${F^{\prime}_{ig}}$ is uniformly higher than that of
 ${F_{ig}}$ in the whole range of
 $\tilde{h}$, as shown in figure 8, and thereby overestimates the heat loss effect during ignition. Nevertheless, quantitative interpretation of the critical ignition condition requires appropriate evaluation of the velocity of the IFP,
 ${u_{IFP}}$. Comparison between the solid and dashed lines in figure 9 indicates that equating
 ${u_{IFP}}$ to
 ${u_{\phi ,\tilde{r} = 1}}$ outside the boundary layer would lead to a physically implausible boost in
 ${T_{ig,cr}}$. This can be attributed to the considerable reduction of the residence time of the IFP, which is equivalent to an intensification of the heat loss effect during the ignition process. Besides, the fact that the temperature of the IFP is close to
 ${T_s}$ denies the specification of
 ${u_{IFP}} = {u_{\phi ,\tilde{r} = 1}}$ because the temperature at the outer edge of the boundary can never be close to
 ${T_s}$ and thereby hardly support a rapid chemical reaction.
The variation of critical ignition temperature with uniform flow velocity, where the motion of the IFP is taken into account. The black/red/blue solid lines refer to theoretically predicted  ${T_{ig,cr}}$ respectively by (3.53) without motion of the IFP, by revised criterion
 ${\tau _{res}} = {\tau _{ig}}$ equating
 ${u_{IFP}} = {u_{FK}}$ with
 ${F_{ig}}$ calculated based on its definition, i.e. (5.6), and with
 $F_{ig}^{\prime}$ evaluated through the simplified model, i.e. (5.7). The dashed lines denote
 ${T_{ig,cr}}$ values obtained by the revised criterion
 ${\tau _{res}} = {\tau _{ig}}$ corresponding to underestimated residence time with
 ${u_{IFE}} = {\tilde{u}_{\phi, \tilde{r} = 1}}$. The symbols denote results from simulation (Zirwes et al. Reference Zirwes, Zhang, Häber and Bockhorn2019).

6. Conclusions
In this work, we conducted theoretical analysis on the inhomogeneous ignition of a combustible mixture by a hot particle. We revised Semenov's transient ignition criterion by introducing a hypothetical volumetric heat loss coefficient that accounts for the actual temperature inhomogeneity. The revised ignition criterion allows us to determine the critical ignition temperature. The critical ignition temperature is primarily determined by the temperature inhomogeneity, which is quantified by the temperature gradient on the particle surface and depends on the relative motion between the hot particle and the ambient gas. At quiescent conditions with  $\; Re = 0$, the temperature inhomogeneity is caused by pure heat conduction and is dominantly affected by particle size, yielding the result that the critical ignition temperature grows noticeably as the particle radius decreases. At conditions of
 $Re \ll 1$, the creeping flow of the combustible mixture tends to accumulate thermal energy on the rear hemisphere, which leads to non-uniformity of the temperature gradient and thus facilitates ignition at the rear stagnation point. As
 $Re$ continuously increase, flow separation originates from the rear stagnation point and moves upstream. The momentum and thermal boundary layers before the separation point were solved using a Blasius series, and the temperature gradient was obtained. Defining the temperature gradient for ignition, i.e. lowest
 ${(\partial \theta /\partial \tilde{r})_{\tilde{r}}}$ over the particle surface, we derived an explicit formula that correlates the critical ignition temperature with the temperature inhomogeneity and the properties of the flammable mixture relating to its chemical reactivity and molecular transport. The formula can be used to individually quantify the contributions of various transient effects.
Due to the exceedingly large density ratio between the particle and the ambient gas, the unsteadiness of particle cooling due to continuous heat transfer to the combustible mixture was shown to make a negligible contribution to the ignition process. Besides, the finite residence time of the IFP was considered and evaluated in the Frank–Kamenetskii region. The theoretical formula for the critical ignition temperature was revised to include an additional term accounting for the transient effect of a finite residence time of the IFP.
In general, the critical ignition temperature predicted by the present theory agrees well with those obtained in experiments and numerical simulations for methane/air and hydrogen/air mixtures. The discrepancy in quiescent situations can be attributed to the fact that the frequency factor B is evaluated based on relevant data at high temperature and thus overestimates the reaction rate in the low-temperature regime. A revised Arrhenius-type reaction rate model considering the temperature dependence of the pre-exponential factor would improve the theoretical prediction of the critical ignition temperature. In the presence of relative motion between the particle and the ambient gas, the discrepancy in the critical ignition temperature can be attributed to the assumption of constant transport properties. In the present analysis, the viscosity of the ambient premixture is evaluated at the environmental temperature, resulting in overestimation of the Reynolds number. Accordingly, the stronger temperature inhomogeneity at the ignition location corresponds to a higher critical ignition temperature. However, when the temperature dependence of the transport properties is considered, the energy equation for the ambient premixture becomes nonlinear and an analytical solution cannot be obtained.
This work neglects the thermal expansion of the ambient premixture and the radiative heat transfer from the particle. For a particle of sufficiently high temperature, thermal expansion may alter the flow field close to the particle surface, which in turn affects the heat transfer rate and thereby the critical ignition temperature. The thermal radiation of the hot particle may provide an additional route to the heating of the flammable mixture, and the additional time scale for radiative heat transfer may also change the critical ignition temperature. Besides, radical destruction reactions may take place on the particle surface, which modify the local temperature profile and consequently may affect the ignition behaviour. In future works, it would be interesting to take into account these effects. It would be exceedingly difficult to deal with these effects in a theoretical analysis, and thereby numerical simulations maybe conducted instead.
Funding
This work was supported by National Natural Science Foundation of China under Grant Nos. 52006001 and 52176096, and by Opening Fund of State Key Laboratory of Fire Science (SKLFS) under Grant No. HZ2021-KF01.
Declaration of interests
The authors declare no conflict of interest.



