


1. Introduction
A fluid–membrane interaction between a flexible membrane structure and a surrounding unsteady flow is ubiquitous in nature and engineering systems. In the past decades, morphing fins/wings with flexible membrane components have received much attention from the aerospace engineering community in the context of bio-inspired swimming/flying vehicles at moderate Reynolds numbers (Webster & Griffin Reference Webster and Griffin1962; Shyy, Berg & Ljungqvist Reference Shyy, Berg and Ljungqvist1999; Bahlman, Swartz & Breuer Reference Bahlman, Swartz and Breuer2013). During the biological movement with the aid of the morphing structures, a flexible membrane can deform passively and display complex spatial-temporal vibrational dynamics through the flow-excited instability as functions of wing shapes, physical parameters and the boundary conditions (Rojratsirikul et al. Reference Rojratsirikul, Genc, Wang and Gursul2011; Sun, Ren & Zhang Reference Sun, Ren and Zhang2017). Flow-excited instability of a flexible membrane can lead to self-sustained vibrations, the so-called flow-induced vibration, when the fluctuating flows are strongly coupled with the elastic thin membrane structures. Particularly, a frequency synchronization of the vortex-shedding frequency ( $f^{vs}$) and the frequency of the membrane vibrations (
 $f^{s}$) may be established in the coupled fluid–membrane systems under specific conditions, which results in the well-known frequency lock-in phenomenon (Rojratsirikul, Wang & Gursul Reference Rojratsirikul, Wang and Gursul2009; Tregidgo, Wang & Gursul Reference Tregidgo, Wang and Gursul2012). By proper harnessing of such flow-excited instability, one can regulate the membrane kinematics and the vortex-shedding features through the fluid–membrane coupling effect (Song et al. Reference Song, Tian, Israeli, Galvao, Bishop, Swartz and Breuer2008; Gursul, Cleaver & Wang Reference Gursul, Cleaver and Wang2014; Buoso & Palacios Reference Buoso and Palacios2017). The understanding of the coupled fluid–membrane dynamics can facilitate the development of effective control strategies to explore the potential for improved aerodynamic performance and smooth adaptability in a gusty flow.
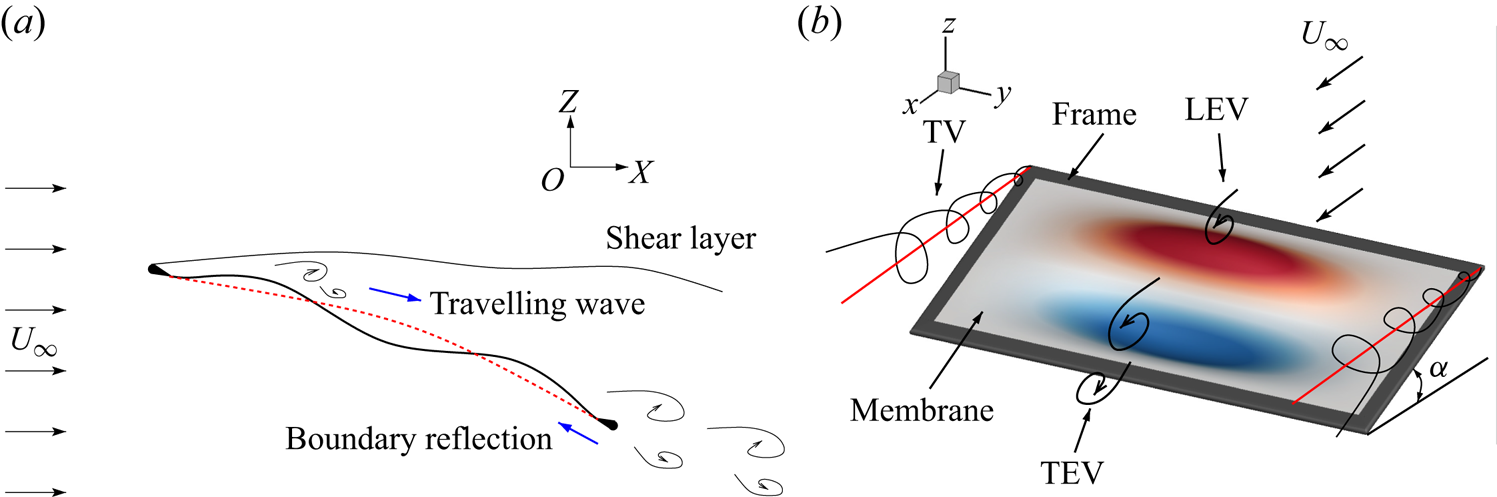
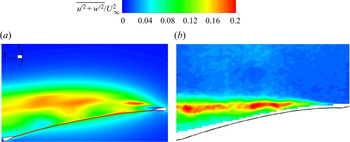
During fluid–membrane interaction, the self-sustained vibration associated with the flow-excited instability is found to appear under certain conditions (Song et al. Reference Song, Tian, Israeli, Galvao, Bishop, Swartz and Breuer2008; Rojratsirikul et al. Reference Rojratsirikul, Genc, Wang and Gursul2011; Bleischwitz, De Kat & Ganapathisubramani Reference Bleischwitz, De Kat and Ganapathisubramani2017). As illustrated in figure 1(a), the perturbation caused by the pressure fluctuations in the shear layer propagates backward and interacts with the flexible membrane to cause vibration. The induced travelling waves and their boundary reflections interact to form intertwined vibrational modes. These multiple vibrational modes further increase the complexity of the flow-induced vibrations. Figure 1(b) shows a representative schematic of the unsteady separated flow past a 3-D rectangular flexible membrane wing vibrating in a chord-wise second and span-wise first mode. Different from the two-dimensional (2-D) membrane, the vibrations and the unsteady flows along the span-wise direction of a 3-D membrane become important in the coupled system. These 3-D effects further make the coupled membrane dynamics more complex and rich. From the perspective of the unsteady separated flow, the leading-edge vortex (LEV), the trailing-edge vortex (TEV) and the tip vortex (TV) are highly coupled with the membrane vibrations. The vibrational energy and the flow kinetic energy are redistributed through the fluid–membrane coupling effect. In the observed frequency lock-in phenomenon, these redistributed energies are mainly concentrated in several specific frequencies of the coupled fluid–membrane system, compared to its rigid counterpart (Serrano-Galiano, Sandham & Sandberg Reference Serrano-Galiano, Sandham and Sandberg2018).
Flow past a flexible membrane wing: (a) schematic of fluid-membrane interaction; (b) illustration of three-dimensional membrane wing with free-stream velocity  $U_{\infty }$ and a given angle of attack
 $\alpha$. In panel (a), the red dashed line indicates the time-averaged membrane shape, and the black solid line represents the instantaneous membrane shape. In panel (b), the red and blue contours are the positive and negative membrane displacements, respectively.

As the governing fluid–structure parameters (e.g. Reynolds number, mass ratio and aeroelastic number) vary, a transition of the dominant aeroelastic modes associated with the vibration and the vortex-shedding process may be observed (Rojratsirikul et al. Reference Rojratsirikul, Genc, Wang and Gursul2011; Bleischwitz, de Kat & Ganapathisubramani Reference Bleischwitz, de Kat and Ganapathisubramani2015; Sun & Zhang Reference Sun and Zhang2016; Bleischwitz et al. Reference Bleischwitz, De Kat and Ganapathisubramani2017; Sun et al. Reference Sun, Ren and Zhang2017). Through numerous investigations, the natural frequency of the flexible membrane was found to play an important role in the flow-induced vibration (Gordnier Reference Gordnier2009; Bleischwitz, De Kat & Ganapathisubramani Reference Bleischwitz, De Kat and Ganapathisubramani2016). However, the processes of flow-induced vibrations of the membrane and the aeroelastic mode transition are not fully understood. The highly nonlinear dependence of the coupled dynamics on the fluid–structure parameters restricts us from gaining a deeper insight into these phenomena. This paper aims to explain how the flow-excited instability governs the 3-D fluid–membrane interaction characteristics and can be linked with the mode transition. Specifically, we examine the coupled fluid–membrane dynamics and the dominant dynamic modes during fluid–membrane interaction. The variation of the natural frequency of the flexible membrane relative to the vortex-shedding frequency is monitored by properly changing the physical parameters.
Recent studies based on experiments and numerical simulations suggested that the characteristics of the flow-induced vibration and the underlying dynamic modes were strongly related to the membrane performance. Some of these investigations primarily focused on the mean dynamic responses of the flexible membrane exposed to an unsteady flow. However, the unsteady dynamic behaviour induced by the flow-excited instability depicted in figure 1(a) plays an important role in the membrane performance (Rojratsirikul et al. Reference Rojratsirikul, Wang and Gursul2009; Serrano-Galiano et al. Reference Serrano-Galiano, Sandham and Sandberg2018). Song et al. (Reference Song, Tian, Israeli, Galvao, Bishop, Swartz and Breuer2008) examined the effects of aspect ratio, compliance and pre-strain values on the unsteady membrane dynamics for a low aspect ratio wing in wind tunnel experiments. The results indicated that the compliant wing can produce larger lift forces and delay stall, compared with its rigid counterpart. Secondary vortices induced by local separation at higher vibrational modes weakened the aerodynamic performance. Moreover, the flow-induced vibrations in the coupled system were found to exhibit different characteristics for membranes with different geometries of the leading and trailing edges (Arbós-Torrent, Ganapathisubramani & Palacios Reference Arbós-Torrent, Ganapathisubramani and Palacios2013; Serrano Galiano & Sandberg Reference Serrano Galiano and Sandberg2016), different excess lengths and pre-strain values (Rojratsirikul, Wang & Gursul Reference Rojratsirikul, Wang and Gursul2010a), and at various flow conditions (e.g. angle of attack and Reynolds number) (Rojratsirikul et al. Reference Rojratsirikul, Wang and Gursul2009). A series of wind tunnel experiments were conducted to study the aeromechanics and near-wake characteristics of flexible membrane wings in and out of ground effect (Bleischwitz et al. Reference Bleischwitz, De Kat and Ganapathisubramani2016, Reference Bleischwitz, De Kat and Ganapathisubramani2017; Bleischwitz, De Kat & Ganapathisubramani Reference Bleischwitz, De Kat and Ganapathisubramani2018). In the experiments, the flexible membrane wings were found to produce a variety of flow features related to different types of flow-induced vibrations. In nature, for example, bats are capable of dynamically changing the material properties through miniature muscles and the high degree-of-freedom skeleton system. Therefore, the material properties also play an important role in the flow-induced vibration and membrane performance. However, only a few investigations on the effects of membrane material properties have been performed to understand the flow-induced vibration in the coupled system.
Concerning the flow-induced vibration phenomenon, various vibrational modes and wake patterns are excited in the coupled system through the flow-excited instability. A mode transition between different aeroelastic modes was observed as the angle of attack (AOA) was changed (Song et al. Reference Song, Tian, Israeli, Galvao, Bishop, Swartz and Breuer2008; Bleischwitz et al. Reference Bleischwitz, de Kat and Ganapathisubramani2015) or under a forced pitching motion (Tregidgo, Wang & Gursul Reference Tregidgo, Wang and Gursul2013). The reason for the mode transition phenomenon during fluid–membrane interaction remains unclear and has not been systematically studied. Once the mode transition is triggered, the altered dominant modes might be fixed at a certain mode within a range of physical parameter space. For example, a typical chord-wise second mode with varied vibrational frequencies was always observed for a 2-D membrane wing with the fixed leading and trailing edges when the AOA exceeded the stall angle at different free-stream velocities (Rojratsirikul et al. Reference Rojratsirikul, Wang and Gursul2009). Similar conclusions have been drawn in wind tunnel experiments for 3-D membrane wings at high incidences (Rojratsirikul, Wang & Gursul Reference Rojratsirikul, Wang and Gursul2010b; Tregidgo, Wang & Gursul Reference Tregidgo, Wang and Gursul2011). Moreover, the occurrence of the chord-wise second mode was independent of the geometries at the leading and trailing edges (Arbós-Torrent et al. Reference Arbós-Torrent, Ganapathisubramani and Palacios2013). Tregidgo et al. (Reference Tregidgo, Wang and Gursul2011) found that the membrane vibrating in the chord-wise second mode was related to the frequency lock-in behaviour of a rigid airfoil. The possible reason was attributed to the strong coupling of the membrane oscillations and the particular vortex-shedding process in the wake.
In parallel to experimental research, some numerical studies have been carried out to gain further insight into the fluid–membrane interaction phenomenon. Some of the earliest relevant works focused on the 2-D linear elastic membrane model with the small deformation assumption in a potential flow (Newman Reference Newman1987) or in a laminar flow (Smith & Shyy Reference Smith and Shyy1995). The recently rapid development in computational fluid dynamics, computational structural dynamics and fluid–structure coupling algorithms has provided a practical and reliable way to investigate various nonlinear membrane dynamics for a wide range of physical parameters. Gordnier (Reference Gordnier2009) developed a computational simulation solver by coupling a high-order Cartesian Navier–Stokes solver and a nonlinear membrane solver to study the 2-D fluid–membrane interaction at low Reynolds numbers. The effects of AOA, the membrane rigidity, the membrane pretension and Reynolds number on the membrane dynamic responses have been investigated. The results confirmed the tight coupling between the membrane oscillations and the vortical structures in the wake, which was similar to the phenomena observed in the experiments (Song et al. Reference Song, Tian, Israeli, Galvao, Bishop, Swartz and Breuer2008; Rojratsirikul et al. Reference Rojratsirikul, Wang and Gursul2009). The evolutions of the nonlinear dynamic behaviour of a 2-D membrane under periodic load (Sun & Zhang Reference Sun and Zhang2016) and the membrane with the perimeter reinforcement (Sun et al. Reference Sun, Ren and Zhang2017; Sun & Zhang Reference Sun and Zhang2017) have been studied systematically. The results indicated that the membrane dynamics were closely dependent on the initial conditions applied to the membrane wing and the material properties. Furthermore, the membrane inertia enlarged the AOA range of a 2-D flexible membrane in a stable state in a laminar flow (Tiomkin & Raveh Reference Tiomkin and Raveh2019). However, the study on the effect of membrane inertia focused on the fluid–membrane interaction at small AOAs without obvious vortex structures. Only a handful of publications on fully coupled 3-D fluid–membrane interaction analysis of flexible membrane dynamics can be found in the literature. Recently, Yang, Dudley & Harris (Reference Yang, Dudley and Harris2018) developed a fluid–membrane interaction solver based on the coupling between a fluid solver and a finite element structural solver and conducted a systematic validation for 3-D membrane dynamics. The numerical results achieved a good agreement with the experimental data (Rojratsirikul et al. Reference Rojratsirikul, Wang and Gursul2009).
In previous studies on the membrane dynamics, the relationship between the natural frequency of the tensioned membrane and the vortex-shedding frequency has been found to play an important role in the coupled system (Song et al. Reference Song, Tian, Israeli, Galvao, Bishop, Swartz and Breuer2008; Rojratsirikul et al. Reference Rojratsirikul, Wang and Gursul2009; Bleischwitz et al. Reference Bleischwitz, de Kat and Ganapathisubramani2015; Waldman & Breuer Reference Waldman and Breuer2017). Different from the fluid–structure interaction problems for freely vibrating rigid bodies with a fixed natural frequency, the natural frequency of the flexible membrane can be changed when the aerodynamic loads are applied to a stretchable membrane surface. A simple linear natural frequency model of a 3-D rectangular flexible membrane with all fixed edges can be given as (Kinsler et al. Reference Kinsler, Frey, Coppens and Sanders1999)
 \begin{equation} f^{n}_{ij}=\frac{1}{2} \sqrt{\frac{N^{s}}{\rho^{s} h}} \left[\left(\frac{i}{c} \right)^{2} + \left( \frac{j}{b} \right)^{2} \right]^{{1}/{2}}, \end{equation}
where  $f^{n}_{ij}$ is the linear natural frequency of the membrane with the chord-wise
 $i$ and span-wise
 $j$ mode. The membrane chord length and the span length are
 $c$ and
 $b$, respectively. Here,
 $N^{s}=E^{s} h \varepsilon ^{s}$ denotes the membrane tension per unit length;
 $E^{s}$,
 $h$ and
 $\varepsilon ^{s}$ represent the Young's modulus, the membrane thickness and the strain of the stretched membrane; and
 $\rho ^{s}$ is the membrane density. For a membrane with fixed geometries,
 $f^{n}_{ij}$ is only dependent on the structural properties (
 $\rho ^{s}$ and
 $E^{s}$) and the strain
 $\varepsilon ^{s}$ caused by the membrane deformation under aerodynamic loads. The variation of the natural frequency estimated from the linear natural frequency equation was examined for flexible membranes with different membrane rigidities, AOAs, Reynolds numbers (Gordnier Reference Gordnier2009) and undergoing pitching motion (Tregidgo et al. Reference Tregidgo, Wang and Gursul2013). The dominant structural mode of the vibrating membrane and the vortex-shedding pattern were also changed, a phenomenon known as mode transition. Song et al. (Reference Song, Tian, Israeli, Galvao, Bishop, Swartz and Breuer2008) reported a series of wind tunnel experiments on membrane wings with different aspect ratios, compliance and prestrain values. The mode transition from the first mode to the higher-order mode was observed. They argued that this mode transition phenomenon was possibly caused by the nonlinear resonance mechanism between the constant vortex-shedding frequency and the reduced natural frequency of the membrane or influenced by the increasing forcing frequency arising from the vortex-shedding process as the Reynolds number increased. However, the employed linear natural frequency model in (1.1) neglects the dynamic stress caused by the nonlinear vibration and the added mass of the vibrating membrane immersed in uniform flow. Thus, this simplified model is not suitable for the analysis of the nonlinear dynamics and the mode transition in a coupled fluid–membrane system with moderate and large amplitude vibrations. A nonlinear natural frequency model that considers the added mass effect is required for further analysis. While some studies have been performed to examine the physics of the flow-induced vibration and the mode transition, the underlying relationship between these phenomena and the role of the natural frequency are not yet fully understood in these coupled systems. The complexity and nonlinearity of the 3-D coupled fluid–structure dynamics pose a serious challenge in the analysis. In addition, a large physical parameter space that governs the flow-induced vibration increases the difficulty to explore the coupled dynamics in a comprehensive manner.
In this study, we present novel physical insights into the coupled fluid–membrane dynamics of an extensible 3-D membrane immersed in unsteady separated flows at moderate Reynolds numbers. Of particular interest is to examine the role of the flow-excited instability and the natural frequency of the 3-D flexible membrane in the coupled fluid–membrane characteristics and the mode transition phenomenon. To shed light on the variation of the flow-induced vibration, we establish the stability phase diagrams in the  $m^{*}$-
 $Re$ space and the
 $m^{*}$-
 $Ae$ space through a series of coupled numerical simulations. New empirical equations of the flow-excited instability boundary demarcated between the DSS and DBS regimes are determined based on our numerical simulations. We employ the global Fourier mode decomposition (FMD) technique (Li, Jaiman & Khoo Reference Li, Jaiman and Khoo2020a) to identify the dominant aeroelastic modes and classify the membrane vibrational states from the vibrating membrane responses. To isolate the impact of the relevant physical parameters on the flow-induced vibration and the membrane dynamics, we investigate the coupled fluid–membrane dynamics as a function of mass ratio
 $m^{*}$, Reynolds number
 $Re$ and aeroelastic number
 $Ae$. We further compare the mode frequency spectra and the energy distributions in the fluid and structural domains based on the FMD analysis. The natural frequency of the tensioned membrane and the vortex structures are important to understand the onset of the flow-induced vibration and the mode transition. An approximate analytical formula of the nonlinear natural frequency of a simply supported 3-D rectangular membrane in uniform flow considering the added mass is derived using the nonlinear structural dynamic equation based on large deflection theory. The vortex-shedding frequencies are measured at the monitoring line in the wake by Fourier-based signal analysis. The natural frequency of the membrane and the vortex-shedding frequency are compared as a function of
 $m^{*}$,
 $Re$ and
 $Ae$. We systematically examine the onset of the flow-induced vibration and the mode transition by monitoring the variation of the natural frequency. The findings and conclusions can be used to promote the development of active/passive control strategies in producing superior aerodynamic performance.
The remainder of this manuscript is organized as follows. In § 2, we briefly introduce the coupled fluid–structure formulation and the global Fourier mode decomposition technique. The description of the fluid–membrane interaction problem and the validation of a 3-D membrane with a supporting rigid frame is conducted in § 3. We present the membrane dynamics as functions of three physical parameters in § 4. The dependence of the flow-induced vibration and the mode transition on the frequency lock-in and the structural natural frequency is further explored. In § 5, the main conclusions of the flow-excited instability are summarized.
2. Numerical methodology
2.1. Coupled fluid–structure formulation
The governing equations for the incompressible unsteady viscous flow with an arbitrary Lagrangian–Eulerian (ALE) reference frame are discretized using the stabilized Petrov–Galerkin variational formulation. The generalized- $\alpha$ method is used to integrate the ALE flow solution in the time domain and it can ensure unconditionally stable and second-order accuracy for linear dynamics problems. The motion equations for a flexible structure are discretized using the standard Galerkin finite element method. The kinematic joints are considered as constraints on the displacement field. A hybrid Reynolds-averaged Navier–Stokes (RANS) and large eddy simulation (LES) model based on the delayed detached eddy simulation treatment is employed to simulate the separated turbulent flow (Joshi & Jaiman Reference Joshi and Jaiman2017). A partitioned iterative coupling algorithm is adopted to integrate the fluid equations and the multibody structural equations. A typical predictor–corrector scheme is used to solve the coupled fluid–structure governing equations. The velocity and traction continuity along the coupling interface with non-matching meshes is satisfied in the fluid–structure coupling procedure. An efficient interpolation scheme through the compactly supported radial basis function (RBF) with a third-order convergence is implemented to exchange coupling data through the fluid–structure interface and to update the mesh in the fluid domain (Joshi, Jaiman & Ollivier-Gooch Reference Joshi, Jaiman and Ollivier-Gooch2020). To avoid the numerical instability caused by significant added mass effect, a recently developed nonlinear interface force correction scheme (Jaiman, Pillalamarri & Guan Reference Jaiman, Pillalamarri and Guan2016) is used to correct and stabilize the fluid forces at each iterative step. The fluid–multibody structure interaction equations and the variational partitioned formulations for the fluid–structure interaction framework have been described by Li, Law & Jaiman (Reference Li, Law and Jaiman2019) in detail. This fluid–structure interaction solver has been validated for an anisotropic flexible wing with supporting battens and covered membrane components (Li et al. Reference Li, Law and Jaiman2019).
2.2. Global Fourier mode decomposition in fluid–membrane interaction
The flexible membrane wing is coupled with the unsteady flow fluctuations to vibrate in a variety of mode shapes. The multi-mode mixed dynamic responses of the membrane vibrations and the vortices with varied scales become an obstacle to identify the dominant aeroelastic modes from the complex coupled system. The global Fourier mode decomposition technique provides an effective way to isolate the most influential modes of interest from the membrane dynamic responses and the surrounding flow field. The global FMD method transfers the spatial-time physical variables to the spatial-frequency data at each spatial position for the whole physical field through the discrete Fourier transform. The phase, the amplitude and the mode energy of each dynamic mode are calculated quantitatively with the aid of FMD. Given the inherent coupling effect between the unsteady flow and the flexible structures in fluid–structure interaction problems, the dynamic modes in the fluid and structure domains should be isolated from the coupled system together. Thus, a direct connection can be established between these aeroelastic modes when exploring the coupling mechanism. The detailed algorithm of the FMD method and its application to a fluid–membrane interaction is presented by Li et al. (Reference Li, Jaiman and Khoo2020a).
3. Numerical set-up and validation
In this section, we provide an overview of the fluid–membrane interaction simulation set-up for a 3-D rectangular flexible membrane wing immersed in a viscous incompressible fluid flow. The 3-D wing consists of a latex rubber membrane sheet and a rectangular stainless steel frame. The thin membrane component has a thickness of  $h=0.2$ mm. The Young's modulus of the latex rubber is
 $E^{s}=2.2$ MPa and its material density is
 $\rho ^{s}=1000$ kg m
 $^{-3}$. The wing with an aspect ratio of two has a chord length of
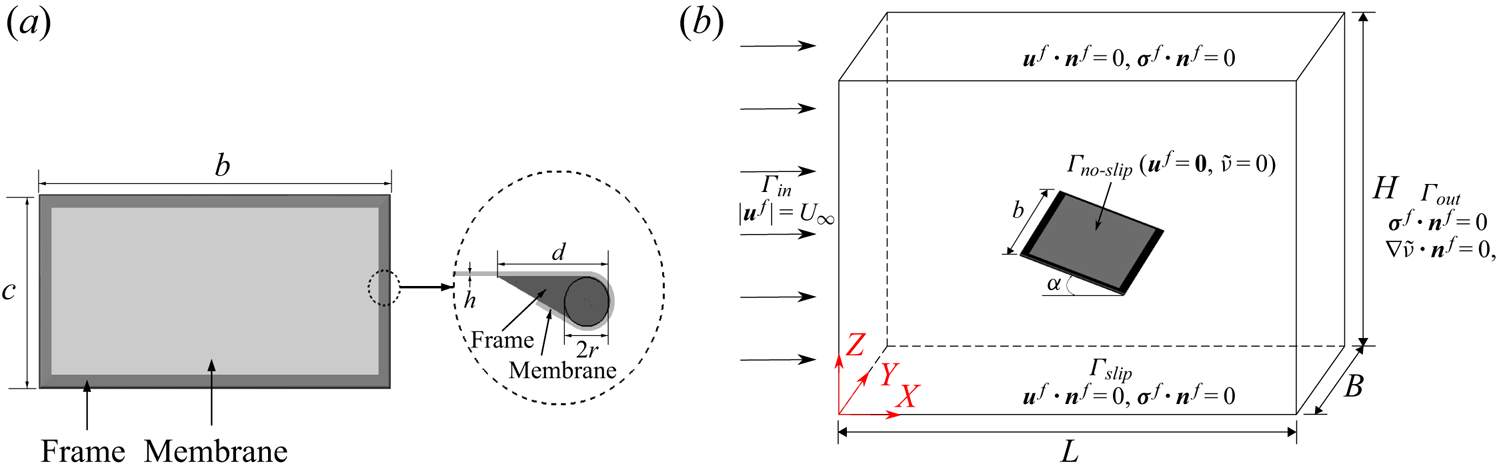
 $c=68.75$ mm. The membrane wing geometry and the information of the support frame section are displayed in figure 2(a). The width of the supporting frame section is
 $d=5$ mm and the diameter of the support rod is
 $2r=2$ mm. Three key non-dimensional physical parameters, namely aeroelastic number
 $Ae$, mass ratio
 $m^{*}$ and Reynolds number
 $Re$, govern the nonlinear dynamic responses of the flexible membrane aerofoils, which are given as
 \begin{equation} Ae=\frac{E^{s} h}{\dfrac{1}{2} \rho^{f} U_{\infty}^{2} c},\quad m^{*}= \frac{\rho^{s} h}{\rho^{f} c}, \quad Re=\frac{\rho^{f} U_{\infty } c}{\mu^{f}}, \end{equation}
where  $\rho ^{f}$ represents the air density,
 $U_{\infty }$ is the free-stream velocity and
 $\mu ^{f}$ denotes the dynamic viscosity of the air.
Three-dimensional computational set-up for a fluid–membrane interaction: (a) membrane wing geometry and support frame section; (b) schematic diagram of computational domain and boundary conditions.

The air load is calculated by integrating the surface traction taking into account the first layer of elements on the membrane surface. The instantaneous lift, drag and normal force coefficients are defined as
 \begin{gather} C_L = \frac{1}{\displaystyle\frac{1}{2} \rho^{f} U_{\infty}^{2} S} \int_{\varGamma} (\boldsymbol{\bar{\sigma}}^{f} \boldsymbol{\cdot} \boldsymbol{n}) \boldsymbol{\cdot} \boldsymbol{n}_z\,\textrm{d} \varGamma, \end{gather}
 \begin{gather}C_D = \frac{1}{\displaystyle\frac{1}{2} \rho^{f} U_{\infty}^{2} S} \int_{\varGamma} (\boldsymbol{\bar{\sigma}}^{f} \boldsymbol{\cdot} \boldsymbol{n}) \boldsymbol{\cdot} \boldsymbol{n}_x \,\textrm{d} \varGamma, \end{gather}
 \begin{gather}C_N = \frac{1}{\displaystyle\frac{1}{2} \rho^{f} U_{\infty}^{2} S} \int_{\varGamma} (\boldsymbol{\bar{\sigma}}^{f} \boldsymbol{\cdot} \boldsymbol{n}) \boldsymbol{\cdot} \boldsymbol{n}_c \,\textrm{d} \varGamma, \end{gather}
where  $\boldsymbol {n}_x$ and
 $\boldsymbol {n}_z$ are the Cartesian components of the unit normal vector
 $\boldsymbol {n}$ to the membrane surface and
 $\boldsymbol {n}_c$ is the unit normal vector to the chord line. Here,
 $\boldsymbol {\bar {\sigma }}^{f}$ is the fluid stress tensor with
 $\varGamma$ being the surface boundary of the membrane. The pressure coefficient is defined as
 \begin{equation} C_p = \frac{p-p_\infty}{\dfrac{1}{2} \rho^{f} U_{\infty}^{2}}, \end{equation}
where  $p$ and
 $p_\infty$ are the pressure at the local point and the pressure at the far-field, respectively.
A sketch of the 3-D computational domain used for the fluid–membrane interaction problem is shown in figure 2(b). We set the same length of  $50c$ for the distances between the side walls (
 $\varGamma _{slip}$) on the top and bottom as well as those on both sides and the distance between inlet (
 $\varGamma _{in}$) and outlet (
 $\varGamma _{out}$) boundaries. A uniform flow velocity
 $\boldsymbol {\bar {u}}^{f}=(u^{f}, v^{f}, w^{f})$ is set at the inlet boundary
 $\varGamma _{in}$ for the computational domain. The boundary condition on the top, bottom and both sides boundaries (
 $\varGamma _{slip}$) is defined as the slip-wall boundary condition. We apply a traction-free boundary condition for the outlet boundary
 $\varGamma _{out}$, where
 $\sigma _{xx}=\sigma _{yx}=\sigma _{zx}=0$. A no-slip boundary condition is applied on the membrane wing surface. The structural model of this rectangular membrane wing includes the rigid body elements to model the rigid frame and the geometrically exact co-rotational shell elements to simulate the elastic membrane. A clamped boundary condition with all fixed degrees of freedom is imposed on the rigid frame.
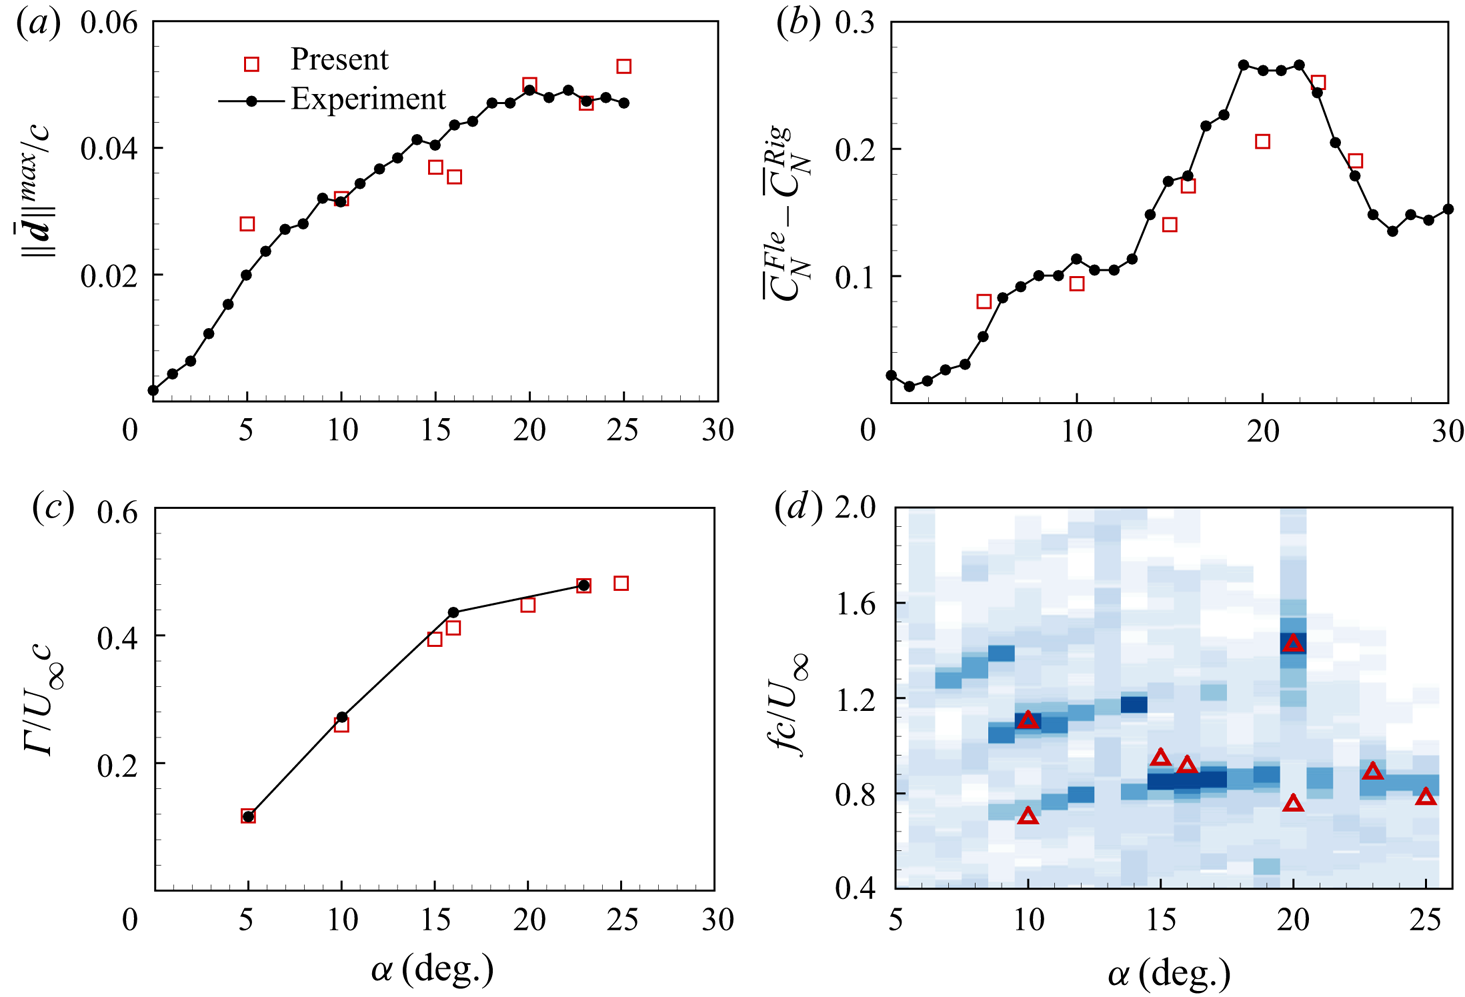
Before we proceed to the validation of the employed fluid–structure interaction solver for this 3-D flexible membrane, a systematic convergence study is performed for the adequacy of mesh resolution and time step size. The convergence results are summarized in Appendix A. At different AOAs, we next compare the membrane displacements, the aerodynamic forces, the membrane vibration frequency and the unsteady flow features with the experimental data (Rojratsirikul et al. Reference Rojratsirikul, Wang and Gursul2010b, Reference Rojratsirikul, Genc, Wang and Gursul2011) in Appendix B. Overall, the coupled fluid–membrane dynamics are well captured by our high-fidelity aeroelasticity solver and the results match reasonably well with the experimental data. A detailed validation study and the comparisons with other numerical simulations can be found in Li, Khoo & Jaiman (Reference Li, Khoo and Jaiman2020b). Notably, the coupled fluid–membrane dynamics of 2-D flexible membrane predicted by our high-fidelity solver and the numerical solver of Gordnier (Reference Gordnier2009) were found to have an excellent agreement. A validation study for a 3-D rectangular membrane wing was also presented by Li et al. (Reference Li, Khoo and Jaiman2020b) along with the comparison with the simulation results of Gordnier & Attar (Reference Gordnier and Attar2014). Owing to the differences in the underlying fluid–structure interaction formulations and the choice of turbulence modelling in our present solver and that of Gordnier & Attar (Reference Gordnier and Attar2014), some discrepancies were observed in the unsteady flow features for the 3-D set-up of a flexible membrane wing. In addition to the solver details, these discrepancies can be also attributed to differences in the post-processing such as the time window selected for the time average calculation and the time instant chosen for plotting the instantaneous membrane dynamics. Further investigation will be helpful to consolidate some of these numerical solvers for 3-D unsteady flow–membrane interactions with turbulence effects.
4. Results and discussion
The current study aims to investigate the role of the flow-excited instability in a coupled system for a 3-D membrane immersed in an unsteady separated flow. To fully understand the onset of the flow-induced membrane vibration and the mode transition phenomenon, we systematically simulate the membrane dynamics of the 3-D rectangular membrane wing over a wide range of parameter space at a representative AOA of  $\alpha =15^{\circ }$ with an apparent separated flow. Different stability regimes can be classified from the phase diagrams and the new empirical solutions of the flow-excited instability boundary are determined by using our high-fidelity numerical simulations. The dominant aeroelastic mode is further identified through the FMD analysis when the flow-induced vibration occurs. To examine the connection between the natural frequency of the tensioned membrane and the vortex-shedding frequency, we systematically study the effect of mass ratio, Reynolds number and aeroelastic number on the membrane dynamics. We further discuss the onset of the flow-induced vibration and the mode transition in the coupled system by correlating with the variation of the natural frequency of the flexible membrane.
4.1. Flow-excited membrane instability
4.1.1. Classification of membrane states
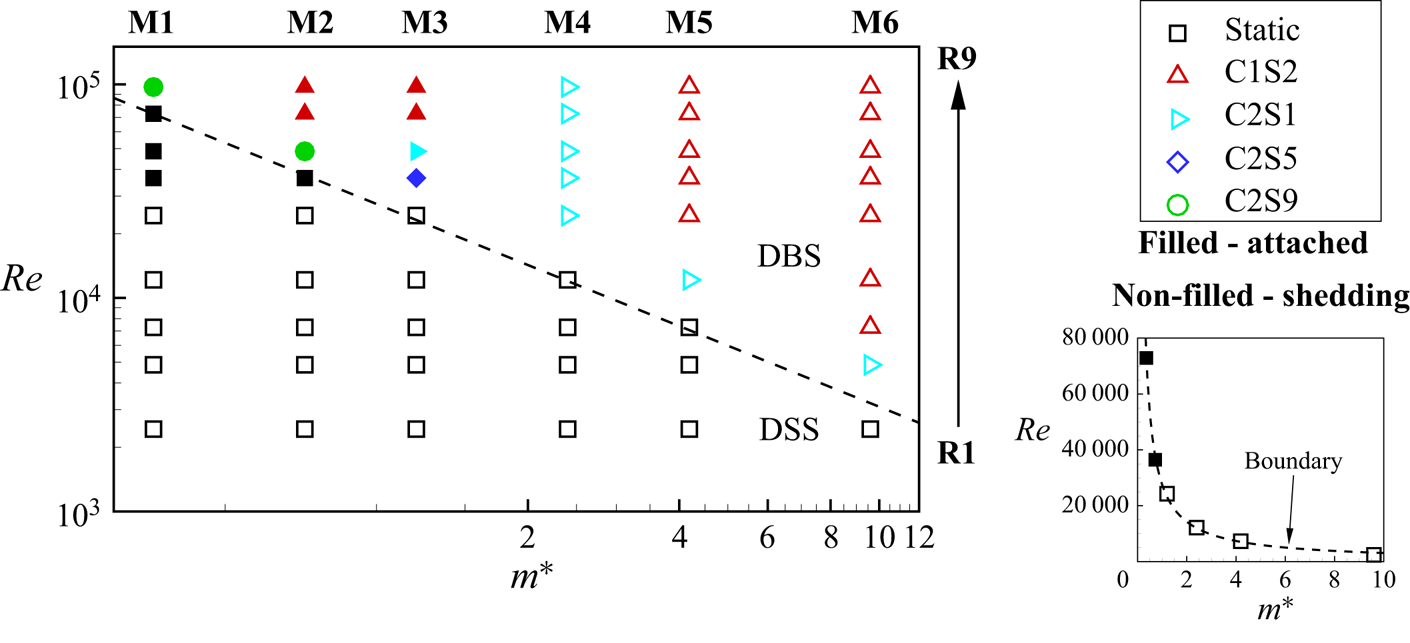
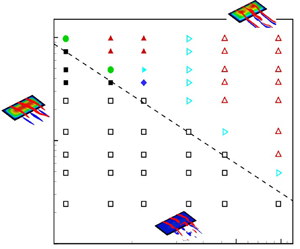
Before we proceed to exploring the flow-induced membrane vibration and the mode transition, we simulate the coupled 3-D rectangular membrane dynamics as functions of mass ratio and Reynolds number. Six groups of mass ratios (M1 $\to$6) within [0.36, 9.6] and nine sets of Reynolds numbers (R1
 $\to$9) ranging from 2430 to 97 200 are chosen to form the parameter space to ensure that the flow-excited instability can be characterized. Figure 3 shows the stability phase diagram and the classification of the membrane states over the full parameter space. Two distinct stability regimes are observed from the stability phase diagram termed as a deformed steady state (DSS) and a dynamic balance state (DBS). These two stability states are termed from the perspective of the tension force involved in the nonlinear natural frequency model presented in (C18) in Appendix C. The membrane within the DSS regime refers to the membrane that is statically deformed under the aerodynamic loads and finally reaches a steady state. Meanwhile, the inherent tension force
 $N^{s}=E^{s}h \varepsilon ^{s}$ caused by membrane deformations is statically balanced with the aerodynamic loads
 ${\rm \Delta} p$. The dynamic balance state is achieved when the dynamically changing tension force is balanced with the unsteady aerodynamic forces and the inertial forces. The membrane vibrates with a limited amplitude within the DBS regime. It can be seen from figure 3 that the flexible membrane maintains a static equilibrium state at low
 $Re$ for light membrane structures. For brevity, the Young–Laplace equation can be employed here to describe the deformed steady state of the membrane (Song et al. Reference Song, Tian, Israeli, Galvao, Bishop, Swartz and Breuer2008; Waldman & Breuer Reference Waldman and Breuer2017), which can be written as
 \begin{equation} E^{s} h + \frac{{\rm \Delta} p}{\varepsilon^{s} \kappa^{s}} = 0, \end{equation}
where  $\kappa ^{s}$ is the curvature of the deformed membrane. In the current simulation, the first term in (4.1) remains a constant value over the full
 $m^{*}$-
 $Re$ parameter space because the Young's modulus
 $E^{s}$ and the thickness
 $h$ are fixed. The values of the aerodynamic loads
 ${\rm \Delta} p$, the membrane strain
 $\varepsilon ^{s}$ and the curvature
 $\kappa ^{s}$ of the deformed membrane are dependent on Reynolds number
 $Re$ and mass ratio
 $m^{*}$. Thus, the ratio
 $R$ in the second term can be written as a function of
 $Re$ and
 $m^{*}$, expressed as
 $R={{\rm \Delta} p}/{\varepsilon ^{s} \kappa ^{s}}=f(Re,m^{*})$. In other words, the ratio
 $R$ remains constant as
 $Re$ and
 $m^{*}$ vary. Through our high-fidelity numerical simulations, the flow-excited instability boundary between the DSS regime and the DBS regime can be observed in figure 3, which is plotted as a dashed line. The flow-excited instability boundary described by the function of
 $Re$ and
 $m^{*}$ should satisfy the relationship shown above. Based on the simulation results, a new empirical relation that governs the flow-excited instability boundary curve can be expressed as
 \begin{equation} Re_{cr}=c_0+c_1(m^{*})^{n}, \end{equation}
The above relationship is constructed using the numerical simulation results for a fixed  $\alpha =15^{\circ }$, where
 $c_0=0$,
 $c_1=27\,550$ and
 $n=-0.9495$. The onset of the membrane vibration related to the flow-excited instability will be discussed further in § 4.5.
Stability phase diagram: non-dimensional Reynolds number  $Re$ (R1
 $\to$9) versus mass ratio
 $m^{*}$ (M1
 $\to$6) for the 3-D flexible membrane at
 $Ae=423.14$ for
 $\alpha =15^{\circ }$. Here, the dashed line is plotted to distinguish the flow-excited instability boundary,
 $\square$ denotes the simulation results corresponding to the deformed steady state and
 $\triangle$,
 $\triangleright$,
 $\Diamond$ and
 $\circ$ respectively represent the chord-wise first and span-wise second mode (C1S2), the chord-wise second and span-wise first mode (C2S1), the chord-wise second and span-wise fifth mode (C2S5) and the chord-wise second and span-wise ninth mode (C2S9) in the dynamic balance state. The label with or without filled colour is the flexible membrane with attached vortices or vortex shedding, respectively.

As the Reynolds number and mass ratio exceed the boundary, it can be inferred from figure 3 that the flexible membrane has a greater tendency for self-excited vibration and a stronger inertia effect on the fluid–structure coupling. Consequently, the inertia effect caused by the membrane vibration should be taken into account. The flexible membrane exhibits complex vibrational behaviour with overlapping structural modes within the DBS regime. With the aid of the proposed FMD method, the most influential aeroelastic mode is identified from the completed membrane responses. To represent the structural mode shapes conveniently, the chord-wise  $i$ and span-wise
 $j$ mode of the 3-D membrane is termed as C
 $i$S
 $j$ in the following discussions. Four typical dominant membrane modes are further classified within the DBS regime. We observe almost attached vortices on the membrane surface within the parameter space of (M1
 $\to$3,R6
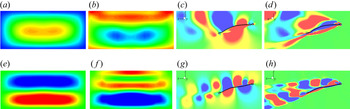
 $\to$9), which is indicated by the filled labels in figure 3. The obvious vortex-shedding process is noticed at the rest parameter space for labels without filled colour. The dominant mode gradually transitions from the chord-wise second mode to the chord-wise first mode as the membrane inertia becomes significant and the Reynolds number increases. In figure 4, we present the dominant chord-wise first and second aeroelastic modes obtained from the membrane dynamic responses based on the FMD method for two representative cases (M6,R5) and (M4,R5) within the DBS regime, respectively. These dominant modes are classified as the corresponding mode energy calculated based on the FMD method is greater than other modes.
Dominant aeroelastic modes of 3-D flexible membrane in DBS regime: (a–d) the chord-wise first and span-wise second mode at (M6,R5) and (e–h) the chord-wise second and span-wise first mode at (M4,R5). Contours are coloured by the real part of the Fourier transform coefficients of membrane displacement on the whole surface (a,e), membrane surface pressure difference (b,f), pressure coefficient fluctuation on the mid-span plane (c,g) and  $y$-vorticity fluctuation on the mid-span plane (d,h).

4.1.2. Coupled fluid–membrane dynamics
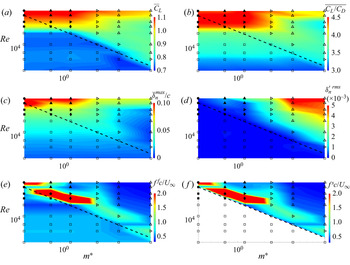
The coupled fluid–membrane dynamic characteristics of the flexible membrane over the given parameter space are summarized in figure 5. The contours are coloured by the time-averaged lift coefficient, the time-averaged lift-to-drag ratio, the normalized maximum time-averaged deflection, the maximum root-mean-squared value (r.m.s.) of the deflection fluctuation, the non-dimensional dominant frequency of the fluid domain and the structural domain via the FMD approach, respectively. Both the  $X$ and
 $Y$ axes are displayed on a logarithmic scale. The dashed line is given by (4.2) to distinguish the instability boundary between the DSS and DBS regimes.
Coupled fluid–membrane dynamic characteristics of the 3-D flexible membrane at  $Ae=423.14$ for
 $\alpha =15^{\circ }$ over the full
 $m^{*}$-
 $Re$ parameter space: (a) time-averaged lift coefficient; (b) time-averaged lift-to-drag ratio; (c) maximum time-averaged non-dimensional membrane deflection; (d) maximum r.m.s. membrane deflection fluctuation; (e) non-dimensional dominant frequency in fluid domain; and (f) non-dimensional dominant frequency in structural domain via the FMD approach. The dashed line is the flow-excited instability boundary given by the empirical solution equation (4.2),
 $\square$ represents the membrane with a deformed steady state and
 $\triangle$,
 $\triangleright$,
 $\Diamond$ and
 $\circ$ denote the dominant modes with the C1S2, C2S1, C2S5 and C2S9 mode shapes, respectively. The blank region in panel (f) represents the deformed steady membrane without vibration.

In the DSS regime, it can be observed from figure 5(a) that the mean lift coefficient maintains similar values. We notice from figures 5(b) and 5(c) that the mean lift-to-drag ratio and the mean membrane deflection are almost independent of  $m^{*}$ at a fixed
 $Re$. As
 $Re$ increases, the aerodynamic efficiency improves substantially. The reason is attributed to the drag reduction caused by the cambered membrane shape. A boundary is noticed in figure 5(d) to separate the DSS and DBS regimes. Because the deformed steady membrane shape remains almost constant as
 $m^{*}$ changes, the dominant frequency of the unsteady flow presented in figure 5(e) does not depend on
 $m^{*}$. The dominant frequency of the structural vibration plotted in figure 5(f) is set to blank within the DSS regime owing to the steady state.
Different from the deformed steady membrane, the aerodynamic characteristics of the oscillating membrane are significantly affected by the interaction of the unsteady separated flow and the membrane vibration. The mean lift coefficient is further improved when the flexible membrane maintains the dynamic balance state. The optimal aerodynamic performance is observed in the parameter space of (M1 $\to$3,R6
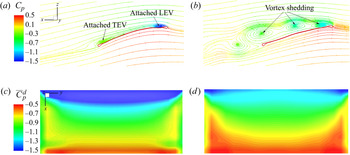
 $\to$9). Meanwhile, we notice the largest membrane deflections and mild membrane vibrations in this region. Through the comparison of the flow features of the flexible membrane for two selected cases (M3,R6) and (M5,R4), the attached vortices at the leading and trailing edges in figure 6(a) enlarge the suction area on the membrane surface shown in figure 6(c). When the light membrane deforms up to some extent at a relatively high
 $Re$ without high-intensity oscillation, the large separated flow region is suppressed and the attached vortices are formed on the membrane surface. It can be seen from figure 6(b) that the vortices cannot stay attached to the membrane surface. These vortices are coupled with the vibrating membrane and shed into the wake alternatively. As a result, the excited separated flow and the vortex-shedding process degrade the aerodynamic performance as compared to the coupled system with attached vortices. A similar distribution of the dominant frequency of the unsteady flow and the membrane vibration is observed in figures 5(e) and 5(f), which results in the frequency lock-in phenomenon.
Comparison of flow features of the flexible membrane with attached vortices (M3,R6) (a,c) and vortex shedding (M5,R4) (b,d) for instantaneous streamlines coloured by pressure coefficient (a,b) and time-averaged pressure coefficient difference  $\overline {C}_p^{d}$ between upper and lower surfaces (c,d).

4.2. Effect of mass ratio
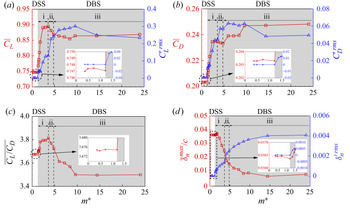
We observe from figure 3 that the membrane exhibits various dynamic behaviours over the studied parameter space. It is found that the mass ratio plays an important role in the flow-induced vibration. To investigate the effect of mass ratio on the coupled fluid–membrane characteristics and to isolate the impact of Reynolds number, we present and compare the evolution of the membrane dynamics as a function of mass ratio at a fixed Reynolds number of 24 300 (R5). This representative Reynolds number selected for this study covers all the typical dynamic states. To fully understand the flow-induced vibration and the mode transition phenomena, extra cases were run for the membrane dynamics near the flow-excited instability boundary and the mode transition region in the range of  $m^{*} \in [0.36,24]$. Figure 7 summarizes the evolution of the force characteristics, the membrane displacements and the membrane vibration intensities as a function of
 $m^{*}$.
Evolution of 3-D membrane dynamics as a function of  $m^{*}$: (a) time-averaged lift coefficient and r.m.s. lift coefficient fluctuation; (b) time-averaged drag coefficient and r.m.s. drag coefficient fluctuation; (c) time-averaged lift-to-drag ratio; and (d) maximum time-averaged normalized membrane deflection and r.m.s. membrane deflection fluctuation.

It can be seen from figure 7 that the aerodynamic force characteristics and the membrane deflections almost remain constant within the range of  $m^{*} \in [0.36, 1.2]$, which leads to no fluctuation in the membrane responses. Similar conclusions can be drawn for the membrane dynamics of the coupled system within the DSS regime at different Reynolds numbers shown in figure 5. We can infer that the inertia effect is neglected during the fluid–membrane interaction when
 $m^{*}$ is less than the critical value. Consequently, a static equilibrium state of the cambered membrane is achieved when the tension force is balanced with the aerodynamic loads acting on the membrane surface.
When the membrane vibration occurs, the flexible membrane enters a dynamic balance state. The inertia effect participates in the dynamics of the coupled system in this regime. With the aid of the global FMD method, three distinct vibrational modes are further identified from the membrane dynamic response, namely (i) chord-wise first mode; (ii) transitional mode; and (iii) chord-wise second mode. The mean lift coefficient and the mean lift-to-drag ratio increase dramatically from the constant values at the deformed steady state to the overall peak values when the membrane vibrates in the chord-wise second mode. As the dominant structural mode gradually transitions from the chord-wise second mode to the chord-wise first mode, the aerodynamic performance begins to degrade. A kink is noticed at the boundary between two types of vibrational modes. The mean lift coefficient and the mean lift-to-drag ratio keep decreasing until approximately constant values are reached at  $m^{*}=9.6$ in the dominant first-mode regime. The drag coefficient jumps to a plain when
 $m^{*}$ approaches the transitional region and more drag penalties are achieved as
 $m^{*}$ further increases. Finally, no obvious increment of the drag coefficient is noticed for a relatively heavy membrane. The mean camber of the membrane decreases continuously within the range of
 $m^{*} \in (1.2, 24]$. The r.m.s. values of the aerodynamic forces and the membrane displacement fluctuations show an overall growing trend in the simulated parameter space, which indicates higher oscillation intensities for a heavier membrane.
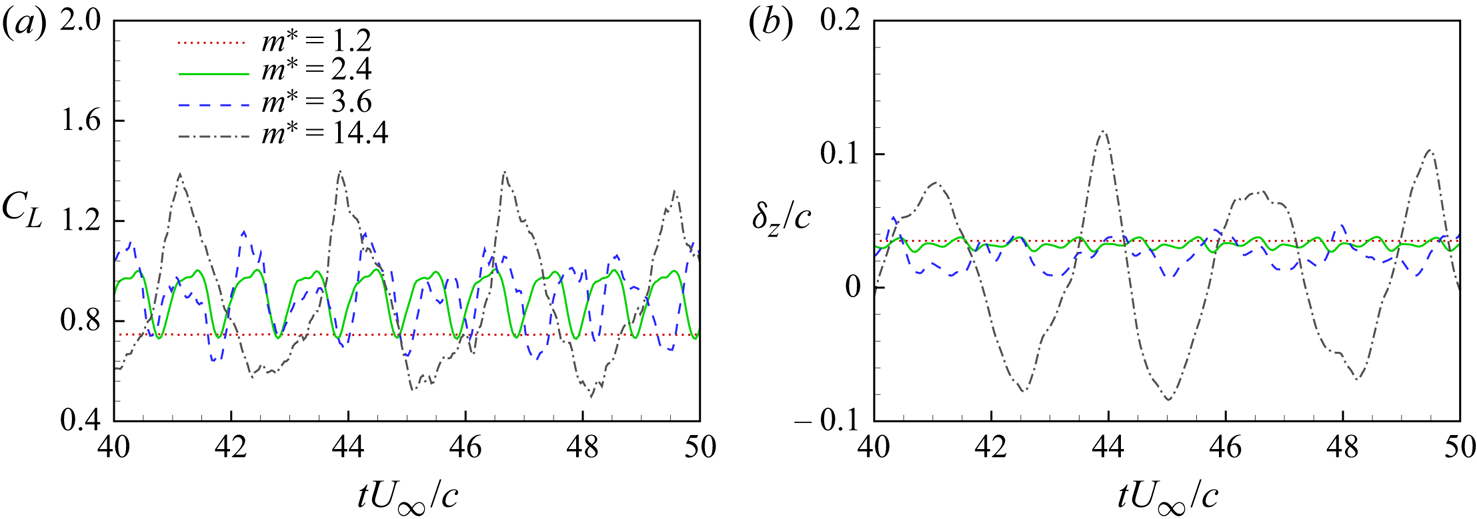
To further investigate the effect of mass ratio, we compare the time histories of the instantaneous lift coefficients and the instantaneous displacement at the membrane centre along the  $Z$ direction in figure 8. We choose one case at
 $m^{*}=1.2$ corresponding to the DSS state and three cases at
 $m^{*}=2.4$, 3.6 and 14.4 for the second mode, the transitional mode and the first mode in the DBS regime, respectively. It can be seen that the time-varying lift coefficient and the time-varying membrane displacement show steady responses at
 $m^{*}=1.2$. As
 $m^{*}$ further increases, both the time-varying lift coefficient and displacement exhibit growing oscillation amplitude and decreasing oscillation frequency. Meanwhile, the dynamic responses gradually change from periodic oscillation to non-periodic oscillation.
Time histories of instantaneous lift coefficients (a) and normalized displacements (b) at the membrane centre along the  $z$-direction for four selected cases with
 $m^{*}=1.2$, 2.4, 3.6 and 14.4 at a fixed
 $Re=24\,300$.

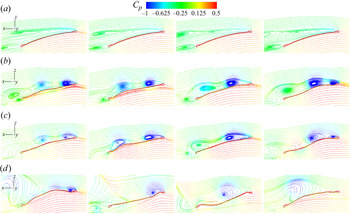
We further examine the instantaneous flow features around the flexible membrane on the mid-span plane for the four selected cases in figure 9. For  $m^{*}=1.2$ in figure 9(a), a large region of separated flows is observed on almost the whole upper surface of the membrane. The large-scale vortex is assembled with the trailing-edge vortex to form a vortex pair behind the membrane, which is similar to a typical von Kármán vortex-shedding process behind a bluff body. As the inertia effect becomes stronger, the flexible membrane vibrates at one of the specific modes within the DBS regime. The generated vortices get closer to the membrane surface, and shed into the wake by coupling with the membrane vibration at
 $m^{*}=2.4$ shown in figure 9(b). It is observed from figure 9(c) that the vortex-shedding pattern changes to the low-frequency response and the first mode occasionally occurs in the transitional regime at
 $m^{*}=3.6$. The first vibrational mode dominates the membrane vibration at
 $m^{*}=14.4$ as plotted in figure 9(d). In this mode, only one apparent large-scale vortex detaches from the surface and sheds into the wake in a completed oscillation period, which is synchronized with the first membrane vibrational mode.
Instantaneous streamlines of 3-D flexible membrane wing on the mid-span plane coloured by pressure coefficient for  $(Re,m^{*})=(24\,300,1.2)$ (a),
 $(24\,300,2.4)$ (b),
 $(24\,300,3.6)$(c) and
 $(24\,300,14.4)$ (d).

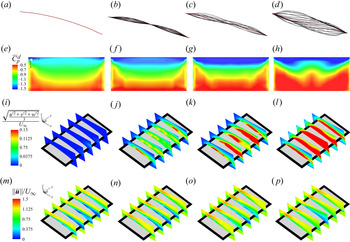
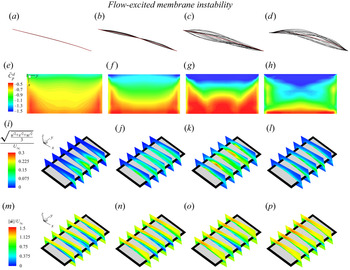
We further compare the membrane dynamics and the flow features in figure 10. Figure 10(a–d) shows the full-body profile responses at the mid-span location for these four representative cases. The red dashed line represents the mean membrane shape. We observe that the membrane deforms and remains a static steady wing shape at  $m^{*}=1.2$. The flexible membrane exhibits a dominant chord-wise second mode at
 $m^{*}=2.4$. As
 $m^{*}$ further increases to 3.6, both the alternatively occurring chord-wise first and second modes are observed in the superimposed membrane responses. Meanwhile, the mean membrane camber becomes smaller compared with that at a lower
 $m^{*}$. The chord-wise first mode dominates the membrane vibration at
 $m^{*}=14.4$. Different from the membrane vibration responses in the second mode and transitional mode regimes, the flexible membrane vibrates on both sides of its rigid flat counterpart in the first-mode regime. Related to the membrane dynamic state, the flow features of the coupled system are also strongly affected by
 $m^{*}$. As the flexible membrane leaves its static equilibrium position to vibrate at
 $m^{*}=2.4$, the suction force in the proximity of the leading edge in the pressure coefficient difference contour becomes larger, as shown in figure 10(f), compared to the suction area plotted in figure 10(e) at
 $m^{*}$=1.2. The extended suction area is related to the generated leading-edge vortices shown in figure 9(b), which contributes to the lift improvement. As the dominant structural mode transitions to the chord-wise first mode, the region with the low negative pressure near the trailing edge expands to the leading edge, which results in the reduction of the lift coefficient at a higher
 $m^{*}$. It can be observed from figures 10(i) and 10(j) that the flow fluctuations in the shear layer become significant and the high-intensity regions get closer to the membrane surface when the flexible membrane loses its deformed steady state. The turbulent kinetic energy (TKE) keeps growing as
 $m^{*}$ further increases. This increasing flow instability is highly coupled with the membrane vibrations with larger amplitudes. Furthermore, the low velocity area within the separation flow regions decreases for heavier membranes in figure 10(m–p).
Flow past a 3-D rectangular membrane wing: (a–d) full-body profile responses of 3-D flexible membrane wing at mid-span location; (e–h) time-averaged pressure coefficient difference between upper and lower surfaces; (i–l) turbulent intensity; and (m–p) time-averaged normalized velocity magnitude on five slices along the span-wise direction at  $(Re,m^{*})=(24\,300,1.2)$ (a,e,i,m),
 $(24\,300,2.4)$ (b,f,j,n),
 $(24\,300,3.6)$ (c,g,k,o),
 $(24\,300,14.4)$ (d,h,l,p). The red dashed line denotes the time-averaged membrane shape in panels (a–d).

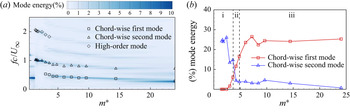
The unsteady separated flows with various spatial-temporal scales and the intertwined structural modes motivate us to build a connection between the dynamic characteristics of the fluid and structural domains. The proposed global FMD technique offers an effective approach to map the membrane vibrations and the unsteady flow together from the spatial-temporal space to the spatial-frequency space. The aeroelastic mode energy is quantitatively calculated to identify the dominant mode. Using the FMD method, we analyse the dynamic responses of the 3-D coupled system in the studied parameter space. The mode energy spectrum for both full 3-D fluid and structural domains is presented in figure 11. The contour is coloured by the mode energy of the decomposed Fourier modes of the  $Y$-vorticity field in the fluid domain at various mass ratios. Only the chord-wise first, second and some high-order structural modes with relatively large mode energies are shown in the mode energy map. The other modes are neglected owing to their weak contributions to the membrane vibrations. Because the membrane achieves a deformed steady state in the range of
 $m^{*} \in [0.36,1.2]$, no vibrational mode is excited in this regime. We find that the flexible membrane maintains a similar cambered wing shape in the deformed steady state, which leads to the same vortex-shedding frequency contents. As
 $m^{*}$ increases higher than 1.2, some structural modes are excited in the coupled system. Meanwhile, the non-dimensional dominant vortex-shedding frequency jumps to
 $fc/U_{\infty }=1.02$ near the flow-excited instability boundary. In the DBS regime, the dominant vortex-shedding frequency (
 $f^{vs}$) is found to lock into the membrane vibration frequency (
 $f^{s}$). The frequency contents of the coupled system show an overall downward trend as
 $m^{*}$ increases. The dominant mode frequency in the fluid domain switches from the higher branch to the lower branch in the transitional mode region when the mode energy of the lower branch exceeds that of the higher branch. From the structural mode energy map shown in figure 11(b), the chord-wise first mode becomes the dominant mode in the membrane vibration responses as its corresponding mode energy is larger than the mode energy of the second mode. Thus, the mode transition phenomenon occurs. Further investigation of the mode transition phenomenon will be discussed in § 4.6.
Mode frequency and energy map of coupled fluid–membrane system based on FMD analysis as a function of  $m^{*}$: (a) comparison of aeroelastic mode frequencies between decomposed Fourier modes of the
 $Y$-vorticity field in the fluid domain and the structural modes with obvious mode energy; and (b) mode energies of the structural first and second modes.

4.3. Effect of Reynolds number
In this section, we further investigate the effect of  $Re$ on the flow-induced vibration and characterize the evolution of the dominant mode and the corresponding mode energy. We choose a series of numerical studies in the parameter space of (M5, R1
 $\to$9) in figure 3, which consists of the concerned flow-induced vibration and the mode transition phenomena. It can be seen from figure 5 that the aerodynamic performance improves and the mean membrane camber as well as the vibration intensity show an overall upward trend as
 $Re$ increases. To gain further insight into the effect of
 $Re$, we compare the instantaneous aerodynamic forces, the unsteady flow features and the membrane vibrations at different Reynolds numbers.
In figure 12, we present the comparison of the time histories of the instantaneous lift coefficients and the instantaneous vertical displacement at the membrane centre at four representative Reynolds numbers ( $R1=2430$,
 $R4=12\,150$,
 $R5=24\,300$,
 $R8=72\,900$). The membrane displacement remains steady at
 $Re=2430$. The oscillation amplitudes of the lift coefficient and the membrane displacement increase at higher
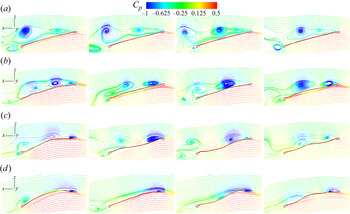
 $Re$ values within the DBS regime. Meanwhile, the dominant frequency of the system gradually transitions to the lower frequency branch. The coupled dynamics tends to be in a non-periodic oscillation. In figure 13, we further display the instantaneous streamlines around the flexible membrane on the mid-span plane. The vortex is generated near the leading edge and convects downstream to form a pair of vortices with the trailing-edge vortex at
 $Re=2430$. Meanwhile, the membrane remains a deformed-steady wing shape. As
 $Re$ increases to 12 150, the flexible membrane interacts with the shed vortices to vibrate in the chord-wise second mode. The wake pattern and the membrane vibrational mode are significantly changed at
 $Re=24\,300$. Both the chord-wise first and second structural modes are observed in figure 13(c). The chord-wise first mode starts to dominate the membrane vibrations at
 $Re=72\,900$ shown in figure 13(d). The separated flow region is greatly suppressed owing to the instantaneous large wing camber. Except for a small vortex near the leading edge, only one main vortex is formed near the mid-chord location of the membrane and sheds into the wake in one completed vibrational cycle.
Time histories of instantaneous lift coefficients (a) and normalized displacements (b) at the membrane centre along the  $z$-direction for four selected cases with
 $Re=2430$, 12 150, 24 300 and 72 900 at a fixed
 $m^{*}=4.2$.

Instantaneous streamlines of 3-D flexible membrane wing on the mid-span plane coloured by pressure coefficient for  $(Re,m^{*})=(2430,4.2)$ (a),
 $(12\,150,4.2)$ (b),
 $(24\,300,4.2)$ (c) and
 $(72\,900,4.2)$ (d).

We further compare the membrane profiles, the mean pressure coefficient difference, the turbulent intensity and the mean velocity magnitude for the selected four cases in figure 14. Consistent with the observation for the membrane vibration states in figure 13, the flexible membrane achieves a deformed steady state at  $Re=2430$. The membrane exhibits a chord-wise second mode, and then transitions to the chord-wise first mode as
 $Re$ further increases. Compared to the pressure difference distribution of the membrane in the DSS regime in figure 14(e), the suction force area in the proximity of the leading edge expands when the membrane vibration is excited. It can be attributed to the longer attached vortices interacting with the membrane vibration. Figure 14(h) shows that the membrane with large camber at
 $Re=72\,900$ enhances the suction area and further improves the aerodynamic performance. The flow fluctuations in the shear layer become stronger and get closer to the membrane surface when the membrane vibration occurs at a higher
 $Re$. The flow fluctuations become weaker at
 $Re=72\,900$, as shown in figure 14(l), owing to the significantly suppressed separated flow for the largely cambered membrane. The low-velocity region becomes smaller at a higher
 $Re$.
Flow past a 3-D rectangular membrane wing: (a–d) full-body responses of 3-D flexible membrane wing at mid-span location; (e–h) time-averaged pressure coefficient difference between upper and lower surfaces; (i–l) turbulent intensity; and (m–p) time-averaged normalized velocity magnitude on five slices along the span-wide direction at  $(Re,m^{*})=(2430,4.2)$ (a,e,i,m),
 $(12\,150,4.2)$ (b,f,j,n),
 $(24\,300,4.2)$ (c,g,k,o),
 $(72\,900,4.2)$ (d,h,l,p). The red dashed line denotes the time-averaged membrane shape in panels (a–d).

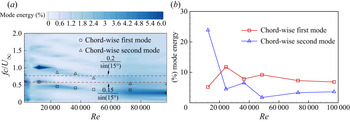
We observe the frequency lock-in phenomenon at various mass ratios in the DBS regime in figure 11. A natural question is to ask whether the frequency lock-in phenomenon also occurs at various Reynolds numbers. To examine the frequency lock-in, we extract the mode energy spectra from the coupled system both in the fluid and structural domains based on the FMD method. Similar to figure 11, we only plot the most energetic structural modes for simplicity. The comparison of the mode energy spectra of the fluid and structural Fourier modes is presented in figure 15(a). The variation of the first and second mode energies as a function of  $Re$ is plotted in figure 15(b). Rojratsirikul et al. (Reference Rojratsirikul, Genc, Wang and Gursul2011) summarized the Strouhal number of the vortex-shedding process for different finite wings over a wide range of
 $Re$. They found that the modified non-dimensional frequency falls in the range of
 $(fc \sin \alpha ) / U_{\infty } \in [0.15, 0.2]$. The two red dashed lines shown in figure 15(a) represent the upper and lower limits of the non-dimensional frequency. We observe the non-dimensional vortex-shedding frequency shows few changes within
 $Re \in [2430,12\,150]$. The dominant non-dimensional vortex-shedding frequency in this parameter space for a deformed-steady membrane falls into the summarized non-dimensional frequency range. This observation is consistent with the conclusion of a flat plate with an almost constant vortex-shedding frequency in the range of
 $Re\in [10^{3}, 10^{5}]$ (Katopodes Reference Katopodes2018). When the membrane vibration occurs, the dominant non-dimensional vortex-shedding frequency jumps from 0.6 to 1.02. A frequency lock-in is noticed in figure 15(a) in the range of
 $Re \in [12\,150,97\,200]$. In figure 15(b), the mode energy of the chord-wise first mode exceeds the mode energy of the chord-wise second mode at
 $Re=24\,300$. The mode transition from the second mode to the first mode is triggered. Thus, the first mode dominates the membrane vibration at a higher
 $Re$.
Mode frequency and energy map of fluid–membrane coupled system based on FMD analysis as a function of  $Re$: (a) comparison of aeroelastic mode frequencies between decomposed Fourier modes of the
 $Y$-vorticity field in the fluid domain and the structural modes with obvious mode energy; (b) mode energies of the structural first and second modes.

Through the studies of the effect of  $m^{*}$ and
 $Re$ on the coupled fluid–membrane dynamics, we find similar phenomena and common characteristics for the onset of the membrane vibration and the mode transition at various mass ratios and Reynolds numbers. The results show that the role of the flow-excited instability in the coupled dynamics at various physical parameters shares some commonalities. In addition to
 $Re$ and
 $m^{*}$, the aeroelastic number
 $Ae$ related to the membrane flexibility is another important parameter to govern the coupled dynamics. To make the findings more general, we also examine the evolution of the coupled fluid–membrane dynamics as a function of
 $Ae$. The purpose is to explore whether the membrane flexibility influences the flow-induced vibration in a similar way to mass ratio and Reynolds number.
4.4. Effect of aeroelastic number
We perform a series of numerical simulations to investigate the role of flexibility in the flow-excited instability. Four sets of aeroelastic numbers (A1 $\to$4) are selected in the simulations and the values are 84.6, 423.14, 1269.42 and 2115.7, respectively. To make the conclusion more comprehensive, we choose three types of mass ratios (M3, M4 and M6) to expand the parameter space, which represents a light wing, a medium weight wing and a heavy wing. The Reynolds number is fixed at
 $Re=24\,300$ and the AOA is set to
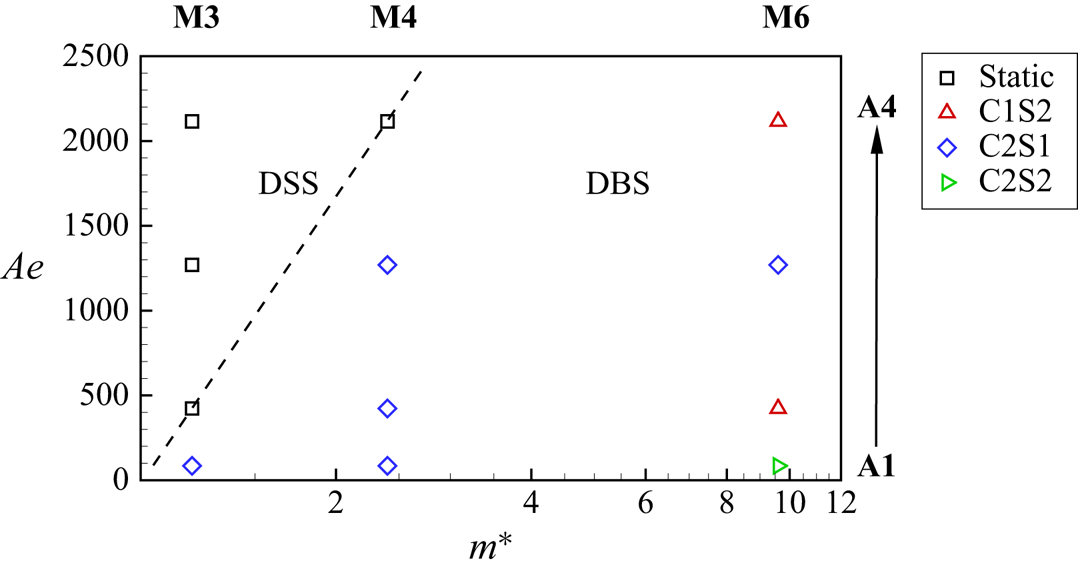
 $\alpha =15^{\circ }$, which makes the membrane immersed in unsteady separated flows. Figure 16 presents the stability phase diagram for the flexible membrane in the parameter space of
 $m^{*}$-
 $Ae$. The dashed line plotted in the figure denotes the flow-excited instability boundary. A new empirical solution of the boundary for the critical aeroelastic number (
 $Ae_{cr}$) is given as
 \begin{equation} Ae_{cr}=c_0+c_1(m^{*})^{n}, \end{equation}
where  $c_0$,
 $c_1$ and
 $n$ are the coefficients determined by numerical simulations or experiments. Two stability regimes, namely DSS and DBS, are also identified from the membrane responses at different parameter combinations, which is the same as the stability phase diagram presented in figure 3. The membrane has a tendency to maintain a deformed steady state when the wing is lighter and more rigid. The flexible membrane leaves its static equilibrium position to vibrate as the effect of the membrane inertia and the flexibility becomes significant in the coupled system. The mode transition between different modes is also observed in the DBS regime in the studied parameter space of
 $m^{*}$-
 $Ae$.
Stability phase diagram: non-dimensional aeroelastic number  $Ae$ versus mass ratio
 $m^{*}$ for the 3-D flexible membrane at
 $Re=24\,300$ for
 $\alpha =15^{\circ }$. Here, the dashed line is plotted to distinguish the flow-excited instability boundary,
 $\square$ denotes the simulation results corresponding to the deformed-steady state and
 $\triangle$,
 $\Diamond$ and
 $\triangleright$ represent the C1S2 mode, the C2S1 mode and the C2S2 mode in the dynamic balance state, respectively.

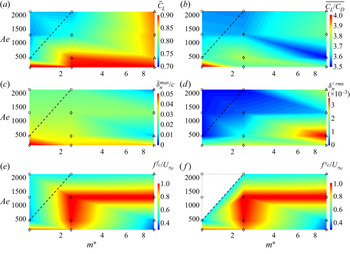
Figure 17 presents the aerodynamic force characteristics and the membrane deflections as well as their fluctuation intensities and the non-dimensional dominant frequencies of the fluid and structural domains using the FMD method in the studied parameter space. We observe from figures 17(a) and 17(b) that the vibrating membrane exhibits overall superior aerodynamic performance than the deformed-steady membrane. The optimal aerodynamic performance and the maximum membrane deflection are noticed for the lightest and most flexible membrane (M3,A1). The dominant frequency distributions summarized in figures 17(e) and 17(f) demonstrate that the frequency of the unsteady flow is synchronized with the frequency of the membrane vibration within the DBS regime. From the above observations, we find that the membrane dynamic responses exhibit rich characteristics as functions of  $m^{*}$ and
 $Ae$. The effect of mass ratio on the coupled fluid–membrane dynamics has been discussed in § 4.2. In this section, we focus on studying the role of the membrane flexibility in the coupled fluid–membrane dynamics and the flow-excited instability for the membranes with three groups of representative mass ratios.
Coupled fluid–membrane dynamic characteristics of the 3-D flexible membrane at  $Re=24\,300$ for
 $\alpha =15^{\circ }$ over the
 $m^{*}$-
 $Ae$ full parameter space: (a) time-averaged lift coefficient; (b) time-averaged lift-to-drag ratio; (c) maximum time-averaged non-dimensional membrane deflection; (d) maximum r.m.s. membrane deflection fluctuation; (e) non-dimensional dominant frequency in fluid domain; and (f) non-dimensional dominant frequency in structural domain through the FMD approach. The blank region in panel (f) represents the deformed-steady membrane without vibration.

For the light membrane with  $m^{*}=1.2$ (M3), there is no mode transition observed in the studied aeroelastic number range. As the aeroelastic number decreases (A4
 $\to$1), the mean lift coefficient, the mean lift-to-drag ratio and the mean membrane displacement increase continuously. The membrane oscillation intensity increases sharply to 0.017 at A1 when the membrane is coupled with the unsteady flow to vibrate. For the medium weight membrane with
 $m^{*}=2.4$ (M4), the membrane loses its aeroelastic static stability at higher
 $Ae$, compared with the light membrane. It can be inferred that a stronger inertia effect can reduce the static stability range. The membrane remains a dominant chord-wise second mode in the DBS regime as
 $Ae$ decreases. When the membrane becomes more flexible, the mean lift coefficient, the mean lift-to-drag ratio and the mean membrane displacement are improved. Meanwhile, the membrane vibrates more violently.
Different from the dynamical response of the light membrane and the medium weight membrane, the dominant mode transitions between different structural modes in the studied  $Ae$ space for the heavy membrane with
 $m^{*}=9.6$ (M6). It is observed from figure 17 that the aerodynamic forces and the membrane deflection fluctuate with the change of
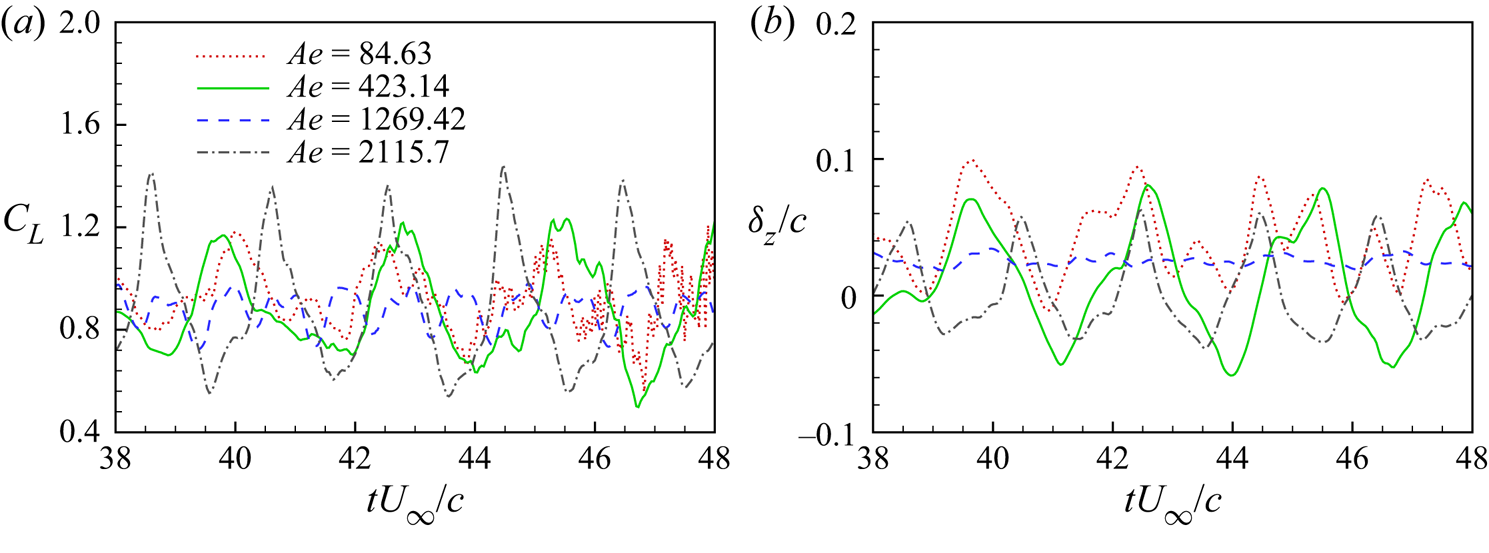
 $Ae$. The overall largest mean lift coefficient and mean lift-to-drag ratio are achieved for the most flexible membrane. Figure 18 plots the time histories of the instantaneous lift coefficient and the instantaneous vertical displacement at the membrane centre at different
 $Ae$ values. Both the time-varying lift coefficient and the time-varying membrane displacement exhibit variations of the amplitude and the dominant frequency as a function of
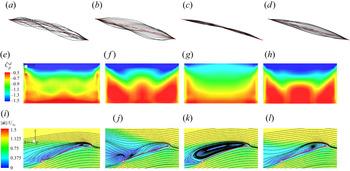
 $Ae$. Figure 19 summarizes the membrane vibration responses, the pressure difference distributions and the flow features of the heavy membrane at different aeroelastic numbers. Both instantaneous chord-wise first and second modes are observed from the full-body profile responses of the most flexible membrane (A1) in figure 19(a). The dominant mode transitions to the chord-wise first mode in figure 19(b) when the aeroelastic number changes to A2. The mean wing camber reduces and the vibration amplitude increases after the mode transition occurs. In figure 19(c), the membrane vibrates in the chord-wise second mode with reduced vibration intensity at
 $Ae=1269.42$ (A3). For the most rigid membrane (A4), the chord-wise first mode becomes the dominant mode in the coupled system. Corresponding to the variation of the membrane vibrations, the flow features are also affected significantly at different dominant modes. A suction area is observed at the leading edge in figure 19(e), which is related to the leading-edge vortex noticed in figure 19(i). The high suction area, represented in blue, at the leading edge reduces slightly and the low suction region, represented in red, near the trailing edge expands to the leading edge, which is caused by the decreased membrane camber and the wake pattern. We notice that the high suction area in the proximity of the leading edge reduces dramatically, as shown in figure 19(g). Meanwhile, a large vortex is formed on the whole membrane surface in figure 19(k). Similar pressure distributions and flow features are observed between the membranes vibrating in the chord-wise first mode at
 $Ae=423.14$ and 2115.7, which results in similar mean lift forces.
Time histories of instantaneous lift coefficients (a) and normalized displacements (b) at the membrane centre along the  $z$-direction for four selected cases with
 $Ae=84.63$, 423.14, 1269.42 and 2115.7 at a fixed
 $m^{*}=9.6$.

Flow past a 3-D rectangular membrane wing: (a–d) full-body responses of 3-D flexible membrane wing at mid-span location; (e–h) time-averaged pressure coefficient difference between the upper and lower surfaces; (i–l) time-averaged streamlines and normalized velocity magnitude on the mid-span plane at  $(Ae,m^{*})=(84.63,9.6)$ (a,e,i),
 $(423.14,9.6)$ (b,f,j),
 $(1269.42,9.6)$ (c,g,k),
 $(2115.7,9.6)$ (d,h,l). The red dashed line denotes the time-averaged membrane shape in panels (a–d).

By exploring the coupled fluid–membrane dynamics as functions of mass ratio, Reynolds number and aeroelastic number, we can see that the flexible membrane becomes coupled with the unsteady separated flow and vibrates when the relevant physical parameters exceed the flow-excited instability boundary. Furthermore, the transition of the dominant mode from a specific mode shape to another mode shape is dependent on the variation in the corresponding modal frequency. There should be an underlying process that dictates the onset of the membrane vibration and the mode transition through certain combinations of the physical parameters. In the following section, the underlying process is explored based on the investigation of the local bluff-body vortex-shedding instability and the nonlinear natural frequency of the tensioned membrane in the studied parameter space.
4.5. Onset of flow-induced membrane vibration
From the aeroelastic mode analysis at different physical parameters, one can see that the frequency of the fluid Fourier mode jumps to the membrane frequency once the self-sustained vibration is established. The onset of the membrane vibration is determined by the fluid–structuralparameters (e.g.  $m^{*}$,
 $Re$,
 $Ae$ and AOA) and the underlying coupled dynamics phenomena such as the vortex shedding, the shear layer fluctuation and the flow-induced tension. It is shown earlier that the membrane can maintain a constant deformed shape in the DSS regime regardless of
 $m^{*}$ when other physical parameters remain fixed. The tension force and the flow features of the stretched steady membrane are not affected by the mass ratio. Among the physical parameters related to the fluid–membrane interaction, only the natural frequency of the membrane is varied as a function of
 $m^{*}$ when the membrane remains a constant cambered shape. Once the mass ratio exceeds the critical value, the membrane starts to vibrate through the frequency lock-in with the vortex-shedding process. A natural question is to ask whether the natural frequency of the tensioned membrane plays an important role in the onset of the membrane vibration and how it affects the flow-excited instability. The variation of
 $m^{*}$ in the coupled fluid–membrane system provides a good starting point to explore the relationship between the natural frequency and the flow-induced vibration. To generalize our finding, the variation of the natural frequency and the flow-induced vibration at different Reynolds numbers and aeroelastic numbers is further studied.
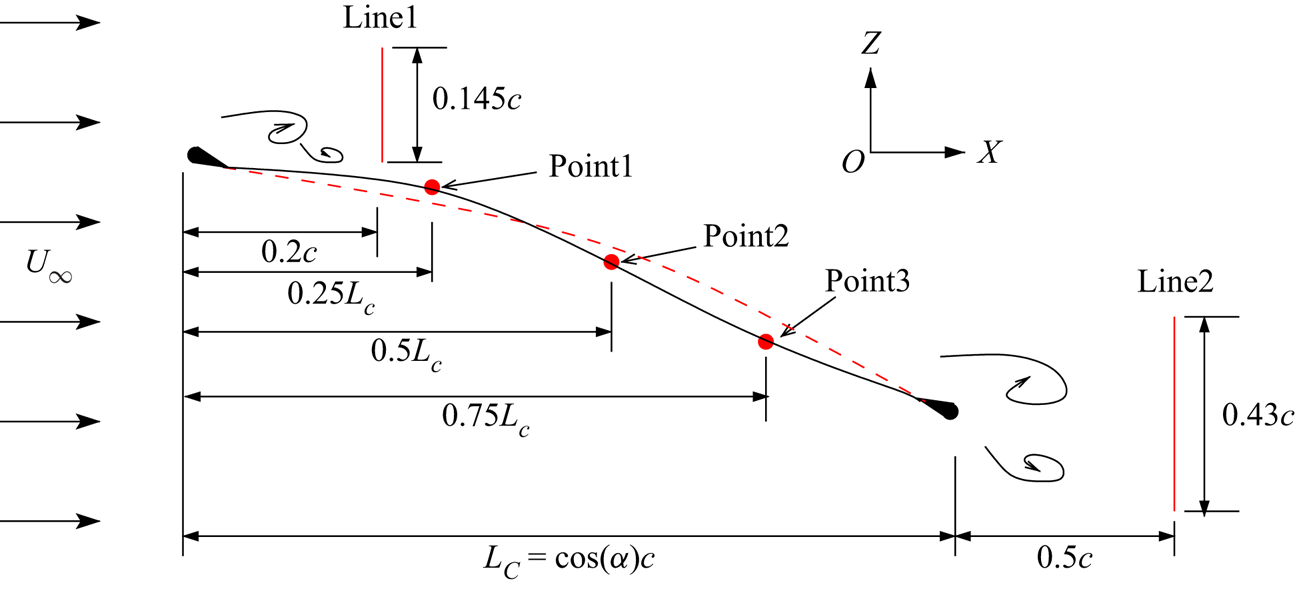
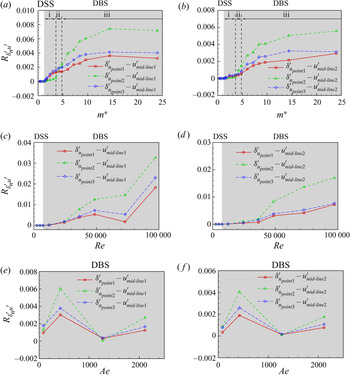
To shed light on the onset of the membrane vibration, the local vortex shedding frequency along a monitoring line near the trailing edge in the wake is calculated to compare with the natural frequency of the membrane in this section. Figure 20 presents a schematic of the positions of the monitoring lines and points. The monitoring line for measuring the local frequency of the leading-edge vortex is placed  $0.2c$ behind the leading edge. The monitoring line corresponding to the trailing edge vortex frequency measurement is located at the half-chord behind the trailing edge. These two vertical lines are chosen at the location which can collect the local flow information significantly. Three monitoring points are placed uniformly on the membrane surface along the membrane chord to collect the local membrane dynamic responses. To understand the mode transition phenomenon, the cross-correlation analysis between the flow fluctuations along the monitoring lines and the membrane vibrations at three points is conducted in the next section.
Schematic of the positions of the monitoring lines and points. The red dashed line indicates the time-averaged membrane shape. The black solid line represents the instantaneous membrane shape.

Similar to Kamm & Grodzinsky (Reference Kamm and Grodzinsky2015), the areal strain is employed to quantize the whole surface distortions under aerodynamic loads. The areal strain is defined as the ratio of the surface area change caused by the flow-induced deformation to the initial surface area, which is given as
 \begin{equation} \varepsilon^{s}_a=\frac{{S}_{deformed}-S_0}{S_0}, \end{equation}
where  ${S}_{deformed}$ denotes the surface area of the deformed membrane and
 $S_0$ is the initial surface area of the membrane without deformation. A schematic of a rectangular membrane as well as its deformed shape and the Gaussian quadrature is plotted in figure 21. The surface area is calculated by integrating the finite element area using the Gaussian quadrature over the whole surface, which is given as
 \begin{equation} S = \sum_{e=1}^{n_{el}}\sum_{p=1}^{n_p} \textrm{{det}}J_e(\eta_p,\xi_p)W_p, \end{equation}
where  $n_{el}$ and
 $n_p$ represent the number of the membrane elements and the Gauss integration points,
 $\eta _p$ and
 $\xi _p$ are the local coordinates of the
 $p$th Gauss node,
 $J_e$ denotes the Jacobian of the
 $e$th membrane element and
 $W_p$ is the Gauss weight. The membrane dynamic responses can be divided into two components: (a) mean deformed shape under aerodynamic loads and (b) vibration around its mean position. The areal strain of the mean shape (
 $\bar {\varepsilon }^{s}_a$) reflects the stretch ratio of the mean cambered membrane to its initial shape, which can be equivalent to the initial stretching strain applied to the membrane edges. The r.m.s. value of the areal strain fluctuation (
 ${\varepsilon ^{s}_a}^{\prime rms}$) is regarded as the vibration intensity of the oscillating membrane.
Schematic of a rectangular membrane with all fixed edges undergoing large amplitude vibration in a uniform flow. A deformed shape and the Gaussian quadrature procedure are illustrated.

To gain further insight into the onset of the membrane vibration, it is important to calculate the natural frequency of the membrane with large amplitude vibration immersed in an unsteady flow. The natural frequency predicted based on the linear model expressed in (1.1) neglects the dynamic stress caused by the geometric nonlinearity of the vibrating membrane. Furthermore, the added mass arising from the oscillating surrounding air is missed in the equation. We derive a nonlinear dynamic equation of the vibrating rectangular membrane shown in figure 21 based on a large deflection theory and consider an analytical aerodynamic pressure model as the external loads. Initial tensions along the  $x$-axis and
 $y$-axis, namely
 $N_{x0}^{s}$ and
 $N_{y0}^{s}$, are applied along the edges. An approximate analytical formula of the nonlinear natural frequency for the simply supported rectangular membrane can be obtained from the nonlinear partial differential equation by the Poincaré–Lindstedt perturbation method. The detailed derivation process of the nonlinear natural frequency formula can be found in Appendix C. The nonlinear natural frequency
 $f_{ij}^{n}$ of a vibrating membrane immersed in an unsteady flow with the chord-wise
 $i$ and span-wise
 $j$ mode is expressed as
 \begin{equation} f_{ij}^{n} = \frac{1}{2 {\rm \pi}} \left( \omega_{ij0} + \frac{3 \beta \kappa \omega_{ij0}}{8}(g_0^{2} + h_0^{2}) \right), \end{equation}
where  $\omega _{ij0}$ is the circular frequency corresponding to the initial tensions applied to the membrane,
 $\beta$ denotes the perturbation parameter in the Poincaré–Lindstedt perturbation method and
 $\kappa$ represents the coefficient of the vibration equation. Here,
 $g_0$ and
 $h_0$ are the initial conditions of the membrane displacement and velocity of the vibrating membrane. The expression of each parameter is given in Appendix C. In (4.6), the second term is caused by the geometric nonlinearity and is related to the membrane vibration amplitude. The dynamic stress caused by the membrane transverse displacement can increase the natural frequency. The added mass
 $m^{am}$ makes the natural frequency smaller than that in a vacuum. Jaiman, Parmar & Gurugubelli (Reference Jaiman, Parmar and Gurugubelli2014) presented a theoretical study of the flow-excited instability of an elastic plate oscillating in fluid. The critical
 $Re$ showed a downward trend with increasing mass ratio, which is consistent with our conclusion for the 3-D membrane. Similar to the theoretical study by Jaiman et al. (Reference Jaiman, Parmar and Gurugubelli2014), the above analytical formulation can be extended to construct the stability boundaries as a function of tension force and mass ratio which can be a scope for future study.
The local non-dimensional frequencies of the dominant vortex and the secondary vortices are calculated based on the Fourier analysis of the collected time-varying vorticity signals along the monitoring Line2. These frequencies reflect the frequency of the aerodynamic load perturbations applied to the flexible membrane. The natural frequency of the tensioned membrane is predicted by (4.6). The initial tensions  $N_{x0}^{s}$ and
 $N_{y0}^{s}$ along two directions can be equivalent to the tensions of the mean deformed membrane shape. The physical parameters required for the prediction of the added mass can be determined from the numerical simulations. The vibration frequency, the vibration amplitude and the related parameters in the second nonlinear term in (4.6) are obtained from the numerical simulations. In the current study, the natural frequencies of the first and second modes along the chord-wise and span-wise directions (C1S1, C1S2, C2S1 and C2S2) are calculated because the excited dominant structural modes are close to these four modes in the examined cases.
Figure 22(a) presents the calculated areal strain of the membrane as a function of  $m^{*}$. The comparison of the vortex-shedding frequencies and the nonlinear natural frequencies of the tensioned membrane as a function of
 $m^{*}$ is plotted in figure 22(b). It can be observed that
 $\bar {\varepsilon }^{s}_a$ remains constant and
 ${\varepsilon ^{s}_a}^{\prime rms}$ stays at zero in the DSS regime. The second term in (4.6) related to the membrane vibration and the dynamic stress vanishes. Moreover, there is no added mass for the static steady membrane. Thus, the natural frequency model of the statically deformed membrane can be reduced to (1.1). Because the tension force remains constant in this regime, the non-dimensional natural frequency of each mode is only dependent on
 $m^{*}$, which gives a relationship as
 \begin{equation} \frac{f^{n}_{ij} c}{U_{\infty}} \sim \sqrt{\frac{1}{m^{*}}}. \end{equation}
Areal strain of mean membrane shape and r.m.s. of areal strain (a,c,e) and comparison of natural frequencies of tensioned membrane and vortex-shedding frequencies measured along Line2 (b,d,f) as a function of  $m^{*}$ at fixed
 $(Re,Ae)=(24\,300,423.14)$ (a,b),
 $Re$ at fixed
 $(m^{*},Ae)=(4.2,423.14)$ (c,d) and
 $Ae$ at fixed
 $(m^{*},Re)=(1.2,24\,300)$ (e,f). The areal strain is calculated by integrating the finite element area from the structural responses. The nonlinear natural frequency is predicted by (4.6) with the aid of numerical simulations.

In the DSS regime, the membrane shape maintains a fixed static equilibrium position. Thus, the flow features around the membrane stay similar and exhibit constant vortex-shedding frequency regardless of  $m^{*}$. The natural frequency of the membrane decreases when the membrane becomes heavier. It is observed from figure 22(b) that the structural natural frequency decreases and gets close to the harmonics of the dominant vortex-shedding frequency near the flow-excited instability boundary. The flexible membrane is coupled with the vortex shedding process to vibrate. Meanwhile, the dominant vortex-shedding frequency jumps from a lower frequency component associated with the bluff-body vortex-shedding frequency to a frequency component locked into the membrane vibration. When the membrane is coupled with the separated flow to vibrate in the DBS regime,
 $\bar {\varepsilon }^{s}_a$ exhibits an overall downward trend and
 ${\varepsilon ^{s}_a}^{\prime rms}$ shows an opposite trend as the inertia effect of the thin structure becomes more significant. Figure 22(b) shows that the dominant vortex-shedding frequency locks into the membrane vibration with the chord-wise second mode in the range of
 $m^{*} \in [1.2,3.6]$. The dominant aeroelastic mode transitions to the chord-wise first mode when the natural frequency of the C1S2 mode becomes close to the dominant frequency of the bluff-body vortex shedding frequency in the transitional mode regime. These approaching natural frequencies in the fluid and structural domains form a new frequency synchronization state through the coupling effect. The common mode transition phenomenon at various physical parameters will be uniformly discussed in § 4.6.
The variations of the areal strain and the nonlinear natural frequency of the coupled system as a function of  $Re$ are presented in figures 22(c) and 22(d), respectively. Similar to Jaiman et al. (Reference Jaiman, Parmar and Gurugubelli2014), we observe from the numerical simulations that the deformation-induced tension is a function of
 $Re$, given as
 $N^{s} \sim Re^{n}$, (
 $0< n<2$). The predicted non-dimensional natural frequency decreases with increasing
 $Re$ and fixed
 $m^{*}$ and
 $Ae$ within the DSS regime as
 \begin{equation} \frac{f^{n}_{ij} c}{U_{\infty}} \sim \frac{1}{Re} \sqrt{N^{s}} \sim Re^{{-}q}, \quad \textrm{{where}}\ q=1-n/2 \quad (0< q<1). \end{equation}
The relationship between the non-dimensional natural frequency and  $Re$ given in (4.8) shows a similar conclusion as that reported by Song et al. (Reference Song, Tian, Israeli, Galvao, Bishop, Swartz and Breuer2008). The areal strain of the membrane exhibits an upward trend in the DSS regime when
 $Re$ increases. Although the membrane slightly deforms in this regime, the non-dimensional dominant vortex-shedding frequency at various
 $Re$ falls into the range of the modified bluff-body vortex-shedding frequency
 $(f^{vs} c \sin \alpha ) / U_{\infty } \in [0.15, 0.2]$ summarized by Rojratsirikul et al. (Reference Rojratsirikul, Genc, Wang and Gursul2011). According to (4.8), the non-dimensional natural frequency of the membrane in the DSS regime becomes smaller at a higher
 $Re$. Once the natural frequency gets close to the harmonics of the vortex-shedding frequency, the membrane starts to vibrate. As
 $Re$ further increases, the areal strain of the mean shape increases slightly, and then rapidly increases at
 $Re=48\,600$ within the DBS regime. Meanwhile,
 ${\varepsilon ^{s}_a}^{\prime rms}$ increases continuously. Under the influence of the increasing
 $Re$,
 $\bar {\varepsilon }^{s}_a$ and
 ${\varepsilon ^{s}_a}^{\prime rms}$, the non-dimensional natural frequency of the vibrating membrane keeps decreasing finally. The dominant vortex shedding frequency transitions to the lower component and locks into the reduced structural natural frequency.
The variations of the areal strain and the nonlinear natural frequency of the coupled system as a function of  $Ae$ are presented in figures 22(e) and 22(f), respectively. Based on the simulation results within the DSS regime, the relationship between the areal strain and the aeroelastic number can be determined as
 $\bar {\varepsilon }^{s}_a \sim Ae^{-n}$, (
 $0< n<1$). As
 $m^{*}$ and
 $Re$ are kept fixed, the non-dimensional natural frequency can be expressed as
 \begin{equation} \frac{f^{n}_{ij} c}{U_{\infty}} \sim \sqrt{Ae \boldsymbol{\cdot} \bar{\varepsilon}^{s}_a} \sim Ae^{q}, \quad \textrm{{where}}\ q=(1-n)/2 \quad (0< q<0.5). \end{equation}
In figure 22(e),  $\bar {\varepsilon }^{s}_a$ increases as
 $Ae$ reduces within the DSS regime. According to (4.9), the non-dimensional natural frequency of the membrane within this regime exhibits a downward trend at a lower
 $Ae$. The membrane vibration is excited when the structural natural frequency approaches the harmonics of the vortex-shedding frequency and the frequency lock-in is formed. Meanwhile, the areal strain of the mean membrane and its oscillating intensity increase dramatically when the membrane vibration occurs at the lowest
 $Ae$.
From the aforementioned analysis, we can infer that the frequency lock-in between the structural natural frequency and the vortex-shedding frequency governs the self-sustained membrane vibration. Although the vortex originating from the leading edge convects downwards and sheds into the wake, as shown in figure 13(a), the membrane still maintains a deformed steady state at  $(Re,m^{*})=(2430,4.2)$. At this condition, the structural natural frequency is far from the vortex shedding frequency and its harmonics. Meanwhile, the flow fluctuations in the shear layer are far from the membrane surface. Through a proper combination of physical parameters, the natural frequency of the membrane can get closer to the dominant vortex-shedding frequency or its harmonics. The membrane is coupled with the unsteady separated flow and builds up the self-sustained vibration through frequency lock-in. It can be easily inferred from figure 22 that the tension force arising from the flow-induced deformation affects the structural natural frequency. Specifically, increasing the tension force can result in a higher structural natural frequency and vice versa. Therefore, the tension force is a key to connect the coupled dynamic characteristics of the fluid flow and the flexible membrane. For an active control of the frequency lock-in, stretching or relaxing the membrane can suppress or excite the membrane vibration by tuning the natural frequency of the membrane.
4.6. Mode transition in flow-induced vibration
Through the investigation of the flow-induced vibration characteristics, the mode transition from one specific aeroelastic mode to another mode is observed in figures 3 and 16 as the physical parameters change. The mode transition can impact the aerodynamic performance, the flow features around the membrane and the membrane vibration response. It is vital to understand the mode transition phenomenon in the coupled system. The results shown in § 4.5 demonstrate that the onset of the membrane vibration is dependent on the frequency lock-in phenomenon. In this section, we explore the mode transition from the perspective of the frequency lock-in phenomenon. Specifically, the variation of the structural natural frequency relative to the vortex-shedding frequency is investigated and the correlation with the dominant aeroelastic modes is established.
In figure 22(b), the natural frequency of the C1S2 mode becomes closer to the dominant frequency of the bluff-body vortex-shedding process at  $m^{*}=2.99$. As
 $m^{*}$ further increases, the dominant mode gradually transitions from the C2S1 mode to the C1S2 mode. As shown in figure 11, the mode energy corresponding to the C1S2 mode exceeds that of the C2S1 mode. It can be observed from figure 9 that the size of the dominant vortex increases as
 $m^{*}$ reaches the transitional region accompanied by the reduced mean camber and the growing vibration amplitude. The variation of these membrane dynamics enhances the bluff-body vortex-shedding process. The flow fluctuations related to the bluff-body vortex-shedding instability become more energetic in the coupled system, which is coupled with the structural C1S2 mode to dominate the system. In figure 22(d), the non-dimensional natural frequency of the C1S2 mode is reduced and approaches the dominant bluff-body vortex-shedding frequency within the range of
 $(f^{vs} c \sin \alpha ) / U_{\infty } \in [0.15, 0.2]$ as
 $Re$ increases. The frequency lock-in between the frequency of the C1S2 mode and the bluff-body vortex shedding frequency is established. The dominant structural mode transitions to the C1S2 mode through the coupling effect. In figure 22(f), the reduction of the aeroelastic number governs the non-dimensional natural frequency to approach the harmonic of the bluff-body vortex-shedding frequency. It can be observed from figures 16 and 19 that the dominant mode transitions between different aeroelastic modes as
 $Ae$ changes. It can be concluded that the mode transition process is dependent on the variation of the natural frequency relative to the vortex-shedding frequency and its harmonics in the coupled system. The original mode synchronization process is interrupted, and a new mode synchronization state is then formed at the dominant coupled frequency, which results in the mode transition phenomenon.
To gain deeper insight into the mode transition phenomenon, cross-correlation analysis is performed based on the high-fidelity numerical data. The cross-correlation function of the discrete time signals  $x(t_n)$ and
 $y(t_n)$ is given as
 \begin{equation} R_{xy} (m) =\frac{1}{N} \sum_{n=0}^{N-m-1} x(t_n) y(t_{n+m}) \quad 0 \le m \le N-1, \end{equation}
where  $R_{xy} (m)$ is the cross-correlation coefficient and
 $N$ is the number of data samples. The time-varying velocity fluctuation signals with 1024 samples are collected at the point in the middle of the monitoring Line1 and Line2. The time-varying membrane deflection fluctuation signals with 1024 samples are obtained at three equispaced points along the membrane chord shown in figure 20. Cross-correlation analysis is conducted between the membrane deflection and the local velocity information near the leading edge and the trailing edge. The purpose is to examine how the correlation between the unsteady flow and the membrane vibration changes in the mode transition phenomenon.
Figure 23 presents the cross-correlation coefficients as functions of  $m^{*}$,
 $Re$ and
 $Ae$. The cross-correlation between the membrane deflection and the velocity is zero in the DSS regime because of the deformed-steady membrane shape. When the membrane vibration occurs, it is found that the flow fluctuations in the wake are strongly correlated with the membrane vibration responses. In figures 23(a) and 23(b), the cross-correlation coefficients at monitoring Point1 and Point3 are close to each other and show much higher values than the cross-correlation coefficients at monitoring Point2 in the range of
 $m^{*} \in [1.2,3.6]$. The results indicate that the unsteady separated flow has a high correlation with the chord-wise second mode. As
 $m^{*}$ further increases to 4.8, the cross-correlation coefficients at monitoring Point2 exceed those values at Point1 and Point3. A stronger correlation between the vortex-shedding process and the chord-wise first mode can be observed after the mode transition. It can be seen from figures 23(c) and 23(d) that the cross-correlation coefficients at monitoring Point2 are smaller than those at monitoring Point1 and Point3 at
 $Re=12\,150$. The cross-correlation coefficients at monitoring Point2 become the largest among the three points as
 $Re$ is further increased. The chord-wise first mode dominates the vibration in the range of
 $Re \in [24\,300,97\,200]$. In figures 23(e) and 23(f), the cross-correlation coefficients at monitoring Point2 are the largest among the three points at
 $Ae=423.14$ and 2115.7 when the chord-wise first mode dominates the membrane vibrations. It can be concluded that the cross-correlation between the flow fluctuations and the membrane vibration is dependent on the dominant aeroelastic mode shape. Once the mode transition occurs, we observe the changes of the cross-correlation coefficients at different positions. Combined with the analysis of the flow features and the membrane vibration responses, this strong correlation in the coupled system can help in designing effective active/passive control strategies to switch the aeroelastic modes by governing the mode transitions. Specifically, the preferred membrane performance can be achieved by changing the structural natural frequency to approach the vortex-shedding frequency or its harmonics via the frequency lock-in. Owing to the mutual dependence between the tension force and the natural frequency, the adjustment of the tension force can offer an effective approach to promote the mode transition.
Cross-correlation between the membrane deflection fluctuation  $\delta _n^{\prime }$ collected at three equispaced points along the membrane surface and the local flow velocity fluctuation
 $u^{\prime }$ measured at the point in the middle of monitoring Line1 near the leading edge (a,c,e) and monitoring Line2 (b,d,f) in the proximity of the trailing edge as a function of
 $m^{*}$ at fixed
 $(Re,Ae)=(24\,300,423.14)$ (a,b),
 $Re$ at fixed
 $(m^{*},Ae)=(4.2,423.14)$ (c,d) and
 $Ae$ at fixed
 $(m^{*},Re)=(9.6,24\,300)$ (e,f).

5. Conclusions
In this study, we systematically investigated the flow-excited instability of a simply supported 3-D rectangular membrane in separated turbulent flow at moderate Reynolds numbers. To examine the underlying coupled membrane dynamics, three non-dimensional physical parameters were selected, namely mass ratio, Reynolds number and aeroelastic number. Two distinctive stability regimes, namely DSS and DBS, were classified from the membrane dynamic responses over a wide range of the selected parameter space. In the parameter space of  $m^{*}$-
 $Re$ and
 $m^{*}$-
 $Ae$, new empirical relationships for the flow-excited instability boundary were determined from the proposed stability phase diagrams through high-fidelity numerical simulations. To classify the dominant vibrational mode of the coupled system, the global FMD method was employed to extract the mode shapes with the most influential mode energy from the overlapped membrane responses at particular mode frequencies. Based on the comparison of the Fourier mode energy spectra between the fluid and structural domains, we observed the frequency lock-in phenomenon at various physical parameters in the DBS regime. A mode transition phenomenon between different aeroelastic modes was observed in the stability phase diagrams, which were related to the variation of the aerodynamic performance and the membrane vibrations. In the DSS regime, the aerodynamic forces and the membrane deformation were almost independent of
 $m^{*}$. The increase of
 $Re$ and membrane flexibility enhanced the aerodynamic performance owing to the growing membrane camber. Compared to the deformed-steady membrane, the membrane vibration caused strong flow fluctuations close to the membrane surface and forced the vortices to attach for longer near the leading edge, which enlarged the suction area and improved the aerodynamic performance. The optimal aerodynamic performance was observed for the lighter and more flexible membrane at a higher
 $Re$.
We further examined the onset of the flow-induced membrane vibration and the mode transition phenomenon in the selected parameter space. The variation of the natural frequency of the tensioned membrane relative to the vortex-shedding frequency was monitored as a function of  $m^{*}$,
 $Re$ and
 $Ae$. Under the aerodynamic loading, the areal strain was calculated to estimate the membrane stretching and its relationship with the natural frequency of the membrane. For the evaluation of the natural frequency, we derived an approximate analytical formula from the nonlinear vibration equation based on large deflection theory coupled with the added mass effect and a simplified pressure loading. By varying the fluid–structure parameters, the comparison between the predicted nonlinear natural frequency of the tensioned membrane and the measured vortex-shedding frequency as well as its harmonics was carried out. The increase in the membrane inertia, the fluid inertia and the membrane flexibility gave rise to a reduction of the non-dimensional structural natural frequency, which resulted in it being closer to the non-dimensional vortex-shedding frequency or its harmonics. Consequently, the vortex-shedding frequency locked into the natural frequency of the tensioned membrane which provided the self-sustained vibration of a flexible membrane. The newly formed coupling between the varied structural natural frequency and the vortex-shedding frequency interrupted the original mode synchronization process, and then generated a new mode synchronization state at the dominant coupled frequency, which resulted in the mode transition phenomenon. From both operations and design perspectives, the proposed fluid–structure analysis offers some guidelines for effective active/passive control designs to achieve desirable performance and membrane vibrational states by adjusting the structural natural frequency through a proper combination of the physical parameters and the tension force.
Funding
G.L. wishes to acknowledge supports from the National University of Singapore and the Ministry of Education, Singapore. R.K.J. would like to acknowledge the support from the University of British Columbia and the Natural Sciences and Engineering Research Council of Canada (NSERC).
Declaration of interests
The authors report no conflict of interest.
Appendix A. Convergence study
We first perform the mesh convergence study to determine a proper mesh resolution for the numerical simulation of the 3-D flexible membrane wing. Three different meshes, namely M1, M2 and M3, are constructed for the numerical simulation. The 3-D computational fluid domain is discretized by an unstructured finite element mesh which consists of 341 821, 823 864 and 1 304 282 eight-node brick elements, respectively. The stretching ratio ( ${\rm \Delta} y_{j+1}/{\rm \Delta} y_{j}$) for the mesh in the boundary layer is set as 1.25 to keep
 $y^{+}$ less than 1.0. We choose a non-dimensional time-step size of
 ${\rm \Delta} t U_{\infty }/c=0.0364$ in all simulations. The structural model is discretized by 160, 228 and 352 structured four-node rectangular finite elements, respectively.
In our simulation, the same parameters obtained from the wind tunnel experiments (Rojratsirikul et al. Reference Rojratsirikul, Wang and Gursul2010b, Reference Rojratsirikul, Genc, Wang and Gursul2011) are set for both the fluid and structure domains. The critical parameters considered for the mesh convergence study are  $Re=24\,300$,
 $U_{\infty }=5$ m s
 $^{-1}$ and
 $\alpha =15^{\circ }$. The chosen physical parameters set the non-dimensional parameters to
 $Ae=423.14$ and
 $m^{*}=2.4$. The flexible membrane is placed in a uniform flow with a freestream velocity of
 $U_{\infty }=5$ m s
 $^{-1}$. The flexible membrane is glued to the rigid frame in a flat shape without pretension. The initial values of membrane displacement and velocity are set to zero. Table 1 summarizes the aerodynamic force characteristics, the non-dimensional dominant vortex-shedding frequency and the structural responses for the meshes M1, M2 and M3. The percentage discrepancies are calculated with respect to the finest mesh M3. The maximum difference between the numerical solutions computed for the meshes M2 and M3 is less than
 $3\,\%$. Therefore, mesh M2 is adequate for the numerical validation study.
Mesh convergence of a 3-D rectangular flexible membrane wing at  $Re=24\,300$,
 $Ae=423.14$,
 $m^{*}=2.4$ and
 $\alpha =15^{\circ }$. The percentage discrepancies in the brackets are calculated with respect to the finest mesh M3.

To perform the time-step size convergence study, we select three non-dimensional time-step sizes of  ${\rm \Delta} t U_{\infty }/c=0.0728$, 0.0364 and 0.0182. Mesh M2 is chosen in the numerical simulation. Physical parameters are set to the same as those in the mesh convergence study. The computed results of
 ${\rm \Delta} t U_{\infty }/c=0.0182$ are the reference to calculate the percentage discrepancies. The membrane responses at three time-step sizes are summarized in table 2. The percentage difference for
 ${\rm \Delta} t U_{\infty }/c=0.0364$ is smaller than
 $3\,\%$. Thus, the time-step size of 0.0364 is selected in the numerical simulations.
Time-step size convergence of a 3-D rectangular flexible membrane wing at  $Re=24\,300$ and
 $\alpha =15^{\circ }$ based on mesh M2. The percentage discrepancies are calculated by using the results of
 ${\rm \Delta} t U_{\infty }/c = 0.0182$ as the reference.

Appendix B. Validation of coupled fluid–structure solver
To validate our coupled fluid–structure solver, we present a comparison of the membrane dynamic responses at  $U_{\infty }=5$ m s
 $^{-1}$ between the experimental measurements (Rojratsirikul et al. Reference Rojratsirikul, Wang and Gursul2010b, Reference Rojratsirikul, Genc, Wang and Gursul2011) and the numerical simulation results in figure 24. The maximum magnitude of the normalized time-averaged membrane deformation is presented in figure 24(a). A difference of the time-averaged normal force coefficient between the flexible membrane wing and a rigid wing counterpart is considered for the plotting purpose in figure 24(b). It can be observed that the overall trends of the membrane deformation and the aerodynamic forces are reasonably well predicted. We further compare the circulation of tip vortices on a cross-flow plane near the trailing edge in figure 24(c). Consistent with the experimental measurements (Rojratsirikul et al. Reference Rojratsirikul, Wang and Gursul2010b), the circulation of the tip vortices is calculated by integrating the vorticity distributions over the measuring surface
 $\varOmega ^{S^{m}}$ covering the tip vortices on the cross-flow plane. In our numerical simulation, the integration of the vorticity is evaluated using the Gaussian quadrature
 \begin{equation} \varGamma = \iint_{\varOmega^{S^{m}}} \boldsymbol{\nabla} \times \boldsymbol{u}^{f} \boldsymbol{\cdot} \textrm{{d}} \boldsymbol{S}^{m} = \sum_{e=1}^{n_{el}} \sum_{p=1}^{n_p} \omega_x(\eta_p,\xi_p) \textrm{{det}}J_e(\eta_p,\xi_p)W_p, \end{equation}
where  $n_{el}$ and
 $n_p$ are the number of the finite elements of the measuring surface and the number of Gauss points, respectively,
 $\eta _p$ and
 $\xi _p$ denote the coordinates of the Gauss nodes,
 $\omega _x$ is the vorticity in the freestream direction,
 $J_e$ is the Jacobian of the
 $e$th element and
 $W_p$ represents the Gauss weight. It can be seen from figure 24(c) that the normalized circulation obtained from our numerical simulation shows good agreement with the experimental results. The frequency spectrum of the membrane vibration at the point with maximum standard deviation in our numerical simulation is analysed using the fast Fourier transform technique. The frequency values at the frequency peaks are plotted in figure 24(d) together with the frequency spectra obtained from experiments for the validation purpose. The dominant frequency contents of the membrane vibration at various AOAs show similar distributions with the experimental results. The magnitude of the turbulent intensity on the mid-span plane at
 $\alpha =16^{\circ }$ obtained from the numerical simulation is presented in figure 25 and the patterns are contrasted against the experimental measurements. It can be observed that the high flow fluctuation region is reasonably well predicted in our simulation.
Comparison of membrane response characteristics between the present simulations and experiments (Rojratsirikul et al. Reference Rojratsirikul, Wang and Gursul2010b, Reference Rojratsirikul, Genc, Wang and Gursul2011) at  $U_{\infty }=5$ m s
 $^{-1}$ for maximum magnitude of the normalized time-averaged membrane deformation (
 $\overline {\|{\boldsymbol d} \|}^{{max}}/c$) (a), time-averaged normal force coefficient difference (
 $\overline {C}_N^{{Fle}}-\overline {C}_N^{{Rig}}$) between the flexible membrane wing and rigid wing (b), normalized circulation (
 $\varGamma /U_{\infty } c$) of tip vortices on a plane perpendicular to the freestream near the trailing edge (c) and membrane vibration frequency at the point with maximum standard deviation (d). Contours in panel (d) are coloured by the frequency spectra of the experimental results (Rojratsirikul et al. Reference Rojratsirikul, Genc, Wang and Gursul2011). The red
 $\triangle$ in panel (d) denotes the dominant frequency contents measured from our numerical simulations.

Magnitude of turbulent intensity on the mid-span plane obtained from present simulation at  $\alpha =16^{\circ }$ (a), experiment (Rojratsirikul et al. Reference Rojratsirikul, Genc, Wang and Gursul2011) at
 $\alpha =16^{\circ }$ (b).

Appendix C. Natural frequency of a vibrating rectangular membrane in a uniform flow
A flexible thin membrane can be excited by the unsteady separated flow which can give rise to a self-excited vibration through the fluid–structure coupling effect. The natural frequency estimated from the linear model in (1.1) ignores the geometric nonlinearity of the vibrating membrane, which overestimates or underestimates the actual natural frequency of a membrane immersed in a uniform flow in the DBS regime. The dynamic tension and the added mass caused by the transverse displacement of the membrane should be taken into account in the analysis of the natural frequency. In this appendix, an analytical formula of the nonlinear natural frequency for a rectangular membrane considering the added mass effect is derived.
Figure 21 presents a schematic of a rectangular membrane with all fixed edges undergoing vibration in a uniform flow. The governing equation of a rectangular membrane vibrating transversely based on the large deflection theory is written as (Amabili Reference Amabili2008)
 \begin{equation} \rho^{s} h \frac{\partial^{2} \delta_n}{\partial t^{2}} - (N_x^{s}+N_{x0}^{s}) \frac{\partial^{2} \delta_n}{\partial x^{2}} - (N_y^{s}+N_{y0}^{s}) \frac{\partial^{2} \delta_n}{\partial y^{2}} - 2N_{xy}^{s} \frac{\partial^{2} \delta_n}{\partial x \partial y} = {\rm \Delta} p(x,y,t), \end{equation}
where  $\rho ^{s}$ and
 $h$ denote the membrane density and the membrane thickness,
 $N_{x0}^{s}$ and
 $N_{y0}^{s}$ are the initial tensions applied to the membrane,
 $N_x^{s}$ and
 $N_y^{s}$ represent the dynamic tensions in the
 $x$ and
 $y$ directions caused by the transverse displacement
 $\delta _n(x,y,t)$, which are given as
 \begin{equation} N_x^{s}=h \sigma^{s}_x,\quad N_y^{s}=h \sigma^{s}_y,\quad N_{xy}^{s}=h \tau_{xy}^{s}, \end{equation}
where  $\sigma ^{s}_x$ and
 $\sigma ^{s}_y$ denote the dynamic stresses along the
 $x$-axis and
 $y$-axis and
 $\tau _{xy}^{s}$ is the shear stress of the membrane. The Kirchhoff stresses for the membrane with isotropic and homogeneous materials are expressed as
 \begin{equation} \begin{bmatrix} \sigma^{s}_x \\ \sigma^{s}_y \\ \tau_{xy}^{s} \end{bmatrix}= \frac{E^{s}}{1-(\nu^{s})^{2}} \begin{bmatrix} 1 & \nu^{s} & 0 \\ \nu^{s} & 1 & 0 \\ 0 & 0 & 1-\nu^{s} \end{bmatrix} \begin{bmatrix} \varepsilon_x^{s} \\ \varepsilon_y^{s} \\ \gamma_{xy}^{s} \end{bmatrix}, \end{equation}
where  $\varepsilon _x^{s}$ and
 $\varepsilon _y^{s}$ represent the strains along the
 $x$ and
 $y$ directions,
 $\gamma _{xy}^{s}$ is the shear strain of the membrane,
 $E^{s}$ is the Young's modulus and
 $\nu ^{s}$ denotes the Poisson ratio. Only the displacement along the
 $z$-axis is considered and the in-plane displacements along the
 $x$-axis and
 $y$-axis are ignored in the nonlinear membrane vibration model. Based on the von Kármán hypothesis, the Green's strains are written as
 \begin{equation} \varepsilon_x^{s}=\frac{1}{2} \left( \frac{\partial \delta_n}{\partial x} \right)^{2},\quad \varepsilon_y^{s}=\frac{1}{2} \left( \frac{\partial \delta_n}{\partial y} \right)^{2}, \quad \gamma_{xy}^{s} = \frac{\partial \delta_n}{\partial x} \frac{\partial \delta_n}{\partial y}. \end{equation}
The pressure difference between the upper and lower surfaces  ${\rm \Delta} p(x,y,t)$ applied to the membrane is caused by the membrane motion in a uniform flow. A simplified inviscid incompressible aerodynamic model is derived by Chen, Wu & Sun (Reference Chen, Wu and Sun2015) to predict the pressure distribution on the membrane surface. The aerodynamic acoustic theory is employed to evaluate the aerodynamic acoustic pressure
 ${\rm \Delta} p_a$ owing to air compression caused by the membrane vibration. A quasi-static model is used to calculate the quasi-static wind pressure
 ${\rm \Delta} p_w$ induced by the shape change of the membrane. The total pressure
 ${\rm \Delta} p$ is a sum of the aerodynamic acoustic pressure
 ${\rm \Delta} p_a$ and the quasi-static wind pressure
 ${\rm \Delta} p_w$, which is expressed as
 \begin{gather} {\rm \Delta} p = {\rm \Delta} p_a + {\rm \Delta} p_w, \end{gather}
 \begin{gather}{\rm \Delta} p_a={-}\frac{2 c \rho^{f}}{i {\rm \pi}} \frac{\partial^{2} \delta_n}{\partial t^{2}}, \end{gather}
 \begin{gather}{\rm \Delta} p_w ={-} \frac{1}{2} \rho^{f} U_{\infty}^{2} \left[\frac{a_{ij}}{\delta_{n0} (\omega_{ij}^{s})^{2} } \frac{\partial^{2} \delta_n}{\partial t^{2}} + \frac{b_{ij}}{\delta_{n0} \omega_{ij}^{s} } \frac{\partial \delta_n}{\partial t} - a_0 \sin \left( \frac{i{\rm \pi} x}{c}\right) \sin \left( \frac{j {\rm \pi}y}{b} \right) \right], \end{gather}
where  $\rho ^{f}$ is the air density and
 $\omega _{ij}^{s}$ denotes the vibration circular frequency for the chord-wise
 $i$ and span-wise
 $j$ mode. Here
 $a_0$,
 $a_{ij}$ and
 $b_{ij}$ represent the shape-change coefficients obtained from the amplitude of the pressure difference coefficient
 $C_{pd0}(t)$ of the numerical simulations or wind tunnel experiments, which is given as
 \begin{equation} C_{pd0}(t) = a_0 + a_{ij} \cos (\omega_{ij}^{s} t) + b_{ij} \sin(\omega_{ij}^{s} t), \end{equation}
where  $C_{pd0}(t)$ is calculated based on the pressure difference coefficient distribution on the membrane surface
 \begin{equation} C_{pd}(t) = C_{pd0}(t) \sin \left( \frac{i {\rm \pi}x}{c} \right) \sin \left( \frac{j {\rm \pi}y}{b} \right). \end{equation}
Equation (C1) can be written in a new form by substituting (C5)–(C7) into (C1) to give
 \begin{align} & \left( \rho^{s} h + m^{am} \right) \frac{\partial^{2} \delta_n}{\partial t^{2}} - (N_x^{s}+N_{x0}^{s}) \frac{\partial^{2} \delta_n}{\partial x^{2}} - (N_y^{s}+N_{y0}^{s})\frac{\partial^{2} \delta_n}{\partial y^{2}} \nonumber\\ &\quad - 2N_{xy}^{s} \frac{\partial^{2} \delta_n}{\partial x \partial y} +c^{am} \frac{\partial \delta_n}{\partial t} = {\rm \Delta} p_0(x,y), \end{align}
where  $m^{am}={2 c \rho ^{f}}/{i {\rm \pi}} + {\rho ^{f} U_{\infty }^{2} a_{ij}}/{2 \delta _{n0} (\omega _{ij}^{s})^{2} }$ and
 $c^{am}={\rho ^{f} U_{\infty }^{2} b_{ij}}/{2 \delta _{n0} \omega _{ij}^{s} }$ are the added mass and the aerodynamic damping, respectively. Here,
 ${\rm \Delta} p_0(x,y)=\frac {1}{2} \rho ^{f} U_{\infty }^{2} a_0 \sin ({i {\rm \pi}x}/{c}) \sin ({j {\rm \pi}y}/{b})$ is a constant value, which is related to the membrane shape.
Substituting (C2)–(C4) into (C10) and neglecting the damping term gives
 \begin{align} & \left( \rho^{s} h + m^{am} \right) \frac{\partial^{2} \delta_n}{\partial t^{2}} - \left(N_{x0}^{s} \frac{\partial^{2} \delta_n}{\partial x^{2}} + N_{y0}^{s} \frac{\partial^{2} \delta_n}{\partial y^{2}} \right) \nonumber\\ &\quad -\frac{E^{s} h}{2(1-(\nu^{s})^{2})} \left[ \left( \frac{\partial \delta_n}{\partial x} \right)^{2} \frac{\partial^{2} \delta_n}{\partial x^{2}} + \left( \frac{\partial \delta_n}{\partial y} \right)^{2} \frac{\partial^{2} \delta_n}{\partial y^{2}} \right] \nonumber\\ &\quad -\frac{E^{s} h \nu^{s}}{2(1-(\nu^{s})^{2})} \left[ \left( \frac{\partial \delta_n}{\partial x} \right)^{2} \frac{\partial^{2} \delta_n}{\partial y^{2}} + \left( \frac{\partial \delta_n}{\partial y} \right)^{2} \frac{\partial^{2} \delta_n}{\partial x^{2}} \right] \nonumber\\ &\quad -\frac{E^{s} h}{1+\nu^{s}} \frac{\partial \delta_n}{\partial x} \frac{\partial \delta_n}{\partial y} \frac{\partial^{2} \delta_n}{\partial x \partial y} = {\rm \Delta} p_0(x,y). \end{align}
To solve the membrane dynamic equation given in (C11), an assumed mode method is adopted to obtain the approximate analytical solution. The membrane displacement in the  $z$ direction can be written as
 \begin{equation} \delta_n(x,y,t) = \sum _{i=1}^{\infty} \sum _{j=1}^{\infty} \sin \left( \frac{i {\rm \pi}x}{c} \right) \sin \left( \frac{j {\rm \pi}y}{b} \right) U_{ij}(t), \end{equation}
where  $U_{ij}(t)$ is an unknown function. Equation (C11) is solved by the Galerkin method to obtain the following equations:
 \begin{equation} \frac{\textrm{{d}}^{2} U_{ij} (t)}{\textrm{{d}} t^{2}} + \omega_{ij0}^{2} U_{ij} (t) + \beta \kappa \omega_{ij0}^{2} (U_{ij}(t))^{3}={\rm \Delta} P, \end{equation}
where
 \begin{gather} \omega_{ij0} = \sqrt{\frac{{\rm \pi}^{2}}{\rho^{s} h + m^{am}} \left[ N_{x0}^{s} \left(\frac{i}{c}\right)^{2} + N_{y0}^{s} \left(\frac{j}{b}\right)^{2} \right]}, \end{gather}
 \begin{gather}\beta = \frac{h^{2}}{cb}, \end{gather}
 \begin{gather} \kappa = \frac{cb}{\omega_{ij0}^{2} h} \left[ \frac{3 E^{s} {\rm \pi}^{4}}{32(1- (\nu^{s})^{2})(\rho^{s} h + m^{am})} \left(\frac{i^{4}}{c^{4}} + \frac{j^{4}}{b^{4}} \right) \right. \nonumber\\ \quad \left. + \frac{3 E^{s} \nu^{s} {\rm \pi}^{4}}{16(1- (\nu^{s})^{2})(\rho^{s} h + m^{am})} \left( \frac{ij}{cb} \right)^{2} - \frac{E^{s} {\rm \pi}^{4}}{16(1+\nu^{s})(\rho^{s} h + m^{am})} \left( \frac{ij}{cb} \right)^{2} \right], \end{gather}
 \begin{gather} {\rm \Delta} P = \int \int {\rm \Delta} p_0(x,y) \sin \left( \frac{i {\rm \pi}x}{c} \right) \sin \left( \frac{j {\rm \pi}y}{b} \right) \textrm{{d}}\kern0.09em x\,\textrm{{d}}y.\end{gather}
A singular perturbation method, namely the Poincaré–Lindstedt perturbation method (Drazin & Drazin Reference Drazin and Drazin1992), is adopted to obtain an approximate analytical solution for the partial differential equation of the vibrating membrane in (C13) by setting  ${\rm \Delta} P$ to zero (Liu et al. Reference Liu, Cai, Peng, Zhang and Lv2018). The approximate analytical formula of the nonlinear natural frequency
 $f_{ij}^{n}$ is given as
 \begin{equation} f_{ij}^{n} = \frac{1}{2 {\rm \pi}} \left( \omega_{ij0} + \frac{3 \beta \kappa \omega_{ij0}}{8}(g_0^{2} + h_0^{2}) \right), \end{equation}
where  $g_0$ and
 $h_0$ are the coefficients corresponding to the initial conditions of the vibrating membrane given as
 \begin{gather} g_0 = \frac{4}{cb} \int_{0}^{c} \int_{0}^{b} \delta_{n0}(x,y) \sin \left( \frac{i {\rm \pi}x}{c} \right) \sin \left( \frac{j {\rm \pi}y}{b} \right) \textrm{{d}}\kern0.09em x\,\textrm{{d}}y, \end{gather}
 \begin{gather}h_0 = \frac{4}{cb} \int_{0}^{c} \int_{0}^{b} \frac{\textrm{{d}} \delta_{n0}(x,y)}{\textrm{{d}}t} \sin \left( \frac{i {\rm \pi}x}{c} \right) \sin \left( \frac{j {\rm \pi}y}{b} \right) \textrm{{d}}\kern0.09em x\,\textrm{{d}}y, \end{gather}
where  $\delta _{n0}(x,y)$ and
 ${\textrm {{d}} \delta _{n0}(x,y)}/{\textrm {{d}}t}=0$ are the initial displacement and velocity of the membrane. When the membrane maintains a static equilibrium state without vibration, the natural frequency of the aerodynamically tensioned membrane is consistent with the linear natural frequency model in (1.1).