





1. Introduction
The wake-flow interaction of vehicles, characterized by turbulence and the formation of low-pressure zones in a vehicle's wake during its motion through air, profoundly influences efficiency. Active and passive flow control techniques offer promising solutions for enhancing stability and energy efficiency (Gad-el-Hak Reference Gad-el-Hak2000). Unlike passive methods that rely on body shape modifications, active control approaches, employing synthetic jets, plasma actuators or microfluidic devices, provide dynamic control over wake dynamics, albeit requiring energy input for actuation.
The combination of wake actuators with parameter optimization, such as using genetic algorithms (GAs), shows promise for optimizing wake-flow dynamics effectively (Wahde Reference Wahde2008). This GA-based optimization methodology has found particular utility in cases involving simplified geometries, where the objective is to identify and employ the most efficient control mechanism capable of modifying wake topology. Illustrative examples can be found in the works of Minelli et al. (Reference Minelli, Dong, Noack and Krajnović2020) and Qiao et al. (Reference Qiao, Minelli, Noack, Krajnović and Chernoray2021), wherein the wake of a D-shaped body was activated for drag reduction by employing synthetic pulsed jets mounted either upstream or downstream of the body, respectively. Furthermore, Li et al. (Reference Li, Noack, Cordier, Borée and Harambat2017) proposed a GA-based wake optimization approach for a squareback Ahmed body, achieving remarkable reductions in drag.
The squareback Ahmed body represents an evolution of the hatchback Ahmed body (Ahmed, Ramm & Faltin Reference Ahmed, Ramm and Faltin1984). By incorporating a rear deck, the hatchback body transforms into a notchback Ahmed body. These three configurations serve as representative examples of typical automotive rear designs. As depicted in figure 1, the wake characteristics of the squareback body are marked by separation vortices that form bubbles adhering to the rear of the vehicle (figure 1a). Conversely, the hatchback body, with its rear slant, introduces additional complexity, with some of the flow attaching to the slant itself (figure 1b). The ratio of separated to attached flow, as well as the shedding frequency of separation, is intricately linked to the slant angle. The notchback body, with its added complexity of a rear deck or ‘decklid’, further complicates the flow dynamics. As illustrated in figure 1(c), flow separated from the upper slant can reattach to the decklid, resulting in a secondary separation. Furthermore, compared with the squareback design, streamwise shedding vortices in the hatchback and notchback configurations emanate from the sides, specifically the C-pillars, of the rear slant.
The wake topology behind typical rear configurations of vehicles: (a) squareback; (b) hatchback; (c) notchback.

Furthermore, the squareback Ahmed body has been demonstrated by Grandemange, Gohlke & Cadot (Reference Grandemange, Gohlke and Cadot2013) to potentially exhibit natural wake bi-stability. Additionally, Sims-Williams, Marwood & Sprot (Reference Sims-Williams, Marwood and Sprot2011) experimentally observed and He et al. (Reference He, Minelli, Wang, Dong, Gao and Krajnović2021a) subsequently confirmed the presence of wake bi-stability behind another variant of the notchback Ahmed body. The wake bi-stability is a particular phenomenon characterized by two asymmetric modes that undergo stochastic switching behaviour, reflecting a mirrored arrangement. An accurate evaluation of the wake states associated with the aerodynamic forces assumes critical importance in terms of stability and drag. However, unlike the extensively studied flow control with regards to squareback (Barros et al. Reference Barros, Borée, Noack, Spohn and Ruiz2016; Li et al. Reference Li, Noack, Cordier, Borée and Harambat2017; Fan et al. Reference Fan, Zhang, Zhou and Noack2020) and hatchback (Joseph, Amandolese & Aider Reference Joseph, Amandolese and Aider2012; Gilliéron & Kourta Reference Gilliéron and Kourta2013; Zhang, Fan & Zhou Reference Zhang, Fan and Zhou2023) cases, the notchback Ahmed body, which manifests more intricate wake structures, has received relatively less attention. In practical terms, the notchback geometry offers valuable insights into the primary flow features observed in commonly used sedan car designs.
Additionally, bi-stable wakes behind the notchback Ahmed body are extremely sensitive to disturbance (He et al. Reference He, Minelli, Su, Gao and Krajnović2022), making them highly responsive to actuation strategies that utilize limited amounts of energy. This paper focuses on developing an effective closed-loop control strategy tailored for the bi-stable wake phenomenon observed behind a notchback Ahmed body. By integrating GA-based optimization and multi-frequency pulsed jets, the study aims to actively modify the wake structure to achieve significant drag reduction. While alternative optimization methods have been explored (Fan et al. Reference Fan, Zhang, Zhou and Noack2020; Li et al. Reference Li, Cui, Jia, Li, Yang, Morzyński and Noack2022; Zhang et al. Reference Zhang, Fan and Zhou2023), GA-based optimization offers simplicity and potential for future comparative studies with other methodologies.
The remainder of the paper is organized as follows. Descriptions of the methodology are presented in § 2. Results are discussed in § 3, including the flow controlling effect and a flow structure analysis behind drag reduction. Conclusions follow in § 4.
2. Methodology
2.1. Wind tunnel experimental set-up
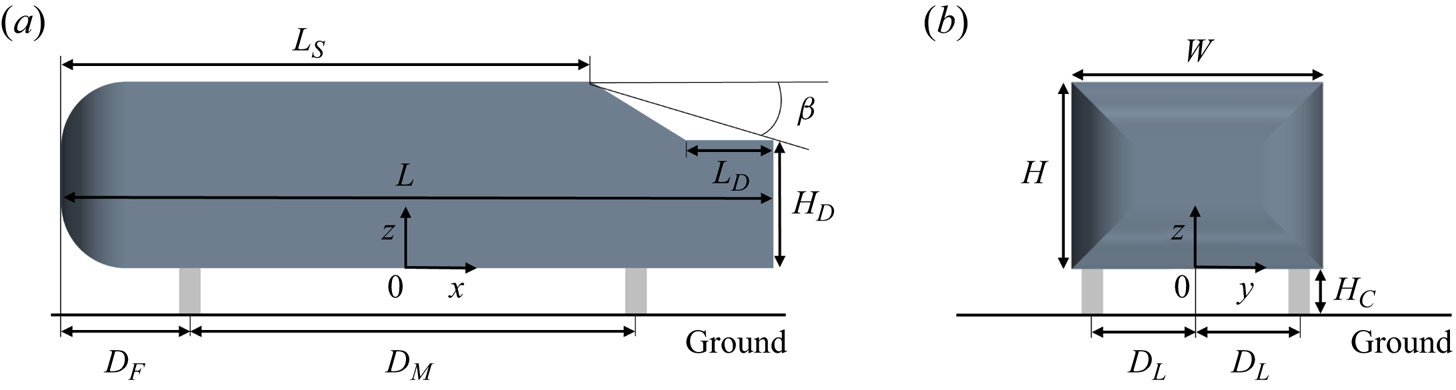
Figure 2 shows a schematic representation of the notchback Ahmed body. The vertical height of the body is  $H=0.192\,{\rm m}$, giving a body width of
 $W=1.35H$ and length of
 $L=3.82H$. The deck, a horizontal structure of the rear body, has a length of
 $L_{D}=0.469H$ and a height of
 $H_{D}=0.687H$. The effective angle is
 $\beta =17.8^{\circ }$, characterizing the line that connects the roof's trailing edge to the deck's trailing edge, giving the length of the roof
 $L_S=2.847H$. To support the model, four cylinders with a diameter of
 $D_C=0.1H$ are utilized, thereby establishing a ground clearance of
 $H_{C}=0.21H$ between the stationary ground and the underbody. The front supporting cylinder is positioned at a distance of
 $D_F=0.7H$ from the leading edge of the body, while the spacing between the front and rear cylinders is
 $D_M=2.42H$. Additionally, the lateral distance between the central body and the cylinders is
 $D_L=0.57H$. The reference axis is interconnected with the model, with the origin of the coordinates situated at the central body length along the
 $x$ direction, at the central section along the
 $y$ direction and at the bottom of the body along the
 $z$ direction.
Geometric model: (a) side view; (b) front view.
Experiments are undertaken at the Chalmers University of Technology in a closed-circuit wind tunnel. Figure 3(a) provides an overview of the test section, with dimensions of  $15.6H$ in length,
 $6.5H$ in height and
 $9.4H$ in width, yielding a blockage ratio of 2.2 %, satisfying the requirement for accurately capturing the phenomena of wake bi-stability (He et al. Reference He, Minelli, Su, Gao and Krajnović2021b). For the measurement of aerodynamic forces, the body is securely attached to an external FFA Y-603 six-component strain gauge balance through supporting cylinders. The balance is capable of measuring drag within a range of 50 N, with an accuracy of
 ${\pm }10^{-2}\,{\rm N}$. The flow turbulence level remains within 0.15 % across a frequency range spanning from 1 Hz to 10 000 Hz. The Reynolds number is
 $Re_H = 2 \times 10^{5}$ based on
 $H$ and the free-stream velocity of
 $U_{inf}=15.73\,{\rm m}\,{\rm s}^{-1}$.
Experimental set-up: (a) schematic diagram of the test section, side view; (b) the pressure taps,  $P_{dl}$ and
 $P_{dr}$, located on the deck.

A Scanivalve system (NetScanner $^{\rm TM}$ model 9116) that exhibits an accuracy of
 ${\pm }0.2\,{\rm Pa}$ for the designated pressure range (
 ${\pm }300\,{\rm Pa}$) with a sampling frequency of 62.5 Hz is employed for monitoring the pressure history. For measuring the wake state, two pressure taps, denoted as
 $P_l$ and
 $P_r$, are symmetrically positioned on the left- and right-hand sides of the deck, respectively (see figure 3b). These pressure taps are situated at a distance of
 $D_P=0.5L_D$ from the trailing edge of the deck. Additionally, the distance between the central body section and the pressure taps is precisely measured as
 ${{\rm d}y}=0.417H$. Thus, the extent of the wake asymmetry is quantified by the spanwise deck pressure gradients,
 ${\delta }$, defined as
 \begin{equation} {\delta}=\frac{C_{p}\left(P_{d r}\right)-C_{p}\left(P_{d l}\right)}{2\,{{\rm d} y} / {H}}, \end{equation}
where  $C_{p}$ represents the sampled pressure coefficient on each monitoring point. According to this definition, a higher absolute value of
 ${\delta }$ indicates a greater level of asymmetry in the wake pattern. Conversely,
 ${\delta }$ of around 0 implies a state of symmetry.
To measure the flow frequency, a computer-controlled three-dimensional traversing mechanism is utilized, equipped with a hotwire sensor. The sensing element of the hotwire is a tungsten wire with a diameter of  $d_{hw}=5 \times 10^{-6}\,{\rm m}$ and a length of
 $l_{hw}=1.25 \times 10^{-3}\,{\rm m}$, resulting in
 $l_{hw}/d_{hw}=250>200$ ensuring an optimal sensor response (Ligrani & Bradshaw Reference Ligrani and Bradshaw1987). The hotwire is connected to a constant temperature circuit (Dantec 56C01 CTA) with an over-heat ratio of 1.7. To enhance the accuracy of the measurements, the signal from the hotwire is taken from 20 000 samples and digitalized at a sampling frequency of 10 000 Hz. Consequently, according to the Nyquist sampling theorem, the resulting reliable frequency range, spanning from 5 to 5000 Hz, facilitates accurate measurements within a Strouhal number range of
 $0.06< St_H <61.03$.
Particle image velocimetry (PIV) images are recorded using a high-resolution Lavision Imager ProX charge coupled device. The camera boasts a resolution of  $2048\text { pixels} \times 2048\text { pixels}$, with each pixel measuring
 $7.4 \times 7.4\,\mathrm {\mu }{\rm m}^2$. Its spectral range spans from 290 to 1100 nm, while it operates at a scanning speed of 40 MHz and a frame rate of 14 frames per second. For laser emission, a pulse duration of 4 ns is achieved using a Litron laser source. The illuminated area of the flow field measures
 $400 \times 600\,{\rm mm}^2$. To capture particle projections on both longitudinal and horizontal planes, three cameras are employed to record images at full resolution on the side and top surfaces of the flow field. The flow seeding is achieved with a fog generator and glycol-based fluid. Data acquisition and post-processing are performed using Davis 8.1 software. The initial interrogation window size is set to 64 pixels
 $\times$ 64 pixels, with a 50 % overlap and a square
 $1:1$ weighting factor for the first two passes. The final interrogation window size is reduced to
 $32\text { pixels} \times 32\text { pixels}$, also with a 50 % overlap, but utilizes a round
 $1:1$ Gaussian weighting factor for the final pass. This multi-pass processing approach begins with a larger window size and incrementally decreases it to enhance the precision of the velocity field measurements. The velocity uncertainty is estimated at
 $0.1\,{\rm m}\,{\rm s}^{-1}$ for the time-averaged velocity.
2.2. Scheme of actuators
To induce blowing and suction flows within the wake, a configuration consisting of four individual multi-frequency synthetic jets has been implemented in the body, as illustrated in figure 4. In figure 4(a), the four nozzles, labelled  $S_{1}$–
 $S_{4}$, each with a width of
 $1 \times 10^{-3}\,{\rm m}$, are arranged along the rear slanted surface and oriented perpendicular to the length of the slot. Specifically,
 $S_1$ and
 $S_4$, which span a length of
 $1.1 \times 10^{-1}\,{\rm m}$ (accounting for 96.58 % of the slanted surface length), are situated at a distance of
 $1 \times 10^{-3}\,{\rm m}$ from the corresponding C-pillars’ edges to actuate the C-pillar vortices. Additionally,
 $S_2$ and
 $S_3$, both measuring
 $1.2 \times 10^{-1}\,{\rm m}$ in length (representing 92.59 % of the half-width of the body), are placed
 $1 \times 10^{-3}\,{\rm m}$ from the rear roof edge to actuate separation of the vortex from the trailing edge of the roof. As depicted in figure 4(b), the interior channel near the nozzle is designed to streamline the flow, thereby generating high velocity. To drive the actuators, four woofers are independently sealed within the body, as shown in figure 4(c,d). These woofers, categorized as MCM Audio Select 55-1856, possess a power rating of 60 W and an impedance of 8 Ohm. Their connection to separate channels of an ALTO MAC 2.4 stereo amplifier, which offers a maximum power output of 900 W, enables individual control of each actuator. Furthermore, the control signals required for actuation are generated via the LabVIEW platform.
Schematic diagram of jet devices: (a) the rear body equipped with jet nozzles; (b) side view of the nozzle, solid body in green, section ( $S_2$,
 $S_3$). The inside devices and channels: (c) left (
 $S_1$,
 $S_2$); (d) top (
 $S_2$,
 $S_3$).

Prior to data acquisition, the velocity and frequency of the four jets were calibrated using a hotwire to measure the flow in close proximity to the nozzles. The flow velocity for each jet slot was measured at various positions along the length before calibration, ensuring that the actuation velocity remains relatively uniform throughout the length of the jet. Figure 5 illustrates an example depicting the flow characteristics of  $S_2$. The actuation flow is driven by a sinusoidal signal, as depicted in figure 5(a) showing the actuation frequency at 50 Hz (
 $St_H =0.61$) with a voltage of 4 V, where
 $U_{afc}= U_{jet}/U_{inf}$ is the normalized actuation velocity of the jet velocity
 $U_{jet}$. It has been previously established by Seifert, Greenblatt & Wygnanski (Reference Seifert, Greenblatt and Wygnanski2004) that periodic actuation can introduce unstable energy oscillations to local flows, thereby having a greater potential to modify the flow structure compared with stable jets. Furthermore, figure 5(b) showcases the variation in
 $U_{afc}$ distribution across different actuation frequencies and voltages. As a safeguard for the device, the maximum values for
 $U_{afc}$ and actuation frequency are constrained to 4 V and 250 Hz (
 $St_H =3.05$), respectively. The
 $\overline {{\rm Max}(U_{afc})}$ presented in the figure represents the average of all peak values, as indicated by the red circles shown in figure 5(a), within the corresponding period of
 $t^*= tU_{inf}/H=491.6$. For example, with the actuation frequency at
 $St_H =0.61$, the 95 % confidence interval allows
 $\overline {{\rm Max}(U_{afc})}=2.43 \pm 0.01$. To accurately analyse the effects of the actuation flow on the wake, it is imperative to ensure that comparable results of
 $\overline {{\rm Max}(U_{afc})}$ are attained for each frequency. Thus, the voltage and actuation frequency ranges are set as
 $0 \leq V \leq 2.34$ and
 $0.28 \leq St_H \leq 2.8$, respectively, as illustrated by the dashed frame in figure 5(b).
Characteristics of the jet flow: (a) periodic time history of the actuation velocity  $U_{afc}$; (b) distribution of
 $U_{afc}$ at different actuation frequencies and voltages.

Drawing upon the GA introduced in Wahde (Reference Wahde2008), an integrated optimization technique that synergistically incorporates wind tunnel experiments is designed, as presented in figure 6(a). The underlying objective of this control design is to address the regression conundrum by minimizing the cost function while simultaneously formulating the optimal control rate. In this study, the cost function, denoted as  $\sigma$, is defined as
 \begin{equation} {\sigma}=\left[(\overline{C_d})_a-(\overline{C_d})_0\right]/{(\overline{C_d})_0}, \end{equation}
where  $(\overline {C_d})_a$ and
 $(\overline {C_d})_0$ respectively denote the averaged drag coefficient of the body with and without the actuation. As such, a higher drag reduction efficiency is indicated by a greater absolute value of negative
 $\sigma$.
Genetic algorithm: (a) flowchart of the control process; (b) evolutionary cost of the optimization process.

To ensure clarity, during the experiment,  $(\overline {C_d})_a$ is sampled for a duration of
 $t^*=409.6$ for each individual. Within this sampling period, the error of
 $(\overline {C_d})_a$ is less than
 $\pm 10^{-2}$ with the consideration of 95 % confidence interval. Besides, the wake rapidly responds to changes in the jet flow, but fully developing within a time frame of
 $t^*=40$. To avoid potential interference, a time interval of
 $t^*=81.9$ is set between adjacent individuals. Following a stochastic initialization of genes (the actuation frequency and velocity) in the first generation, the flow control is activated in accordance with the control signals. Once all the control parameters of the current generation are evaluated, the GA, including elitism, crossover and mutation, is executed. Elitism in GAs entails preserving the best-performing individuals without alteration for the next generation, which ensures that top solutions are retained and accelerates the convergence process. The crossover operation involves merging segments of genetic material from two parent solutions to generate new offspring solutions. Meanwhile, the mutation operation introduces random alterations to the genes, fostering variability and maintaining diversity among the population. This helps prevent premature convergence and enhances the overall optimization process. The iterative process yields a new generation of control signals, which are subsequently tested. The GA process employs various parameters, as listed in table 1. For a comprehensive understanding of each variable, a detailed explanation can be found in Wahde (Reference Wahde2008).
The parameters of the GA.

Figure 6(b) presents the optimized evolutionary cost history, achieved through the utilization of the GA with all  $S_{1}$–
 $S_{4}$ activated. Here, the parameter
 $i$ indicates the individual index of population in each generation. Within each generation, the
 $\sigma$ values are arranged in ascending order. The horizontal dashed line corresponds to the case without actuation. Notably, it can be observed that after the
 $10{\rm th}$ generation (denoted as
 $n=10$), drag reduction is successfully attained across all individuals, exemplifying the efficacy of the GA optimization strategy. Furthermore, the inclusion of mutations facilitates the exploration of superior control laws, ensuring the continuous improvement of the drag reduction effect. Nevertheless, upon comparing the
 $n=50$ and
 $n=60$ generations, a high degree of consistency in the results is observed, signifying favourable convergence. Consequently, to yield optimal outcomes in this study, the total number of generations is set to
 $N=60$.
3. Results and discussion
To assess the impact of actuation on the separation vortices shedding from the rear roof and the C-pillar, three distinct cases are investigated: (1) activation of all four jets,  $S_{1}$–
 $S_{4}$, denoted as A4; (2) activation of the top two jets,
 $S_{2}$,
 $S_{3}$, denoted as T2; and (3) activation of the side two jets,
 $S_{1}$,
 $S_{4}$, denoted as S2. The optimal results for each case are presented in table 2. To ensure the reproducibility of the findings, two steps were taken: (1) conducting multiple experiments using the same parameters shown in table 1 and (2) increasing the
 $M$ and
 $N$ values. The results confirm the consistency of the optimal parameters with those presented in table 2, with actuation velocity and frequency errors among independent experiments being below
 $10^{-2}$. The findings reveal that the A4 case yields the maximum drag reduction rate, reaching an impressive 9.21 %, achieved in the
 $n=59$ generation. Similarly, the T2 case achieves a notable 9.11 % reduction in drag, attained in the
 $n=53$ generation. Upon comparing the A4 and T2 cases, it becomes evident that both exhibit comparable actuation velocity and frequency for
 $S_2$ and
 $S_3$. Conversely, for the S2 case, the optimization potential is constrained. Consequently, a more rapid convergence is observed, leading to a 3.61 % drag reduction accomplished in the
 $n=24$ generation. This substantiates the notion that manipulating the vortices originating from the rear roof, rather than the C-pillar, allows for a more efficient drag reduction.
The optimal results of the three cases.

It is essential to recognize that the operation of woofers requires electrical power. By monitoring the real-time voltage of the woofer during its operation and incorporating the electrical resistance, the actual energy consumption of the woofer can be calculated. To address this issue, the drag reduction considering electrical consumption is quantified as  $\sigma ^*$, as detailed in table 2. The results indicate that incorporating electrical consumption into the calculations reduces the effectiveness of drag reduction. Specifically, the T2 scenario, which utilizes only two activated jets, emerges as the optimal configuration with
 $\sigma ^* = -6.89\,\%$. However, the primary focus of this study is on determining the optimal parameters for zero-mass jets. Therefore, the electrical energy consumed is solely for driving the actuators, not for injecting additional energy into the wake. Furthermore, alternative actuator forms, such as piezoelectric actuators, pneumatic pulsers or electromagnetic pulse actuators, may offer varying efficiencies. Consequently, the study does not emphasize the electrical consumption associated with these actuators.
To investigate the impact of the wake structure on the aerodynamic drag of the body, figure 7 illustrates the statistically time-averaged magnitude of the velocity, denoted as  $\bar {U}=\overline {U_m}/U_{inf}$, where
 ${U_m}$ is the velocity magnitude distributed along the horizontal
 $Z$ plane behind the rear slant. A comprehensive set of 20 (spanwise)
 $\times$ 15 (streamwise) sampling points is obtained through hotwire measurements, with a denser arrangement near the surface. Each sampling point is measured for a duration of
 $t^*=1228.9$, resulting in a representative average velocity in the wake. The coordinates of sampling points are determined with a precision of
 $1\times 10^{-4}\,{\rm m}$. Figure 7(a) represents the reference case, labelled as Ref, which corresponds to the undisturbed condition. At the studied Reynolds number, the average wake exhibits symmetry, which is attributed to the high-frequency switching between bi-stable wake states, following the observation of He et al. (Reference He, Minelli, Su, Gao and Krajnović2022). This symmetric average wake state is highly sensitive and can easily transition to an asymmetric state due to small yaw angles or other disturbances. This phenomenon resembles turbulence bifurcation prompted by external disturbances (Zimmerman, Triana & Lathrop Reference Zimmerman, Triana and Lathrop2011; Bonnavion & Cadot Reference Bonnavion and Cadot2018; Gayout, Bourgoin & Plihon Reference Gayout, Bourgoin and Plihon2021). To ensure the symmetry of the experimental conditions, the wake state is carefully monitored to confirm that it reaches an average symmetric state before commencing the experiments. This process allows the observation to rule out any influences from yaw angles or other external sources of asymmetry. The flow structure,
 $V_c$, consists of two substructures distributed on both sides of the rear slant. It has been previously noted that
 $V_c$ generates recirculation bubbles attached to the slant, resulting in the formation of negative-pressure regions, which contribute to increased drag (He et al. Reference He, Minelli, Wang, Dong, Gao and Krajnović2021a). Figure 7(b,c) exhibits similarities in the flow patterns between the A4 and T2 cases, demonstrating certain forced asymmetry, with
 $V_c$ transforming into a single unified structure. It can be inferred that compared with Ref, the A4 and T2 cases effectively reduce the negative-pressure region behind the slant, consequently diminishing the drag experienced by the body. Conversely, in S2, as shown in figure 7(d), the presence of two
 $V_c$ substructures is still evident, resulting in relatively inferior drag reduction performance compared with A4 and T2.
Distributions of the mean velocity magnitude,  $\bar {U}$ , obtained by using hotwire, on the
 $Z$ plane behind the slant, located at
 $H_P =0.844H$ above the bottom of the model (half-height of the slant): (a) Ref; (b) A4; (c) T2; (d) S2.

Regarding the optimization algorithm selecting an asymmetric mode, it is essential to emphasize that the observed asymmetry is not merely a result of manufacturing imperfections or model alignment. Instead, it reflects the inherent dynamics of the flow under the given conditions. Besides, swapping the parameters for left and right actuators mirrors the wake and still yields similar levels of drag reduction. Multiple iterations of the GA optimization, including increasing the population size per generation and the total number of generations, have consistently produced results similar to those presented in the paper. Thus, while the asymmetric mode observed in the optimization process is a result of the flow dynamics and not solely due to model imperfections or alignment issues, the overall robustness of the optimization results supports the consistency of the drag reduction achieved.
Figure 8 shows the distributions of the mean streamwise velocity,  $\bar {u}$, projected onto the horizontal plane behind the rear slant of the body. For the sake of brevity, the A4 case is exclusively selected for comparison with the Ref data. Analysing figure 8(a,b), it is evident that separation leads to the formation of a reverse flow in the vicinity of the slant. Notably, figure 8(c) demonstrates that, in the A4 case, the extent of this reverse flow region becomes suppressed.
Distributions of the mean streamwise velocity,  $\bar {u}$ , obtained by using PIV, on the
 $Z$ plane behind the slant, located at
 $H_P =0.844H$ above the bottom of the model (half-height of the slant): (a) Ref; (b) A4, where the dashed lines indicate the contour lines at
 $\bar {u}=0.3$; (c) comparison of
 $\bar {u}=0.3$ contour lines between Ref and A4.

From the lateral view, figure 9 illustrates the contour lines representing the mean streamwise velocity  $\bar {u}=0.3$, projected onto the lateral planes behind the body. In the A4 case, the velocity contour line is compelled to be closer to the slant in the in-notch region. The maximum disparity between the two cases is depicted on the
 $Y_1$ plane as shown in figure 9(a). To delve deeper into the controlling mechanism, the mean streamlines and their corresponding illustrations on the
 $Y_1$ plane are presented in figure 10. As depicted in figure 10(a,c), in the Ref case, the separation vortex
 $V_c$, shedding from the rear roof, detaches to the slant, forming a slant bubble. Consequently, the downstream vortex
 $V_b$, shedding from the rear deck, forces the back bubble to attach to the back wall of the body. In this scenario, the negative pressure inside the slant and back bubbles contributes to a certain amount of drag on the rear body. However, in figure 10(b,d), for the A4 case,
 $V_c$ is attached to the slant, resulting in the compression of the slant bubble. Simultaneously, the flow reattaches to the deck and
 $V_b$ separates at a larger angle and pushes the back bubble further downstream into the wake. Consequently, the A4 case achieves drag reduction.
Contour lines of the mean streamwise velocity at  $\bar {u}=0.3$ from PIV measurements projected onto lateral planes: (a)
 $Y_1$; (b)
 $Y_0$; (c)
 $Y_2$. The
 $Y_0$ plane is in the central section, and the distance from
 $Y_0$ to
 $Y_1$ or
 $Y_2$ is
 $0.25W$.

Mean streamlines and the spanwise vorticity,  $\overline {\varOmega _y}$, obtained by using PIV, on the left
 $Y_1$ plane: (a) Ref; (b), A4. Sketch of the streamlines describing the wake separation: (c) Ref; (d), A4.

In figure 7, it is evident that A4 or T2 displays asymmetry in the wake. To gain further insight into the wake characteristics, a comparison is made between the time histories of the lateral pressure gradient,  ${\delta }$, for the Ref and A4 cases, as shown in figure 11. The Ref case shows significant fluctuations in
 ${\delta }$. The probability density function reveals three peaks for
 ${\delta }$, indicating that the wake experiences a symmetric state
 $S_C$, as well as two mirrored asymmetric states
 $S_A$ and
 $S_B$. This behaviour is consistent with previous research by He et al. (Reference He, Minelli, Su, Gao and Krajnović2022), who demonstrated bi-stability in the wake of a notchback Ahmed body at low
 $Re_H$. As
 $Re_H$ increases, the wake becomes more unstable, resulting in frequent switches between
 $S_A$ and
 $S_B$, and a greater proportion of the wake exhibiting the symmetric state
 $S_C$. In the present work, the wake fluctuates between two asymmetric mirror states, with a statistically symmetric wake characterized by
 $\bar {\delta }=0.01$ during the sampling period of
 $t^*=2.46 \times 10^4$ . However, the wake retains its bi-stable nature, making it highly susceptible to small yaw angle perturbations. Conversely, in the A4 case, some asymmetry is observed, with
 $\bar {\delta }=0.26$, but the amplitude of
 ${\delta }$ is significantly reduced. Consequently, the wake maintaining the
 $S_D$ state becomes less sensitive to small yaw angles, resulting in improved wake stability. The lateral force coefficients for the A4 case during wind tunnel tests are minimal, potentially lower than the measurement accuracy, making accurate measurements challenging.
(a) Time histories of the pressure gradient  ${\delta }$ and (b) its probability density function (p.d.f.).

Specifically, it is observed that applying the optimized actuator parameters from one side to the actuators on the opposite side can achieve symmetric wake flow configurations. Contrary to expectations, this configuration resulted in reduced drag reduction compared with the optimal asymmetric control state. This indicates that the slight asymmetry in the wake of the notchback Ahmed body plays a significant role in optimizing the drag reduction performance.
In summary, both A4 and T2 cases effectively reduce the aerodynamic drag and enhance body stability. Specifically, the T2 case with only two jets achieves comparable control effects to A4, indicating its superiority. On the other hand, the S2 case performs poorly, implying that activating the wake at the rear roof is a more effective strategy for controlling the wake structure of a notchback body design.
4. Conclusions
Wind tunnel experiments are conducted for investigation of active wake-flow control for a notchback Ahmed body presenting bi-stable nature in the wake. The activation of the wake is achieved by pulsed jets optimized by a GA.
The results show that the activation of certain jets ( $S_{1}$–
 $S_{4}$) can effectively reduce the drag experienced by the body. The A4 case, where all four jets are activated, achieves a maximum drag reduction of 9.21 %. The T2 case, with only the two top jets activated, achieves a notable drag reduction of 9.11 %. However, the S2 case, with two side jets activated, achieves a drag reduction of only 3.61 %. Therefore, manipulating the vortices originating from the rear roof is more efficient in reducing drag compared with the vortices from the C-pillar. Particularly, in the A4 case, the wake flow is attached to the rear slant, diminishing the slant bubble. Thereby, the flow reattaches to the deck and separates for a large angle, pushing the back bubble further downstream for drag reduction. The wake structures in the A4 and T2 cases exhibit some asymmetry but show improved stability compared with the reference case. The amplitude of the lateral pressure gradient fluctuation is significantly reduced, making the wake less sensitive to small yaw angles.
The study demonstrates that activating specific jets can effectively control the wake structure and reduce drag on the notchback body. The A4 and T2 cases show promising results, with the A4 case achieving the maximum drag reduction rate. However, the T2 case, with only two jets activated, achieves comparable control effects and is considered a preferable choice. The findings contribute to the understanding of wake control strategies for drag reduction in automotive design.
Acknowledgements
Experiments were conducted at Chalmers Laboratory of Fluids and Thermal Science. The authors thank Professor V. Chernoray and Dr M. Tokarev for helping perform the wind tunnel experiment.
Funding
K.H. acknowledges financial support from the National Natural Science Foundation Youth Fund, grant no. 52302461.
Declaration of interests
The authors report no conflict of interest.


 Open access

