Social scientists have long examined how the welfare state reduces inequality through taxes and transfers. In recent years, however, scholars have cast increasing light on the welfare state's role as an insurer. These analysts have argued (1) that core elements of the welfare state protect citizens against adverse economic shocks and (2) that such ‘social insurance’ is a response to societal demands for risk reduction as well as for inequality reduction (Baldwin Reference Baldwin1990; Barr Reference Barr2001; Goodin Reference Goodin1988; Iversen and Soskice Reference Iversen and Soskice2001; Mares Reference Mares2003; Moene and Wallerstein Reference Moene and Wallerstein2001; Rehm Reference Rehm2016; Rueda and Stegmueller Reference Rueda and Stegmueller2019; Scheve and Stasavage Reference Scheve and Stasavage2006). In these accounts, the welfare state reflects cross-class demands for insurance at least as much it reflects lower-class demands for downward redistribution.
Yet few studies have sought to measure the welfare state's insurance effects, and none has done so for more than a small set of nations or a short time span (DiPrete and McManus Reference DiPrete and McManus2000; Ehlert Reference Ehlert2012; Fouarge and Layte Reference Fouarge and Layte2005; Hacker Reference Hacker, Stiglitz, Fitoussi and Durand2018; Nichols and Rehm Reference Nichols and Rehm2014). As a result, our main measures of policy outcomes focus on either inequality reduction or program-specific indicators, such as the generosity of unemployment benefits. This gap in knowledge not only hinders efforts to test leading theoretical claims in the study of welfare state politics; it also stands in the way of better assessments of how effectively welfare states protect citizens against major risks – a crucial consideration for policy makers.
In this letter, we begin to fill this gap by developing a measure of what we call ‘risk reduction’ – the degree to which taxes and transfers reduce the frequency and severity of major losses in household income. Because our measure examines intertemporal income dynamics, it requires panel data, which we harmonize for more than twenty rich democracies to produce country-specific time series.
We find that large income losses affect all income and education levels, making the welfare state of potential value to a broad cross-section of citizens. We also find that taxes and transfers greatly reduce the severity of such losses, though to varying degrees over time and across countries and demographic groups. Finally, we identify specific ‘triggers’ of large losses and find that such triggers are closely associated with risks on which welfare states focus, such as unemployment and sickness. With these new measures and findings, we hope to spark additional investigations of the insurance effects of the welfare state and to encourage greater use of panel data in comparative political economy research.
Measuring risk incidence and risk reduction
Estimating measures of risk incidence and reduction is complex. Unlike conventional metrics of redistribution – which use cross-sectional data to examine the impact of taxes and transfers on the aggregate distribution of income – measures that focus on the occurrence and effect of large economic losses require panel data that trace household finances over time. Panel studies were once scarce and short, limiting their utility for comparative political economy. Yet the expansion of panel data over the past two decades allows us to produce a dataset that encompasses more than twenty rich democracies, often for considerable time periods.
We focus on two basic measures: risk incidence and risk reduction. Risk incidence is the share of people who experience large year-to-year income losses. Risk reduction is the share of people who are prevented from experiencing such losses by public transfers and taxes. We define ‘large year-to-year income losses’ as a 25 per cent or greater drop in an individual's real household income, adjusted for family size, from one year to the next.Footnote 1
Four features of this approach are worth emphasizing. First, our threshold of 25 per cent is based on a nationally representative US survey that asked about the size of income losses expected to cause hardship (Hacker, Rehm and Schlesinger Reference Hacker, Rehm and Schlesinger2013). We should emphasize, however, that our core results are the same if we adopt alternative thresholds within a fairly broad range (see Appendix 5).
Secondly, we examine income losses rather than consumption losses because income is more consistently and carefully measured in existing panel studies. However, large consumption drops are highly associated with uninsured income losses (Gruber Reference Gruber1997; Hendren Reference Hendren2017).
Thirdly, we examine household income rather than personal earnings, because many sources of income are pooled within the household. We adopt the standard approach of adjusting income for household size to reflect economies of scale and then assigning this adjusted income to each adult household member (see Appendix 3).
Finally, we generally limit our analysis to working-age people because income dynamics after retirement are not necessarily a good measure of risk, given the centrality of wealth to post-retirement well-being. We relax this restriction, however, to consider the dynamics of income risk over the life cycle.
In sum, our proxy for risk incidence is the prevalence of year-to-year income drops of 25 per cent or greater. We say ‘proxy’ because our measure does not distinguish between losses that are difficult to foresee or insure against and those that are not. This is one reason we focus on sizable losses: they are least likely to be voluntarily incurred, most likely to cause hardship, and most difficult to insure privately. As we shall see, the large losses we measure are indeed associated with risks on which welfare states focus. Nonetheless, further refinement of our approach could involve more careful delineation of the sources of income loss.
How, then, do we assess risk reduction? In analyses of redistribution, the standard approach is to measure the reduction in inequality that is attributable to taxes and transfers – that is, the difference between what analysts call ‘market income’ and post-tax-and-transfer ‘disposable income’. A conceptually equivalent measure of risk reduction would compare the incidence of large losses in market income with the incidence of large losses in disposable income.Footnote 2
Yet this approach does not take full advantage of our panel data. Because we trace individual income dynamics, we can assess whether taxes and transfers prevent each individual from experiencing a loss of 25 per cent or greater.Footnote 3 Our measure of risk reduction, therefore, is the number of working-age people who experienced a 25 per cent loss in market income (MI) but were sufficiently buffered by taxes and transfers to prevent a 25 per cent loss in disposable income (DI), divided by the total number of working-age people who experienced a 25 per cent loss in market income. Differently put, then, risk reduction = (% MI but not DI drop)/(% MI drop).
Main findings
To produce our estimates, we assembled panel studies that cover more than a few years, have been more or less continuous since their creation, and are accessible to researchers.Footnote 4 To increase the comparability of results based on different sources, we harmonized and standardized the data, following established conventions where they exist (see Appendix 3). Although many panel studies are of recent vintage, we have longer time series for five countries: Australia (16 years), Germany (32 years), Switzerland (17 years), the United Kingdom (18 years) and the United States (43 years).
The Incidence of Risk
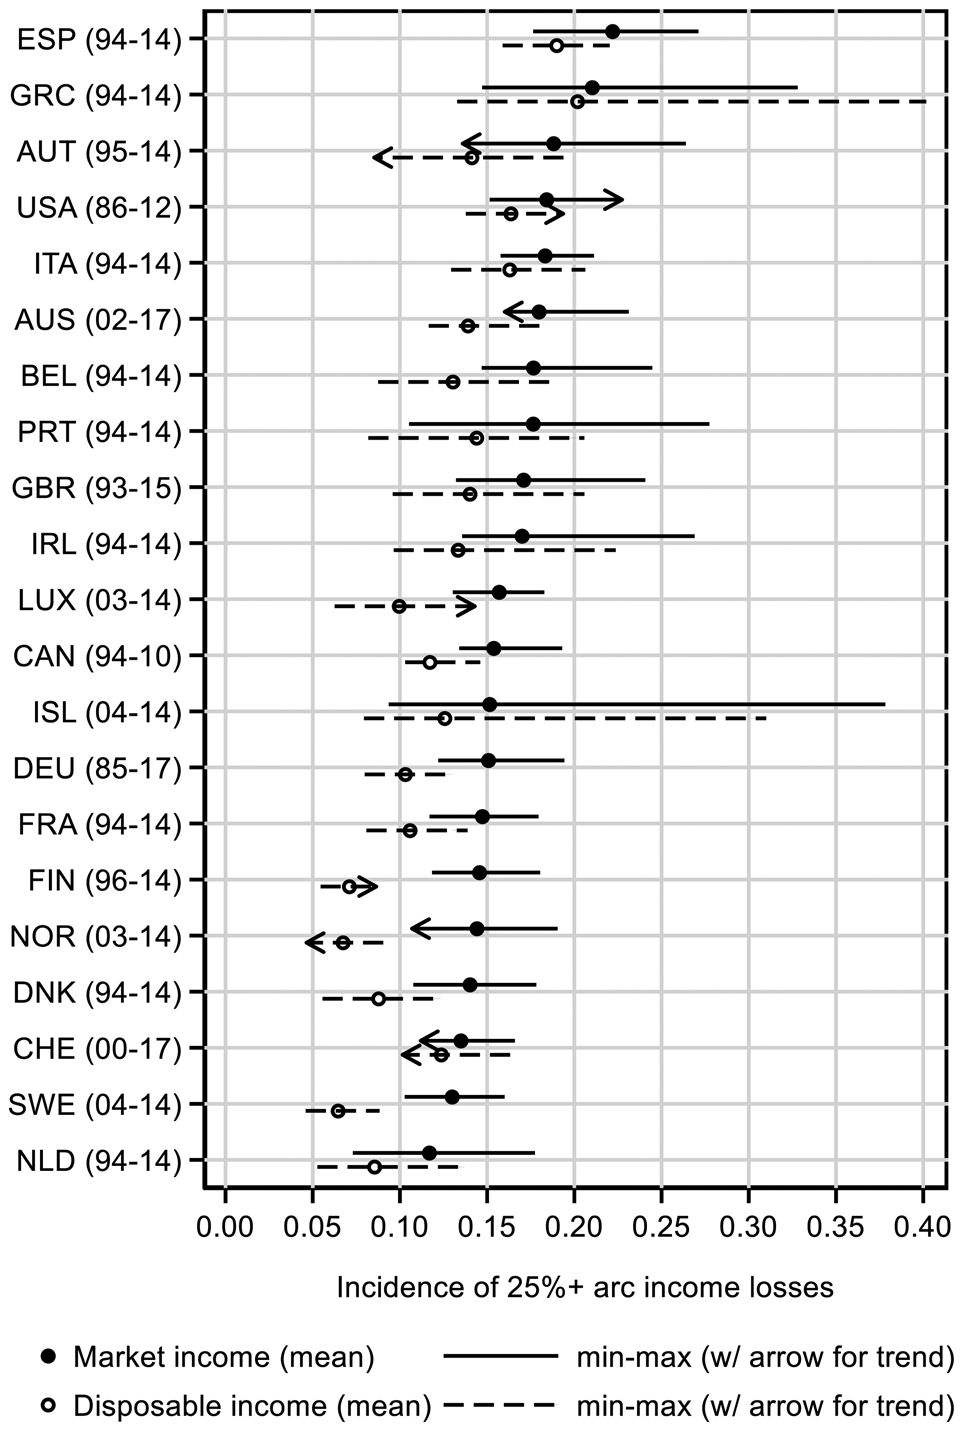
How prevalent are large income losses in rich democracies? Figure 1 shows the range of prevalence estimates across the years in the data (indicated next to the country abbreviation) for MI and DI drops.Footnote 5 The point marker shows the series average within each nation. If there is a statistically significant secular trend, it is indicated by an arrow showing its direction. Thus, the figure conveys the average, range and evolution of large income drops.
Prevalence of large income losses

As the figure shows, these outcomes vary substantially across and within nations over time. The countries with the greatest range and highest average prevalence include Spain, Greece and Iceland – all countries hit hard by the post-2008 crisis. The countries with the lowest average levels include the Netherlands, Switzerland and the Nordic nations.
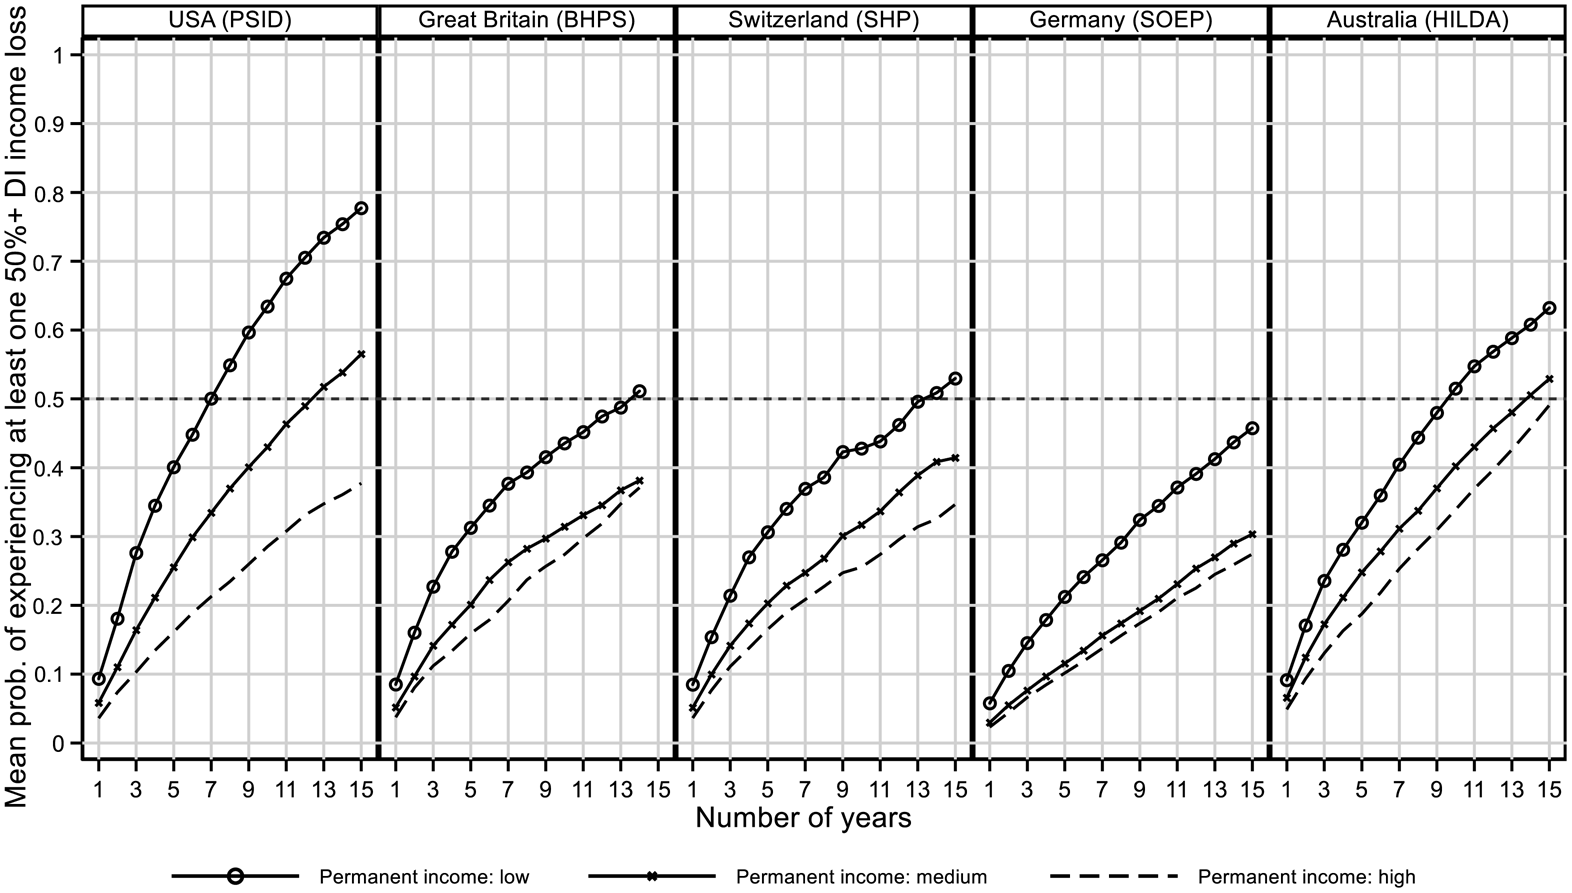
The differences shown in Figure 1 are substantial. Yet they appear even more striking when we extend our time frame, which we can do for the five aforementioned countries with long panels.Footnote 6 Figure 2 shows the probability that an adult in these countries will experience at least one large DI loss within the number of years specified. To better differentiate between insurance and redistributive effects, we have broken down the adult population into ‘permanent’ income tertiles, based on average household income over the full period for which we have data.
Probability of experiencing at least on 25 per cent arc income drop within time window

A glance at the figure makes clear that the probability of large income losses rises quickly as the time frame increases, and that this probability and its rate of ascent differ across nations. For example, we need only extend the period by six years before a middle-income adult in the United States has a 50–50 chance of having experienced a large DI loss. We have to extend the period to nine years to see the same probability of loss among German adults.
In addition, the figure shows that all income groups face substantial income risk. Though income and risk are always correlated (lower income, higher risk), the three income groups track each other closely, and in all countries but the United States, the bottom and middle tertiles experience relatively similar levels of risk. This suggests, as insurance-centered scholars argue, that the welfare state offers valued protections to middle- and upper-income citizens as well as the poor.
Triggers of Large Income Losses
Our results so far have little to say about why citizens experience large income losses. To begin to examine this question, we identified a set of life events, or ‘triggers’, that might be expected to impact income, leveraging the common questions on the European Union Survey of Income and Living Conditions (EU-SILC). These events involve large changes in labor market attachment, family structure and health status (see Appendix 5). Across the EU-SILC countries, 40–50 per cent of all large household income losses occur in conjunction with our measured triggers. (The range is because multiple triggers may occur simultaneously.) Since we are looking at household income – which is less responsive to job changes than personal earnings – this seems a substantial share and increases our confidence that our measures capture major risks on which the welfare state focuses.
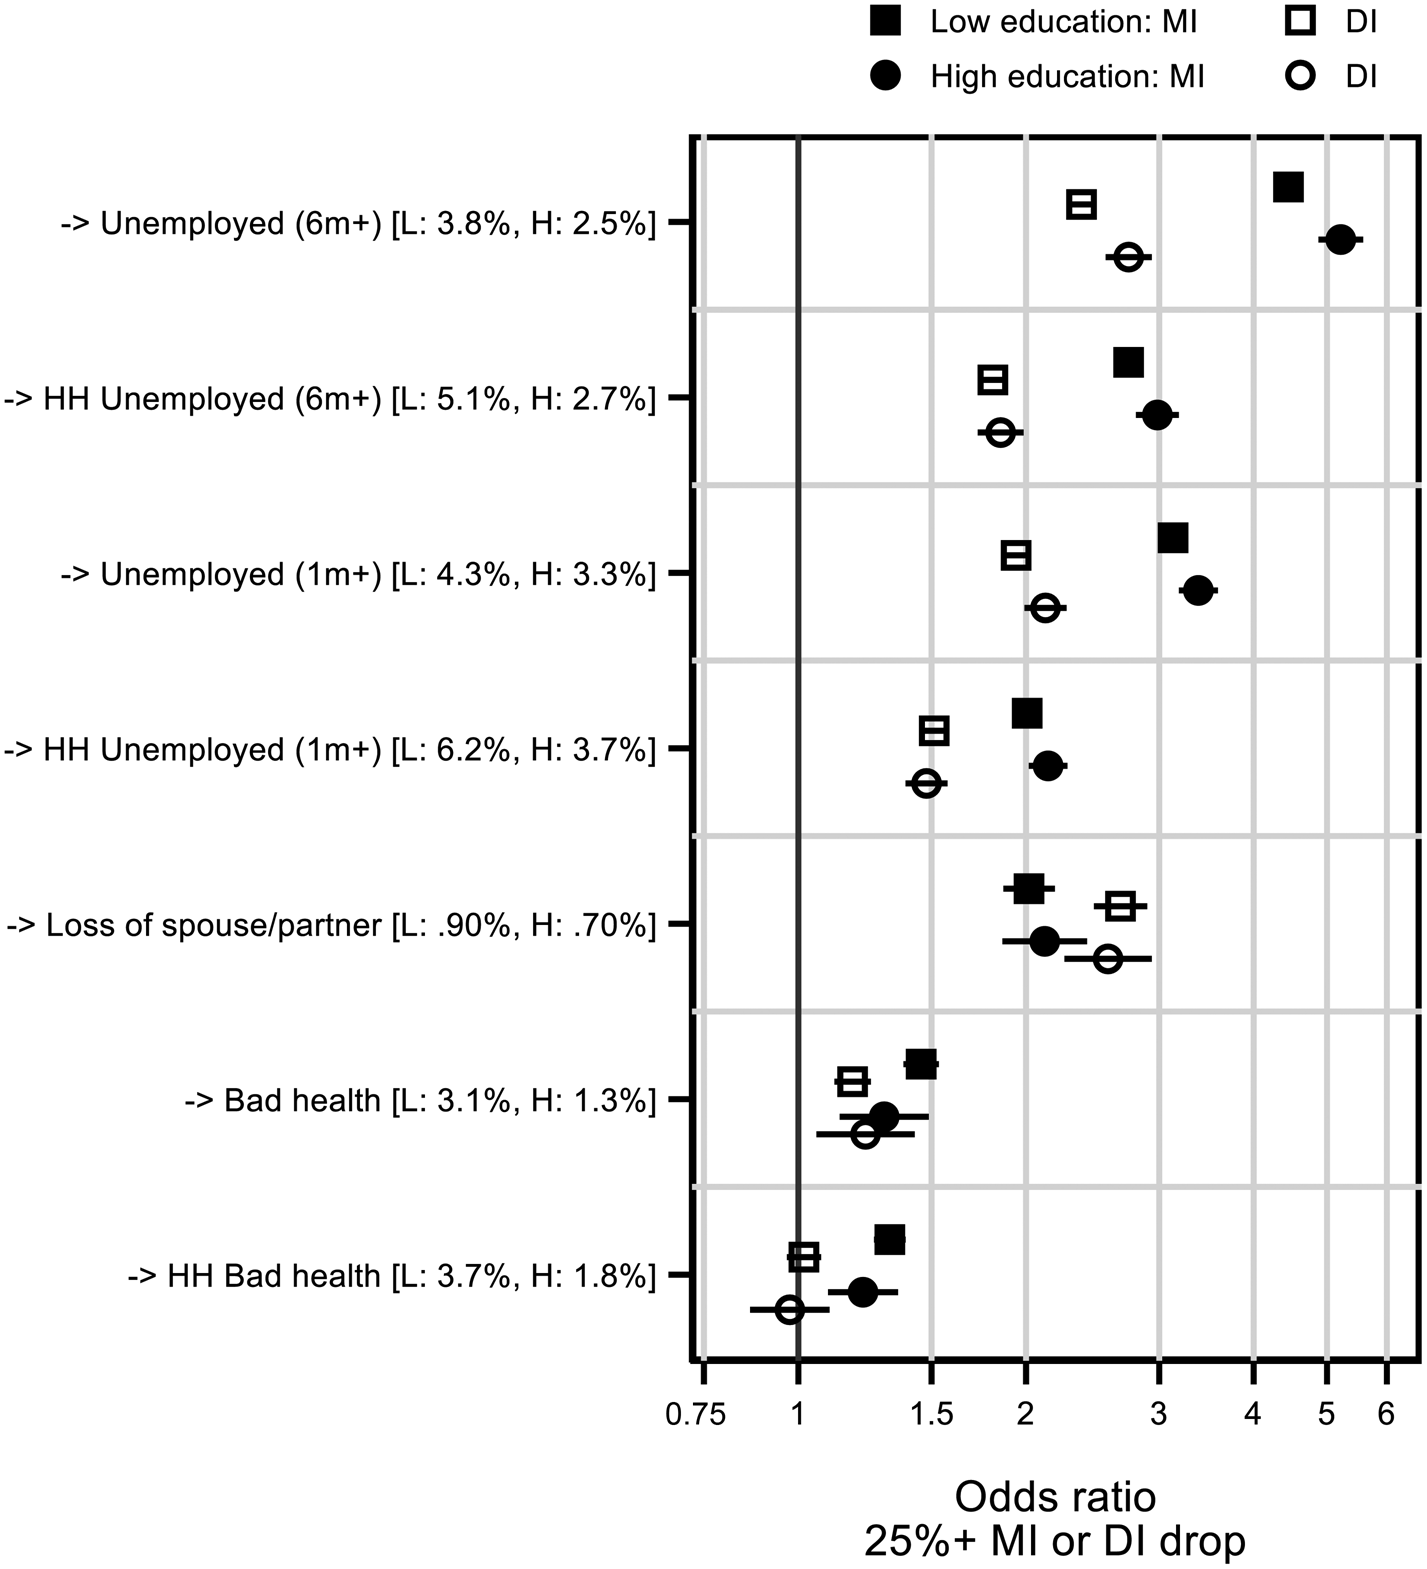
To examine the relationship between our triggers and large income losses, we use odds ratios. The coefficient plot (Figure 3) shows the increase in the likelihood of a large income loss for working-age citizens who experience the trigger relative to citizens who do not. Figure 3 pools the data across all rich democracies in the EU-SILC dataset (we include country and year dummies in the estimations). We display the effect of several major life events – unemployment (short or long term), sickness and loss of a spouse – for both pre-tax-and-transfer household income and disposable household income.Footnote 7 To show how these events affect better-off citizens, we divide the population into ‘low’ and ‘high’ educational groups, based on whether the respondent has the equivalent of a college degree. The share of the relevant population experiencing the event is in brackets next to the trigger's name (L = low education; H = high education).
Triggers

As the figure makes clear, unemployment has the largest effect, increasing the odds of a large market-income loss about fivefold for job losses lasting more than six months. Other triggers are associated with smaller but still notable increases in the chance of large losses. The odds ratios for DI drops are generally much smaller than those for MI drops, indicating substantial risk reduction. Moreover, the differences in risk reduction across educational groups are relatively modest. The picture that emerges is of welfare states that substantially reduce the impact of risks that affect the advantaged as well as the less advantaged.
Risk Reduction
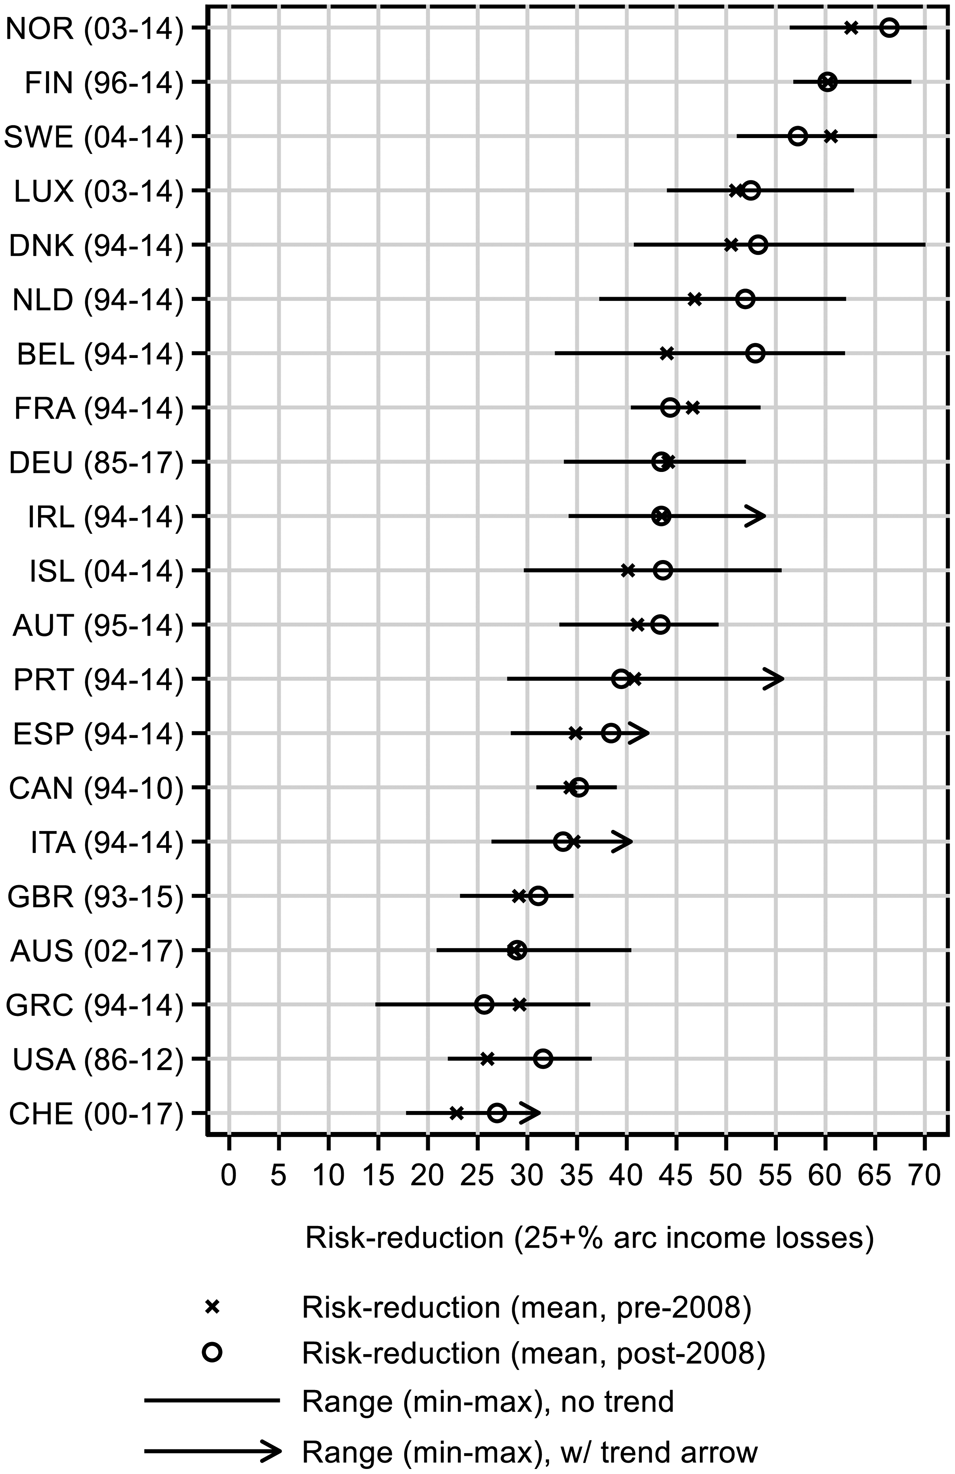
We now employ our measure of risk reduction to examine these insurance effects more directly. Recall our measure represents the share of adults who experience large market income losses yet are spared from large disposable income losses by taxes and transfers. Figure 4 displays the range of our annual estimates of risk reduction for each country, along with averages before (pre-2008) and after the financial crisis (2009 on). It shows that risk reduction varies substantially across nations. The share of people prevented from experiencing large losses by taxes and transfers ranges from less than 20 per cent in Switzerland to more than 60 per cent in some Nordic countries.
Risk reduction (pre- and post-2008)

We can also examine the evolution of this buffering role. Figure 4 compares risk reduction before (X) and during/after (O) the Great Recession. We find that most countries have increased the degree to which they reduce large disposable income losses. Whether this reflects changes in policy or, more likely, the resilience of existing policies, it provides some reassurance to those who worry that social protection systems are becoming less risk reducing. It also points, again, to the critical importance of social insurance. There is little in the historical record to indicate a big contemporary increase in efforts to reduce inequality. Because the Great Recession greatly increased the chance of large losses, however, we would expect existing insurance protections to become more important. Our results suggest they did.
Which Policies Appear to Reduce Income Risk?
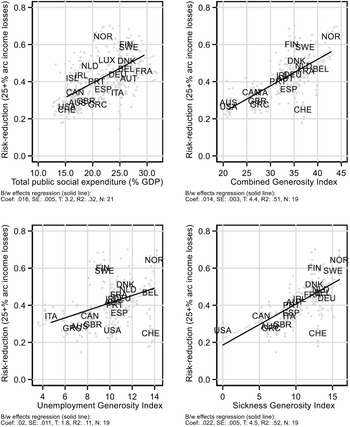
How is risk reduction aligned with the characteristics of welfare states? We start with a general measure of welfare state generosity: total spending on social benefits as a share of gross domestic product (GDP). Figure 5 (top-left panel) shows a significant but loose correlation between social spending and risk reduction. For example, Norway, Luxembourg, the Netherlands and Spain all spend a similar share of their GDP on social benefits, but achieve vastly different degrees of risk reduction. Further analysis of this variation could help scholars – and policy makers – better understand why some welfare states are more effective at reducing income losses and why.
Social spending, benefit generosity and risk reduction
Note: black country abbreviations indicate averages; small grey circles indicate country-year estimates. Generosity indices are from Scruggs, Jahn and Kuitto (Reference Scruggs, Jahn and Kuitto2014).

However, general social spending may not capture specific features of the welfare state that are most risk reducing (Esping-Andersen Reference Esping-Andersen1990). We find stronger correlations when we focus on social insurance, as measured by benefit generosity (Scruggs, Jahn and Kuitto Reference Scruggs, Jahn and Kuitto2014). In particular, our measure appears to capture well the generosity of programs that help workers when their incomes are interrupted, especially sick pay (see the top- and bottom-right panels in Figure 5).
Which Citizens Appear to Benefit Most from Risk Reduction?
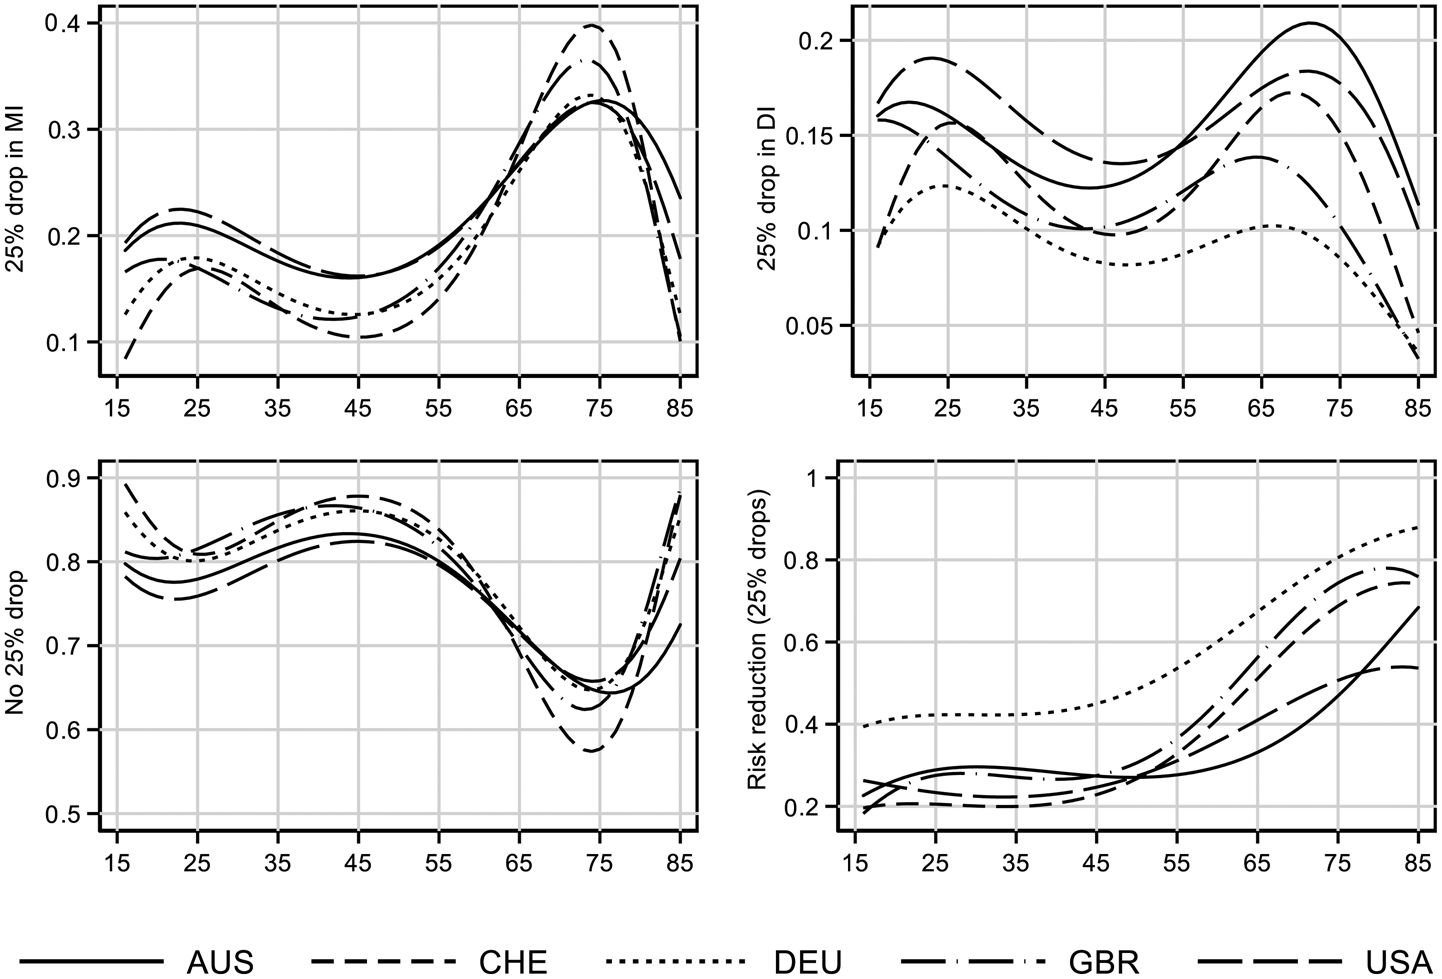
Finally, we assess which segments of the population experience more or less risk and risk reduction. To provide one revealing contrast, Figure 6 focuses on risk experiences by age for five countries for which we have sufficiently long panels (in this analysis we include older citizens). Clearly, the incidence of large losses and the degree to which the welfare state buffers them vary substantially across the population. In general, risk exposure follows a U-shaped curve: high for younger workers, low in middle age and high again around retirement.
Risk and risk reduction over the life cycle
Note: figure shows average predicted probabilities of experiencing the state indicated on the y-axis, by age. Based on multinomial models regressing the states on quartic age. Y-axes vary.

Yet welfare states do much less to reduce risk for the young than for the old. Even when we limit our focus to those younger than sixty, the risk-reducing effects of the welfare state increase with age. Equally clear are the large differences in risk reduction across countries. For all age groups, Germany provides the greatest risk reduction, and the United States and Switzerland the least, though the two switch places as the focus shifts up the age distribution.
Risk, Insurance and the Politics of the Welfare State
Most public social programs provide some form of social insurance, and prominent accounts of the political economy of the welfare state increasingly emphasize this fact. Yet we know relatively little about how social policies affect citizens' exposure to economic risk. Indeed, the indicators that dominate this line of research focus not on risk reduction, but on inequality reduction – that is, the effect of taxes and transfers on the aggregate distribution of income at any point in time. This is a problem not just for political analysis but also for policy analysis, because it limits our ability to judge the impact of welfare states on the main outcomes they are designed to affect.
To begin to fill this gap, we have developed new measures of the welfare state's insurance effects using harmonized panel data encompassing twenty-one democracies. We find large cross-national and intertemporal differences – both in levels of income risk among working-age citizens (risk incidence) and in the degree to which public taxes and transfers reduce such risk (risk reduction). These differences, in turn, are highly correlated with the generosity of policies that assist individuals who are involuntarily out of work.
Exploiting the panel structure of our data, we also investigate the triggers of large losses. These inquiries suggest that our measure correlates with some of the biggest risks to income, and that taxes and transfers generally reduce the impact of such risks. They also show that risk incidence and risk reduction vary across an individual's life cycle and between education and income groups. Crucially, however, we find that both better-off and less advantaged citizens experience large income losses and benefit from taxes and transfers when they do.
In this respect and others, our approach departs from the standard emphasis on inequality reduction. Measures that focus on aggregate inequality suggest that the welfare state is mostly a vehicle for redistributing income from the advantaged to the disadvantaged, which are understood as more or less fixed groups. But without an intertemporal perspective, it is impossible to distinguish between two very different scenarios. In the first, the welfare state simply redistributes income from the affluent to the non-affluent. In the second, it helps those who have experienced adverse events. In both cases, the welfare state transfers income from those higher on the income ladder to those lower on it. But the reasons for these transfers are very different, and they have different implications for politics and policy.
In an insurance-centered perspective, much of what initially looks like inequality reduction is a byproduct of risk reduction, in which citizens who experience a major risk – and hence have lower market incomes – receive help from citizens who could experience that risk but do not. From this perspective, support for the welfare state extends so broadly in part because welfare states deliver over-time insurance as well as point-in-time redistribution. Without panel data, however, this insurance role is invisible.
Of course, social insurance programs are never purely inequality reducing or risk reducing, for two reasons. First, lower-income citizens are generally more likely to experience large economic shocks and are less likely to have adequate private safety nets (wealth, borrowing capacity, access to commercial or work-based insurance). Secondly, ‘premiums’ for social insurance are typically income-related and thus more affordable for less affluent people. Yet social insurance is almost always universal – designed to benefit all citizens, not just the poor – and it can be valuable to those with high incomes or education levels who are subject to unusually large risks of income loss. Moreover, private markets for insurance against big economic shocks are often incomplete or non-existent, and the consequences of such shocks can be greatest (relative to prior standing) for those in higher-income professions that require specific skill investments (Iversen and Soskice Reference Iversen and Soskice2001). In short, separating out risk reduction and inequality reduction is a challenge that scholars (including us) have only started to tackle.
That said, we think our measure offers three main benefits relative to standard indicators of inequality reduction. First, it appears to be more closely related to the structure of modern welfare states, and hence provides better grounds for studying and assessing the impact of modern welfare states. Secondly, our measure varies more across countries and over time than conventional indicators. Finally, we think the continuing robustness of our measure of risk reduction is consistent with the contemporary historical record. Existing social programs have become more consequential in the face of widespread income losses during the Great Recession. An alternative account in which countries facing the crisis began to redistribute more from the rich to the poor does not square nearly as well with recent policy developments. The COVID-19 pandemic presents an even more tragic test of our argument – one that future research using panel data will need to explore. The pandemic threatens ongoing economic risks unmatched in modern times, and social insurance will be critical to buffering those risks.
Still, our measure is just a first step toward developing better indicators of the insurance effects of the welfare state. Our preliminary analysis of income-loss triggers is based merely on the relative timing of triggers and losses; it is not designed to assess whether the triggers are the causes of large losses (though we think a good deal of the losses we see are in fact caused by the major life events we observe, such as unemployment). A priority for future work is therefore to investigate in more depth the sources of losses and the specific policies that reduce risk, and how they vary across nations and over time. Another priority is to move beyond income risk to consider the broader range of losses that social insurance covers, such as the wealth losses associated with major medical events and the risk of inadequate income in retirement.
Most important, future work will need to integrate new measures of risk into the larger base of evidence on welfare state politics. A virtue of our measure is that it is available at the individual level, which means it should be possible to analyze it alongside standard indicators of political behavior. A small but growing body of work examines the relationship between experiences of economic loss and social policy preferences (see, among others, Margalit Reference Margalit2019; O'Grady Reference O'Grady2019; Owens and Pedulla Reference Owens and Pedulla2014). Future research could broaden these investigations – asking, for example, whether those whose losses are best buffered by taxes and transfers become more supportive of the welfare state.
Whatever the path of inquiry chosen, we hope we have demonstrated that deeper investigations into the intertemporal dynamics of citizens' economic experiences would advance not just welfare state research, but the study of comparative political economy more broadly.
Supplementary material
Data replication sets are available in Harvard Dataverse at: https://doi.org/10.7910/DVN/NZTGVE and online appendices are available at https://doi.org/10.1017/S0007123420000034.
Acknowledgements
We are grateful to Stuart Craig and Austin Nichols for their work on some of the data sources we rely on. We are also grateful to the anonymous reviewers for their suggestions. Philipp Rehm would like to thank the Hanse Wissenschaftskolleg, where some of this research was carried out. Finally, we would like to thank the various individuals and organizations that have collected the panel data we rely on (see Appendix 1 for details). The data, replication instructions and the data's codebook can be found at https://doi.org/10.7910/DVN/NZTGVE.