


The more obscure their actions are to citizens, the weaker politicians’ incentives are to perform their legally defined job duties (Przeworski, Stokes, and Manin Reference Przeworski, Stokes and Manin1999). Especially in low-income countries, civil society often lacks the capacity or freedom to monitor incumbents (Diamond Reference Diamond1994), and the media often misrepresents politicians’ performance due to capture or partisan bias (Boas and Hidalgo Reference Boas and Hidalgo2011). Absent reliable information about incumbent performance, citizens resort to using noisy heuristics to inform their vote, such as clientelistic handouts (Kramon Reference Kramon2016), outcomes outside politicians’ control (Healy and Malhotra Reference Healy and Malhotra2013), and candidates’ ascriptive characteristics (Carlson Reference Carlson2015). Rather than focusing on performing their statutory job duties, politicians tend to cater to such heuristics, generally to the detriment of citizen welfare (Fox and Shotts Reference Fox and Shotts2009).
In this study, we investigate the effects of a local civil society organization’s (CSO’s) multiyear initiative to improve the transparency of politicians’ performance of their legally defined job duties to constituents. Drawing on seminal models of political accountability [e.g., Fearon (Reference Fearon, Przeworski, Stokes and Manin1999)] and challenger entry [e.g., Gordon, Huber, and Landa (Reference Gordon, Huber and Landa2007)], we theorize that politicians will carry out their job duties more effectively when citizens receive a clear and reliable signal of their performance early in the term, if incumbents have reasons to believe such a signal can significantly affect their reelection prospects. In low-information environments, incumbents may anticipate that a nonpartisan CSO transparency initiative will be highly salient and substantially affect their reputation, thus “subsidizing” the cost of potential challengers’ decisions to mount campaigns and improving citizens’ ability to discipline. We thus expect that incumbents’ fear of future electoral sanctioning is more likely to be heightened in competitive constituencies compared to safe seats. Alternatively, such a transparency initiative may improve politician performance through a fear of future social sanctioning, whereby local politicians are concerned about their “moral standing” — especially where they are embedded in social groups that overlap with their constituency (Tsai Reference Tsai2007).
We test these predictions in collaboration with ACODE, a Ugandan CSO that produces annual scorecards on politicians’ job duty performance, in a multiyear field experiment involving 408 politicians across 20 subnational (district) governments. Throughout the 2011–2016 term, scorecards for all incumbents were distributed annually to incumbents, district officials, and party representatives at the government headquarters. These activities are a relatively “weak dissemination,” because performance information inappreciably reached constituents, if at all.
For a randomly selected subset of politicians, ACODE further disseminated the scorecards directly to constituents in the middle of the electoral term over a two-year period. Common knowledge was created among incumbents and their constituents about the transparency initiative. We refer to this program as “intense dissemination” (ID). Notably, the effect of the ID treatment on politicians’ subsequent performance captures the marginal effect of informing citizens of incumbent performance above and beyond “weak dissemination.” The latter may cause incumbents to increase their efforts due to the scorecard construction itself and its presentation at government headquarters, for example, by inducing intrinsic, peer/professional, or party pressure.
It is far from obvious that such transparency initiatives would induce politicians to improve the performance of their job duties. Incumbents may assume that citizens would disproportionately weight their performance close to elections (Healy and Lenz Reference Healy and Lenz2014), and ignore transparency efforts early in the electoral cycle. Incumbents may also believe that citizens care less about their job duty performance than they do about clientelistic handouts (Lindberg Reference Lindberg2010) or coethnicity (Carlson Reference Carlson2015). In addition, poorly performing politicians may successfully derail such initiatives by discrediting the CSO’s methodology or impartiality (Humphreys and Weinstein Reference Humphreys and Weinstein2012). ACODE anticipated these possibilities, designed its initiative to increase the saliency of the information, and involved key stakeholders in crafting the initiative’s methodology from the outset.
To measure the effect of disseminating incumbent performance information to citizens, we leverage a variety of data on politicians’ performance: (1) annual scorecard assessments, (2) peer politicians’ evaluations, (3) district bureaucrats’ performance assessments, and (4) actions enabling schools to apply for grant funding. To measure the potential effects on service delivery, we (5) cull budgetary data on development projects and (6) audit schools and health centers.
Our major finding is that disseminating information about politicians’ job duty performance to their constituents significantly improves politicians’ subsequent performance during their electoral term, but only in competitive constituencies. Our second finding is that treated incumbents in competitive constituencies only affected outcomes that were under their direct control—not those involving multiple government actors. The number of development projects was expanded within an incumbent’s constituency budget allocation—presumably to curry favor with more constituents—but not total budget allocation, which would entail wrestling funding away from other legislators. Likewise, health and school service delivery, which involve a multitude of actors across the bureaucracy, was unaffected.
This study advances the literature on transparency and accountability in four important ways. First, to the best of our knowledge, it is the first to show that a grassroots CSO initiative can improve politicians’ performance of their legally defined duties between elections. This result is consistent with accountability theories stressing that politicians shift their focus in response to anticipated changes in citizens’ evaluative criteria (Fox and Shotts Reference Fox and Shotts2009), and that politicians’ efforts increase as the risk of a challenger entering the race rises (Gordon and Huber Reference Gordon and Huber2007). This result is in contrast to the conventional wisdom from low-income newly democratizing countries, which emphasizes the dominance of clientelism and ethnicity as unyielding vote choice criteria. Further, the ACODE transparency initiative was effective in an electoral authoritarian setting; a similar initiative in Uganda was derailed at the national level (Humphreys and Weinstein Reference Humphreys and Weinstein2012). CSO transparency initiatives, we suggest, may be more viable at the “lower-stakes” subnational government level.
Second, while previous empirical studies of transparency and politician behavior have almost exclusively focused on the amount of information citizens have—for example, due to variation in media coverage (Snyder and Strömberg Reference Snyder and Strömberg2010)—this study widens the empirical analysis of transparency by highlighting a contextual condition, competitiveness, which conditions its effectiveness. We show that only politicians from competitive constituencies improved the performance of their job duties in response to greater transparency. This finding reinforces with the idea that without interparty competition, performance transparency is not an effective way to discipline politicians. While many political accountability models assume that viable candidates experience ubiquitous electoral pressure (Ashworth Reference Ashworth2012), this study demonstrates the implications of wide variation in constituency competitiveness (Przeworski Reference Przeworski2015).
Third, we contribute to scholarship emphasizing the relationship between electoral cycles and politicians’ performance. Past studies have shown that politicians generally increase their efforts immediately before elections (Golden and Min Reference Golden and Min2013), since citizens tend to focus on the most recent performance information (Healy and Lenz Reference Healy and Lenz2014). This waning accountability connection between citizens and elected officials between elections constitutes a major challenge for democratic representation (Michelitch and Utych Reference Michelitch and Utych2018). Critically, this study finds evidence that a CSO transparency initiative can induce politicians to better perform in the middle of the term. This result is likely due in part to politicians’ anticipation of the continued salience of performance information (Huber, Hill, and Lenz Reference Huber, Hill and Lenz2012) in a weak information environment. Further, politicians may fear that performance information disseminated early on from a credible source subsidizes potential challenger entry by allowing sufficient time for challengers to organize campaigns. In an electoral authoritarian context, in which opposition parties have limited capacity and resources, politicians may be especially mindful of initiatives that enable potential challengers.
Finally, this study expands a growing literature on the determinants of politician performance writ large. Past studies have examined the role played by the media (Snyder and Strömberg Reference Snyder and Strömberg2010), politicians’ attributes (Volden and Wiseman Reference Volden and Wiseman2014), beliefs about citizen behavior (Grimmer Reference Grimmer2013), or shared identity with constituents (Butler and Broockman Reference Butler and Broockman2011). Building on seminal democratization theories (Diamond Reference Diamond1994) and past scorecard initiatives (Humphreys and Weinstein Reference Humphreys and Weinstein2012), this study focuses instead on the potential disciplining role of civil society.
THEORETICAL FRAMEWORK
How best to hold politicians accountable for their performance is a core political science question with important policy implications. Synthesizing the accountability literature, Lindberg (Reference Lindberg2013) broadly defines an accountability relationship as including the following features: (a) an agent, (b) principal(s) to whom the agent is to give account, (c) the agent’s responsibilities (subject to accountability), (d) the principals’ right to require the agent to justify decisions with regard to the agent’s responsibilities, and (e) the principals’ right to sanction the agent if she fails to inform or justify decisions regarding those responsibilities. To sanction or reward the agent, commonly known criteria for accountable behavior must exist, as well as measurable evidence regarding the agent’s performance.
The political accountability literature focuses on the mechanisms that citizens (principals) can use to incentivize politicians (agents) to better perform their statutory job duties rather than shirk or pursue private interests (Fearon Reference Fearon, Przeworski, Stokes and Manin1999). According to a sanctioning approach, citizens only reelect politicians whose observable output exceeds a certain threshold. Given a pool of identical replacement candidates, incumbents either improve their performance to meet this threshold or are replaced. Under a selection approach, citizens consider heterogeneous candidates and use elections to select the better “type” (e.g., more competent, honest). To get reelected, “bad types” mimic the actions of “good types,” which generally, but not always, improves public welfare (Prat Reference Prat2005). Both models assume that citizens and politicians have a common understanding of politicians’ job duties and information regarding their performance of such duties.
A more informal accountability concept, developed by Tsai (Reference Tsai2007), is that of “moral sanctioning,” in which politicians perform well because they fear losing moral standing (i.e., esteem, respect) with their constituents. The effectiveness of such informal sanctioning depends on the extent to which politicians are embedded within “solidary groups” that overlap with their constituencies. This form of sanctioning also assumes a shared understanding of politicians’ duties and performance evaluative criteria.
Low Transparency of Politician Performance
Yet politicians’ job duties and performance are mostly obscure to citizens. Thus, citizens tend to discipline and reward incumbents based on noisy heuristics, which might poorly correspond to politicians’ performance of their job duties, if at all (Ashworth Reference Ashworth2012). In response, politicians often skew efforts away from their statutory job duties and focus instead on catering to such heuristics—to the detriment of citizen welfare (Fox and Shotts Reference Fox and Shotts2009).
First, especially in low-income countries, citizens often hold politicians accountable for the receipt of personal clientelistic handouts, which are visible and attributable to individual politicians (Kitschelt and Wilkinson Reference Kitschelt and Wilkinson2007). Although distributing private goods is not part of their legally defined job duties, politicians typically succumb to demands for such handouts, and most feel that they are held accountable for delivering them (Lindberg Reference Lindberg2010). Clientelistic handouts are normatively problematic (Stokes et al. Reference Stokes, Dunning, Nazareno and Brusco2013) but also expensive, motivating politicians to engage in corruption (Hicken Reference Hicken2011).
Second, citizens may use public service delivery outcomes (e.g., school construction, paved roads) to proxy for legislators’ performance. However, service delivery in a given constituency generally cannot be attributed to the efforts of a single legislator: it results from the actions and interactions of multiple actors who are not necessarily under the legislator’s control (Kosack and Fung Reference Kosack and Fung2014).Footnote 1 Political accountability is weakened when the electorate holds politicians accountable for outcomes that are neither under their mandate nor their direct control (Ashworth Reference Ashworth2012). Moreover, when citizens use public service delivery outcomes to discipline officials in the few areas in which outcomes are visible and attributable to individual elected officials (Harding Reference Harding2015; Berry and Howell Reference Berry and Howell2007), incumbents may suboptimally skew efforts away from less visible and attributable (but vitally important) job duties (Bueno De Mesquita Reference Bueno De Mesquita2007).
Taken together, accountability models underscore that the more limited citizens’ information about politicians’ performance is, the more politicians shirk their responsibilities—and the more citizen welfare is reduced (Fearon Reference Fearon, Przeworski, Stokes and Manin1999). To address the lack of information about politicians’ job duty performance, theorists envision a prominent role for civil society, including the media, to inform citizens about incumbents’ performance (Diamond Reference Diamond1994). Indeed, past studies find that the presence of more media outlets is associated with improved politician performance of their job duties, presumably by increasing transparency (Besley and Burgess Reference Besley and Burgess2002; Snyder and Strömberg Reference Snyder and Strömberg2010). However, we know little about the effect of targeted CSO politician performance transparency initiatives in improving subsequent politician performance in newly democratizing country settings.
Conditions under Which CSO Performance Transparency Initiatives Work
To get reelected, incumbents shift efforts toward fulfilling the performance criteria they anticipate citizens will use to evaluate them (Fox and Shotts Reference Fox and Shotts2009). A CSO initiative to disseminate politician performance information has the potential to shift the evaluative criteria citizens use to discipline politicians either in upcoming elections (Lindberg Reference Lindberg2013) or through social sanctioning (Tsai Reference Tsai2007). Indeed, the salience of political information for citizen attitudes is malleable: powerful rhetoric, framing, and marketing can greatly affect it (Huber, Hill, and Lenz Reference Huber, Hill and Lenz2012). Next, we discuss six conditions under which transparency initiatives are more likely to induce politicians to improve their performance in anticipation of (possible) citizen sanctioning based on job duty performance.
First, for a CSO’s scrutiny of politician performance to be effective, both politicians and citizens must accept its role. Both must believe that the CSO and the information it disseminates are impartial, accurate, and thus trustworthy. Politicians will seek to derail transparency initiatives that they believe are biased, and citizens will ignore political information they deem unreliable (Humphreys and Weinstein Reference Humphreys and Weinstein2012).
Second, politicians must believe that the disseminated information is salient for citizens to use as evaluative criteria (Lieberman, Posner, and Tsai Reference Lieberman, Posner and Tsai2014). Citizens, especially in low-income settings, may not perceive politician performance information as salient if they do not understand politicians’ job duties and how those translate into government outcomes. Disseminated performance information should therefore be contextualized as part of general civic education efforts (Chong et al. Reference Chong, Ana, Karlan and Wantchekon2015; Adida et al. Reference Adida, Gottlieb, Kramon and McClendon2016).
Third, politicians may not fear future citizen sanctioning unless they believe their constituents can commonly identify what constitutes an acceptable threshold of job performance. When there is little consensus regarding performance standards, initiatives have found it to be effective to benchmark politician performance information relative to other incumbents (Gottlieb Reference Gottlieb2016) or challenger candidates (Bidwell, Casey, and Glennerster Reference Bidwell, Casey and Glennerster2017).
Fourth, politicians are unlikely to improve their performance in anticipation of citizen sanctioning unless they believe that a sufficient number of citizens will use such information to inform their vote. Indeed, citizens may be unlikely to sanction politicians based on job duty performance if they think most other constituents continue to base their vote on other evaluative criteria (Chwe Reference Chwe2013). Therefore to facilitate voter coordination, transparency initiatives should disseminate information publicly (Bidwell, Casey, and Glennerster Reference Bidwell, Casey and Glennerster2017) and strive to reach as large a share of the constituency as possible (Adida et al. Reference Adida, Gottlieb, Kramon and McClendon2016).
Fifth, seminal accountability theories hold that principals and agents must have common knowledge of criteria for accountable behavior, and measurable evidence regarding the degree to which such criteria are fulfilled (Lindberg Reference Lindberg2013). Of course, a CSO must inform incumbents of transparency initiatives, or else politicians cannot be expected to know they should refocus their efforts in anticipation of possible citizen sanctioning. Citizens may also raise their expectations of politicians’ performance between elections when a common knowledge exists about their elected representative being regularly assessed. Raising citizens’ expectations of politicians’ performance facilitates sanctioning of underperforming incumbents (Gottlieb Reference Gottlieb2016).
Finally, the timing in the electoral cycle of a CSO’s information dissemination campaign matters. We argue that disseminating political information well in advance of the next election increases the likelihood that politicians will improve their performance. At a minimum, disseminating such information close to elections does not give politicians adequate opportunity to improve their performance in anticipation of citizen sanctioning. Instead, incumbents may respond to negative information by increasing vote buying (Cruz, Keefer, and Labonne Reference Cruz, Keefer and Labonne2017) or vote rigging and intimidation (Collier and Vicente Reference Collier and Vicente2012).
Furthermore, incumbent performance information disseminated early in an electoral term increases the pressure on incumbents to perform to deter the entry of new challengers. A CSO transparency initiative helps potential challengers identify weak incumbents; it also subsidizes challengers’ campaigns to unseat poor performers, because nonpartisan CSO-generated information is more credible than statements regarding incumbent performance made by the incumbents or challengers themselves. Given the time it takes to mount viable campaigns—especially in low-income newly democratizing countries where the opposition is cash strapped and campaigns are mostly self-financed—transparency initiatives early on in the electoral cycle are more likely to pressure low-performing incumbents in anticipation of challenger entry, which we discuss in more detail below.
Yet incumbents might ignore CSO transparency initiatives early in the electoral term, perhaps because they expect citizens to only focus on their performance directly prior to an election (Healy and Lenz Reference Healy and Lenz2014). However, such “end year” effects are arguably more relevant in high-income settings, where citizens are inundated with political information and may thus act on the basis of the most recently obtained information. In low-income contexts, politician performance information is scant: a CSO transparency initiative early in the term can critically shape a politician’s reputation. Incumbents may worry that once they develop a bad reputation, citizen perceptions of them would be hard to change, for example due to affirmation bias (Redlawsk, Civettini, and Emmerson Reference Redlawsk, Civettini and Emmerson2010). Further, a transparency campaign early in the term could also powerfully shape the type of performance criteria politicians expect citizens to utilize (Huber, Hill, and Lenz Reference Huber, Hill and Lenz2012).
Contextual Conditions for Transparency
Without a ready pool of viable challengers, citizens cannot credibly threaten to remove incumbents (Gordon and Huber Reference Gordon and Huber2007). Indeed, much of the formal accountability literature examining the effect of transparency on citizens’ behavior assumes that there are viable challengers available to replace poorly performing incumbents (Ashworth Reference Ashworth2012). However, in practice, many elections lack credible challengers, even in advanced democracies (Cox and Katz Reference Cox and Katz1996). Incumbents from “safe” constituencies may therefore reasonably conclude that even if the electorate becomes more informed about their poor performance, it will have minimal effect on their ability to retain their seat. Consistent with this expectation, past empirical work finds that where challengers exert greater electoral pressure—i.e., in competitive constituencies—reelection-seeking incumbents perform significantly better [e.g., Beazer (Reference Beazer2015)].
For political transparency initiatives to induce politicians to perform, therefore, a minimum threshold of political competition may be required. We argue that the fear of future challenger entry disciplines incumbents. While we have underscored that transparency initiatives early in an electoral term may facilitate candidate entry (Ashworth and Shotts Reference Ashworth and Shotts2015), it is more difficult for candidates to enter where the opposition has little presence. In electoral authoritarian settings, where opposition parties are resource constrained and weakly institutionalized, candidates and parties are especially strategic about where they compete. Thus, while all incumbents may fear new challengers, this threat is arguably more acute in historically competitive constituencies where opposition parties already have an infrastructure in place. We thus expect transparency initiatives to have a greater effect on subsequent incumbent performance in competitive constituencies.
Further, politicians may be concerned about social in addition to electoral sanctioning. When local politicians are embedded in solidary groups (for example, ethnic and religious groups), their reputation affects their standing in their community (Tsai Reference Tsai2007). Politicians who do not meet their group’s expectations face losing moral standing, whereas those performing well enjoy prestige. One testable implication of this logic is that politicians’ response to a CSO transparency initiative should be stronger when incumbents are embedded in more socially homogenous constituencies, regardless of the timing in the electoral cycle or the competitiveness of elections.
STUDY CONTEXT, STANDARD CSO ACTIVITIES, AND INTERVENTION
This study was undertaken in partnership with ACODE, a leading nonpartisan Ugandan CSO operating in 20 district (LC5) governments in the study area (Figure 1).Footnote 2 In this section, we describe the political context, the standard ACODE activities conducted throughout the study area, and the dissemination campaign.
Study Area

District Local Governments in Uganda
Uganda is an electoral authoritarian regime, the most common regime type for low-income countries globally and the modal regime type in Sub-Saharan Africa (Weghorst Reference Weghorst2015). The National Resistance Movement (NRM) has been in control of the national executive and legislature since 1986. Multiparty elections were introduced for the 2006 general elections. Our study takes place between the second and third multiparty elections in 2011 and 2016, respectively.
The record of Uganda’s political liberalization process, led by president Museveni, has been mixed (Tripp Reference Tripp2010), representing a broad regional trend in which liberalization reforms are enacted, but leaders secure their tenure in part by restricting political competition (Ochieng’ Opalo Reference Ochieng’ Opalo2012). Uganda has long been heralded as a “donor darling” among low-income countries, and Museveni’s pursuit of structural adjustment reforms has helped secure significant aid flows. While corruption scandals abound, public service delivery in Uganda and citizen welfare have undoubtedly improved in the past three decades. Many argue that the donor community is helping Museveni further entrench his power by supporting budgetary priorities that nourish his patronage networks (Green Reference Green2010), and by allowing him to take credit for improved service delivery provided by donor funds (Mwenda and Tangri Reference Mwenda and Tangri2005). While Museveni has not resorted to the types of ballot rigging used by some neighboring countries, he has nonetheless created an uneven playing field for opposition parties, mainly by intimidating opponents and creating an elaborate patronage network (Tripp Reference Tripp2010).
Under Museveni, the media and civil society enjoy relative freedom, at least compared to regional benchmarks. Indeed, the NRM has been known to accept a wide array of public criticism and grassroots mobilization around contentious issues—as long as these efforts fall short of directly attacking the president, his senior associates and his family. When that line is crossed, the NRM does not hesitate to use state power to quell critics (Tangri and Mwenda Reference Tangri and Mwenda2001). However, politics at the subnational level, where the political stakes are lower, tends to be freer of NRM entrenchment (Nsibambi Reference Nsibambi1998).
Uganda has three local government tiers: district (LC5), subcounty (LC3), and village (LC1). District governments are comprised of sectoral offices and an elected legislative body, the district council. Bureaucrats (called “technocrats” in Uganda) are chiefly responsible for implementing public services and projects according to the budget and work plan developed annually via collaboration between the technocratic and political branches and approved by the district council. District councils have the power to make laws (unless they conflict with the constitution), regulate and monitor public service delivery, formulate comprehensive development plans based on local priorities, and supervise the district bureaucracy (Grossman and Lewis Reference Grossman and Lewis2014).
The Local Government Act (1997) stipulates four areas of legally defined duties for elected representatives to the district council (“councilors”): legislative (e.g., passing motions in plenary, committee work), lower-level local government participation (e.g., attending LC1 and LC3 meetings), contact with the electorate (e.g., meeting with constituents, setting up an office), and monitoring (but not directly implementing) public service delivery to ensure service delivery standards are met. There are two main types of politicians serving on the district council, which we incorporate into our randomization scheme. In 2006, Uganda mandated that at least one-third of politicians were female. To achieve this goal, so-called “special woman councilor” constituencies, in which only female candidates can compete, were overlaid on top of “regular” subcounty constituencies. Special woman councilor constituencies encompass between one and three subcounties, depending on the population size. Thus, citizens are represented by two politicians: a (usually male) “regular councilor” and a (female) “special woman councilor,” who may also represent up to two additional subcounties.
In the study area, there are 149 special woman councilors and 247 regular councilors; 72% of politicians caucus with the NRM [Supplementary Material (SI), Table 2]. Notably, the share of NRM politicians varies across districts, from as low as about 20% of politicians from the NRM (in Lira) to 100% in Kanungu and Ntungamo (SI, Figure 1). The majority of politicians (53%) are serving their first term.
To be competitive, many Ugandan politicians distribute personal handouts. About two-thirds of politicians surveyed for this study reported spending an average of more than 2 million Ugandan shillings (600 USD)—an amount close to the country’s per capita GDP of 615 USD—on personal gifts during the 2011 election campaign. Performing their legally defined duties is not only less expensive for incumbents than handouts; it is also an evaluative criterion that is unavailable to challengers. Thus, shifting citizens’ criteria to legally defined duty performance should be attractive to (at least high-performance) politicians, especially in competitive constituencies where campaign costs run significantly higher.Footnote 3
Standard Activities: Performance Scorecard Initiative
In 2009, ACODE launched the Local Government Councilor Scorecard Initiative in consultation with various local stakeholders—including the Ministry of Local Governments, Uganda Local Government Association, district officials, and other governance CSOs—to improve district politicians’ performance of their legally defined duties as stipulated in the Local Government Act (1997). By training district councilors on these duties and generating information about their performance, ACODE seeks to improve politicians’ capacity to fulfill their responsibilities.
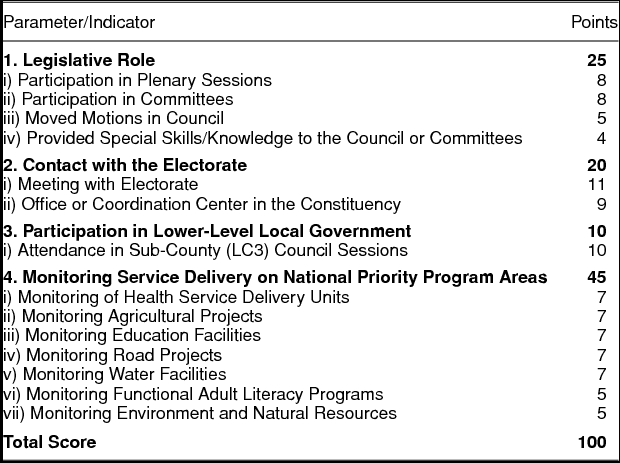
At the beginning of the legislative term (Spring 2011), ACODE conducted training sessions for all politicians in the study area. These sessions discussed councilors’ legally defined duties, offered advice on how best to fulfill these duties, provided politicians with useful tools (e.g., planners, monitoring checklists), and described the yearly scorecard. Table 1 details the scorecard components and their respective weights. The total score ranges from 0 to 100, mirroring conventional Ugandan school grading. ACODE researchers collect the underlying data to produce the scorecard annually in reference to the previous financial year (July to June). Importantly, the scorecard is based solely on administrative data rather than citizen attitudes. Once the scorecards are complete and vetted for quality control purposes (around September), ACODE disseminates them in district plenary meetings attended by district politicians, key bureaucrats, and party officials (every October-November).
ACODE Scorecard

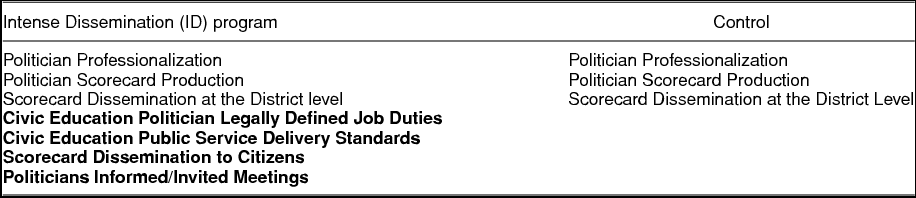
ACODE activities, summarized in Table 2 in light grey, are salient to politicians. At baseline, 96% knew about the program, and over 80% could name their latest score within ten points at endline. Importantly, the initiative is also well received by politicians, who generally view ACODE as unbiased and its scorecard as reliable. Tellingly, 94% of politicians recommended that the scorecard initiative should be scaled up throughout the country (SI, Section 2.5).
ACODE Activities in the Study Area

Note: Activities conducted throughout the study area in gray; those conducted only in treatment areas in black.
The Intensive Dissemination Program
This study examines the effect of ACODE’s ID program to disseminate information about politicians’ performance to their constituents in the middle of the electoral term. ACODE implemented the ID program in consultation with the research team in two rounds of parish-level community meetings held in treated constituencies. The first set of meetings took place in fall 2013 (354 meetings; 12,949 attendees) and the second in fall 2014 (339 meetings; 14,520 attendees).
As mentioned, ACODE conducts professionalization activities and releases the scorecard annually at the district level in plenums attended by political elites. Thus the ID treatment captures the effect of the scorecard on citizens above and beyond ACODE’s standard activities. The ID treatment isolates the effect of pressure on politicians from anticipated citizen responses and fear of future challenger entry beyond intrinsic, peer, or party pressure. Below we discuss the ID program treatment components, summarized in Table 2 in bold.
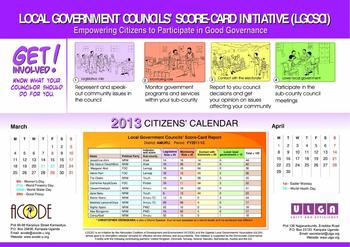
Meeting Recruitment. On average, 40 community members attended each meeting. Although open to the public, ACODE especially mobilized local leaders, targeting lower-tier government officials, religious leaders, service providers, and civil society (e.g., women’s and youth groups). Local leaders were intended to act as initial nodes in a wider dissemination process to other community members. To that end, meeting attendees were given fliers, posters, and calendars with a summary of the disseminated information to hang up in prominent public places (Figure 2).
Calendar Example

Meeting Content. Following our theoretical framework, dissemination meetings included a civic education module in which ACODE demonstrated how councilors’ actions contribute to public services delivery. ACODE provided information on politicians’ job duties, national and district government responsibilities, and legally defined service delivery standards. Then, ACODE disseminated politician scores benchmarked against all other district politicians’ scores. ACODE also collected attendees’ cell phone numbers and subsequently sent out periodic text messages reinforcing key information delivered at meetings (SI, Table 7). The research team deployed enumerators to the community meetings to track implementation compliance and to conduct a short poll with randomly selected participants to test for content comprehension and retention. In the SI (Section 2.6), we demonstrate that the meetings were successful in fulfilling their stated goals.
We use a pretreatment citizen survey, conducted in 2012, to demonstrate that the information ACODE disseminated to constituents was both new and salient. Only 9% of survey respondents at baseline reported hearing at least “something” about the scorecard initiative.Footnote 4 When asked to evaluate their politicians’ performance across the four domains of job duties, respondents’ evaluations did not correlate with the 2011–2012 scores (SI, Figure 7). Moreover, constituents’ priors were diffuse: a majority of respondents reported that they could not assess their politicians’ job duty performance. Further, citizens at baseline knew little about politicians’ legally defined duties. For example, 41% of respondents asserted that paying personal handouts was a legal responsibility, while 50% viewed private transfers as a de facto, if not a de jure, job duty.
The scorecard information was also salient: the activities reported by citizens as their main priority for politicians are highly correlated with their legally defined duties, and thus scorecard indicators (SI, Figure 8 and Section 2.7). The most important duty cited by a plurality of survey respondents was visiting schools and health centers (i.e., “monitoring services”), followed by regularly visiting villages (“contact with the electorate”), participating in council sessions and committees (“legislative” role), and providing assistance to communities and participating in LC3 and LC1 meetings (“lower-level local government participation”).
Treating Politicians. ACODE invited treated politicians to all dissemination meetings in their constituency and informed them of the meetings’ content. Politicians were also notified (via text message) whenever scorecard information was shared with constituents via text message (SI, Table 8). Therefore, the scorecard dissemination was common knowledge to citizens and politicians. The results from an endline survey conducted with all study area politicians suggests that politicians were successfully treated (SI, Section 2.8). Three years after treatment assignment, treated politicians were significantly more likely than control politicians to report that a large share of their constituents was aware of their score (50% and 37%, respectively). This result is consistent with our theoretical assumption that incumbents believe that “weak dissemination” efforts generate a noisier signal to constituents about their performance than the ID program.
RESEARCH DESIGN
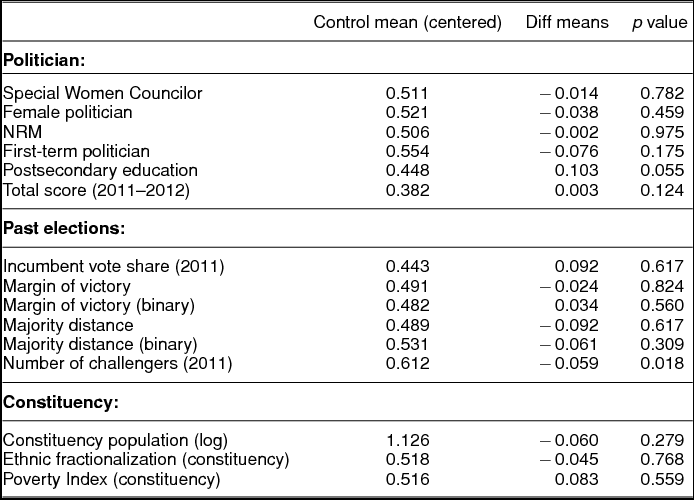
We use an experimental research design to study the effect of ACODE’s transparency initiative, assigning treatment in summer 2012. Since “regular” constituencies are nested within “special woman” constituencies, our unit of randomization is the special woman councilor constituency. Thus, citizens’ regular and special woman councilors are assigned the same treatment. We further blocked randomization at the district level. Table 7 shows that, with few exceptions, the randomization achieved a good covariate balance across treatment groups.
In our empirical analysis, we especially draw on information culled from five original surveys: pretreatment (2012) baseline surveys of (a) a random sample of constituents (N = 6,122) and (b) all district politicians in the study area (N = 396); and posttreatment (2015) endline surveys of both (c) district politicians (N = 375) and (d) district-level bureaucrats (N = 77). We also use (e) a short poll of a random sample of community meeting attendees, following program implementation, to examine information comprehension and retention (N = 1,766). See the SI for more detail on those surveys.
Data and Measurement
In addition to using ACODE’s scorecard as an outcome, we also collected data on other measures of politician performance. We measure politicians’ peer evaluations and bureaucrats’ assessments, which capture what district officials—rather than the CSO—consider to be high-level performance. Politicians and bureaucrats may use different dimensions than ACODE or assign different weights in evaluating performance. We also implemented a unique exercise—a school improvement grant—to provide a behavioral measure of politicians’ efforts to improve constituents’ welfare that is separate from their ACODE scores. See SI, Section 3 for further information on those outcomes, including distribution plots of the raw data.
Performance Scorecard. Our first outcome measure is politicians’ scores on ACODE’s scorecard. The first scorecard (2011–2012) captures performance prior to treatment assignment, and subsequent scorecards (2012–2013, 2013–2014, 2014–2015) capture posttreatment performance.Footnote 5 We focus on the treatment effect on the total score, but also report treatment effects on the scorecard’s four subcomponents. In the baseline 2011–2012 scorecard, the mean total score is 46 out of 100 (range 10 to 87), allowing politicians ample room for improvement.
Politicians’ Peer Evaluations. Our second outcome is performance evaluations elicited from fellow district politicians. All politicians were interviewed in person at endline, and were asked to evaluate, on a five-point scale, five randomly selected peers based on what they considered to be the most relevant performance dimensions. Since this design produced three to seven ratings for each politician, we averaged all peer assessments to create a single mean peer evaluation score.
Bureaucrats’ Assessments. We constructed a performance measure using the ratings of district bureaucrats, who have unique insight into politicians’ efforts and effectiveness in their job duties. Several activities that politicians undertake—e.g., writing reports or lobbying for targeted projects—require contact with the district offices responsible for delivering public services. Data for this measure was collected via in-person interviews with key technocrats in health, education, and general administration offices. Bureaucrats were asked to assess politicians along four performance dimensions, using a five-point scale. We averaged the ratings on these dimensions across surveyed bureaucrats to create a single composite index (Cronbach’s alpha = 0.91).
School Grant Applications. We implemented an original behavioral task that allowed us to test whether the transparency initiative can increase politicians’ broader efforts—under their direct control—to improve citizen welfare, even if those actions are “off the scorecard.” In fall 2015, all district councilors in the study area were informed of a grant program that was funded by the research team. Politicians were given the opportunity to help primary schools in their constituency apply for a small (about U.S. $100) grant to support school improvements. Grant applications involved mobilizing the school principal and PTA chair, whose signatures had to appear on the application forms. Politicians could submit one application per school for all schools in their constituency.Footnote 6 Politicians were given two weeks to submit the applications to the district education office, where the applications were time stamped. Valid applications were then entered into a public lottery at the district headquarters. The number of grants assigned to each district was proportional to the district population and ranged between two and five to ensure that the probability of winning was relatively constant across politicians. We received a total of 1,662 applications out of a possible 4,585. Of the submitted grant applications, 1,388 were valid and entered into the lottery; 61 grants were allocated to schools. To construct a performance measure, we use the number of valid grants, and conduct robustness checks using the number of incomplete grants and a binary variable indicating whether the politician facilitated at least one application.
Composite Index. We combine the above performance outcome measures into a single index. First, following Kling et al. (Reference Kling, Liebman and Katz2007), we estimate the mean treatment effect, which entails (1) recoding outcome variables so that higher values always indicate “better” outcomes, (2) standardizing those variables to allow comparable effect magnitudes,Footnote 7 (3) imputing missing values as the treatment assignment group mean, and (4) compiling a summary index that gives equal weight to each outcome component. The second method follows Anderson (Reference Anderson2008), who recommends constructing the summary index at stage (4) as a weighted mean of the standardized outcome component, where the weights—the inverse of the covariance matrix— maximize the amount of information captured by the index.Footnote 8 Both approaches are robust to overtesting because the index represents a single test. Individual measures are positively correlated (Cronbach’s alpha = 0.47).
Intense Dissemination (ID). The core independent variable is an indicator variable (ID) that equals 1 for politicians assigned to the treatment group and 0 for the control.
Constituency Competitiveness. To measure our core moderating variable, we assembled pretreatment electoral returns data from the 2011 elections culled from the Ugandan Electoral Commission. Following Cleary (Reference Cleary2007), we first calculate each politician’s Margin of victory, measured as −|W 2011 − C 2011|, capturing the difference in vote share of the incumbent politician (W 2011) and her main challenger (C 2011) in the 2011 constituency-wide local elections. For robustness, we follow Besley, Persson, and Sturm (Reference Besley, Persson and Sturm2010) and further construct a measure of Majority distance, measured as −|W 2011 − 0.5|. Consistent with our theoretical framework, these variables (ρ = 0.95) capture the extent of an incumbent’s uncertainty about her chances of reelection.Footnote 9 We further dichotomize both variables at the median value and report robustness to binary competitiveness measures, which have a value of one for more competitive constituencies.Footnote 10
Ethnic Fractionalization. Our second moderator—overlap between social group and political constituency—is proxied using a measure of ethnolinguistic fractionalization (ELF) calculated from the 2002 census using a simple Herfindahl concentration index; such that ELF = 1 − ∑ni = 1sj 2 where s j is the share of ethnic group j, and (j = 1. . .n).
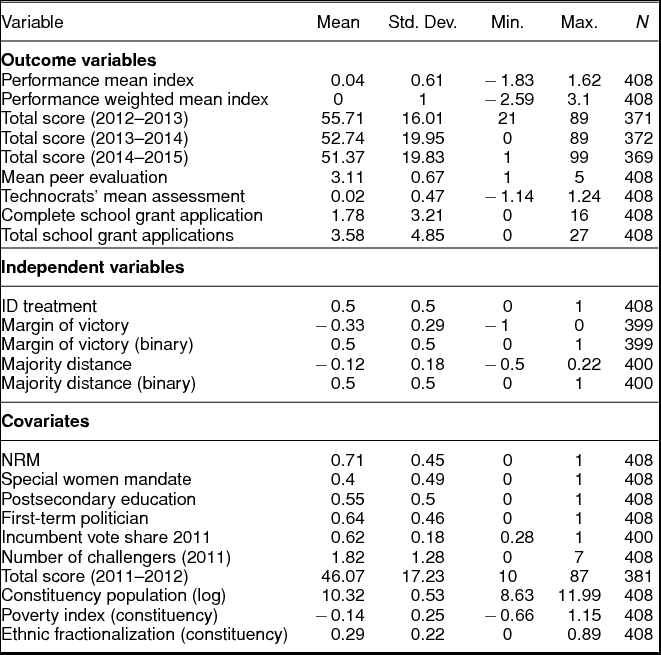
Additional Explanatory Variables. We estimate models with and without covariate adjustment. Politician-level variables include continuous measures of baseline scorecard total scores (2011–2012) and the number of challengers in the 2011 election, as well as indicator variables for caucusing with the ruling party (NRM), “special women” politician mandate, first-term politicians, and for attaining at least a postsecondary education. Constituency-level variables include a continuous measure of (log) population, and asset-based poverty level derived from the 2002 census. Table 3 shows descriptive statistics for all variables used in the study’s empirical analysis.
Summary Statistics

DV: Politician Performance Index

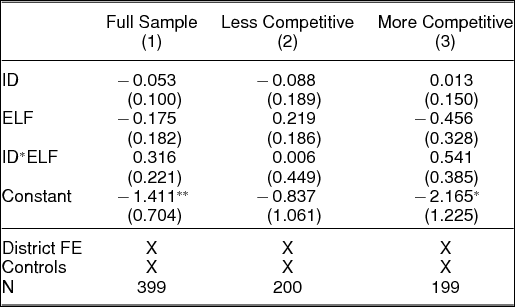
Notes: ELF refers to ethnolinguistic fractionalization. Models include district fixed effects and adjust for covariates. Models reported in columns 2–3 are estimated separately for high and low political competition, using the Margin of victory binary variable.
*p < 0.10, **p < 0.05, ***p < 0.01
Empirical Model
For all outcome measures, we estimate a series of cross-sectional ordinary least square (OLS) regressions, captured by Equation 1:
 $$\begin{equation}
Y_i = \alpha + \beta _1 ID_i + \phi + \gamma X + \epsilon _i,
\end{equation}$$
where Y i denotes the performance measure of politician i at the endline, ID the high transparency treatment assignment, ϕ district fixed effects (our blocking variable), and ε the error term clustered at the district level. Since the number of districts is relatively small (20), standard errors are bootstrapped using 1,000 repetitions (Cameron, Gelbach, and Miller Reference Cameron, Gelbach and Miller2008).Footnote 11 We report models with and without X, a vector of pretreatment politician and constituency covariates, defined above.Footnote 12
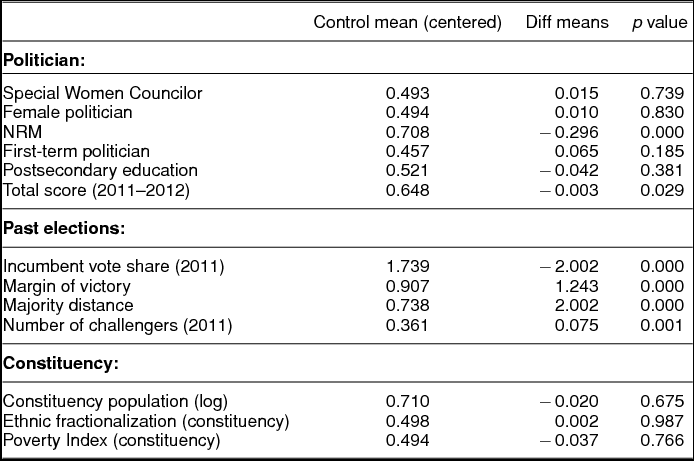
Since we hypothesize that the treatment effect would be greater in competitive constituencies, we re-estimate Equation 1 including the competitive variable Margin of victory and its quadratic as well as its interaction with the ID indicator.Footnote 13 However, while the ID treatment has been randomized, electoral competitiveness has not. Since competitiveness in the 2011 election is pretreatment, the conditional average treatment effect is well identified. However, this conditioning variable likely captures competitiveness and a bundle of factors that make a constituency competitive or mutually reinforce competitiveness. Thus, we interpret the competitiveness variable and its interaction to be this bundle; it is beyond the scope of this article to explain how some constituencies came to be more competitive. We therefore attempt to isolate competitiveness as much as possible using available data. Table 8 in the appendix shows that while competitiveness is not correlated with gender, mandate, past political experience, education attainment, constituency population, ethnolinguistic fractionalization, or development level, politicians from competitive constituencies face more challengers, have lower baseline scores, and are less likely to caucus with the NRM.Footnote 14 To disentangle competitiveness from the above covariates, we control for them in our conditional treatment effects regression analysis.
RESULTS
Our major finding is that the transparency ID program significantly increases politician performance, but only in competitive constituencies. For brevity, we report the average marginal treatment effects for all outcomes in graphical form (including 90% confidence intervals); the regression tables are available in the SI (Section 4). The graphs use standardized outcomes to ease coefficient interpretation, and are based on models in which we adjust for pretreatment covariates.
The transparency ID treatment had no discernible effect on politician performance across all outcome measures (Figure 3). The treatment effect point estimate on the index is close to zero (0.04 standard deviations) and insignificant (p-value =0.483). Using the scorecard as the outcome variable, the treatment point estimate is again small (0.09 standard deviations) and insignificant (p-value =0.274). Tellingly, the treatment effect is not larger than 0.1 standard deviations for any of the study’s outcomes measures.
DV: Performance outcome measures. Error bars denote 90% confidence intervals. Based on regression models that include district fixed effects and covariate adjustment. Standard errors clustered at the district level are bootstrapped using 1,000 iterations. ACODE total score averages across all posttreatment scores (2012–13, 2013–14, and 2014–15).

Conditional Average Treatment Effects
By contrast, we find that the transparency ID program had a large and significantly stronger effect on politicians from historically competitive constituencies, supporting the idea that electoral pressure is a necessary condition for transparency to improve incumbent performance. Figure 4 illustrates the marginal treatment effect conditional on competitiveness using the binary margin of victory measure (left panel) as well as the difference between the marginal effects (right panel). For example, using the composite index, the program’s effect in competitive constituencies is 0.17 (p-value =0.015), and the difference in the program effect between competitive and noncompetitive politicians is 0.24 standard deviations (p-value =0.044).
Treatment effects conditional on constituency competitiveness. The results are based on separate cross-sectional OLS regressions, adjusting for covariates, as described above. Outcome measures are standardized. Standard errors clustered at the district level are bootstrapped using 1,000 iterations.

Similarly, the transparency program’s effect on ACODE’s total score is 0.17 standard deviations in competitive constituencies (p-value =0.087) and 0.15 standard deviations using politicians’ peer evaluations (p-value =0.012). The significant conditional treatment effect for the school grant applications is especially revealing. Whereas politicians assigned to the control groups from competitive constituencies visited an average of 1.37 schools, those assigned to the treatment from competitive areas visited 2.1 schools: a 50% increase. The treatment effect in competitive constituencies is significant at the 90% level (p-value =0.079). Importantly, the positive treatment effect in competitive constituencies is consistent across almost all outcome measures.
We next estimate the effect of the ID treatment on ACODE’s scorecard components to further explore how politicians from competitive constituencies responded to the transparency initiative. Unlike other measures, for the scorecard we have annual scores, allowing a more robust difference-in-difference estimator. For each politician, we stack the scorecard score by year, and first run the following model:
 $$\begin{equation*}
Y_{it} = \delta_t+ \gamma_i + \beta ID_i\times Post_{2011-12} + \epsilon_{it},
\end{equation*}$$
where Y it is the total score of politician i in year t. Year and politician fixed effects—δt and γi—net out overall trends and time-invariant differences across politicians, respectively. Our variable of interest is the coefficient on interaction term (β), where ID is the treatment indicator, and Post 2011 − 12 is a dummy equal to one for posttreatment scorecards (i.e., after the baseline year 2011–2012); εit captures residual differences across politicians and years. Again, we do not find a significant (unconditional) treatment effect (SI, Table 12), but we do find a significant treatment effect conditional on constituencies’ competitiveness (SI Table 13 and Figure 5). Interestingly, our conditional models suggest that the significant effect of the transparency program on ACODE’s total score in competitive constituencies is driven by an increase in monitoring of service delivery and greater involvement in the governance of lower-level local governments (LC3 and LC1). These are important findings, especially since they require significant time commitments.
ACODE Score Components: Treatment effects conditional on political competition using difference-in-difference models, in which the treatment indicator is interacted with a post-2011 indicator. Models include district and year fixed effects and adjust for covariates as described above. Standard errors clustered at the politician level.

Whereas we find support for the idea that electoral competition moderates the relationship between information and incumbent performance, we do not find support for the social sanctioning mechanism. First, if incumbents were concerned about how performance information would affect their moral standing in their respective constituencies, we should have observed a significant ID treatment effect that is not conditional on the constituency’s competitiveness. Second, we test whether the treatment effect is increasing in the overlap between an incumbent’s social and political (constituency) groups. Using constituency ELF as a proxy measure for social group homogeneity within the constituency, we find no support for that hypothesis. In fact, the coefficient on the interaction has the “wrong” sign irrespective of the sample we use (full sample or subsamples based on the constituency’s level of competition).
Response to Treatment During the Electoral Cycle
The core of our theoretical argument, developed above, is that politician transparency initiatives can induce better performance if incumbents believe that nonresponse would adversely affect their chances of reelection. We have further argued that since the dissemination of performance information can encourage challengers to run against a poorly performing incumbent and taint the incumbent’s reputation—thereby increasing the likelihood of citizen sanctioning—transparency initiatives can induce incumbents to improve their performance even early in the term. Our theoretical argument has a clear, testable implication: we should observe that the ID treatment has had a positive effect on politicians’ performance (as captured by ACODE’s scorecard) in the middle of the electoral term, even years before the 2016 elections.
Consistent with our theoretical argument, we observe an immediate behavioral response from incumbents for both the 2012–13 and 2013–14 scorecards (Figure 6), irrespective of our measure of competitiveness (though in 2013–14, the treatment effect falls slightly below significance). This finding is important, as it suggests that transparency initiatives can mitigate the cyclical nature of accountability pressure throughout the electoral term. The politician endline survey provides further evidence that electoral pressure plays a role in treatment effectiveness. Incumbents assigned to the ID treatment were significantly more concerned that the scorecard would adversely affect their chances of reelection (74% versus 65%).
DV: Annual ACODE Total Score. The results are based on difference-in-difference OLS regressions, in which the treatment indicator is interacted with year indicators. All models include district fixed effects and adjust for covariates as described above. Models are estimated separately for high and low competition using the Margin of victory and majority distance binary variables.

Note, however, that we do not observe a significant treatment effect in 2014–15, likely because the last scorecard of the term was disseminated only at the district level and was not shared with constituents via community meetings, as were previous scorecards. The 2014–15 scorecard was released in October 2015 after potential challengers had already announced their candidacy.Footnote 15 Unfortunately, the structure of our data does not allow us to determine whether the effect petered out due to a lack of scorecard dissemination or due to the timing of the campaign year.
Robustness
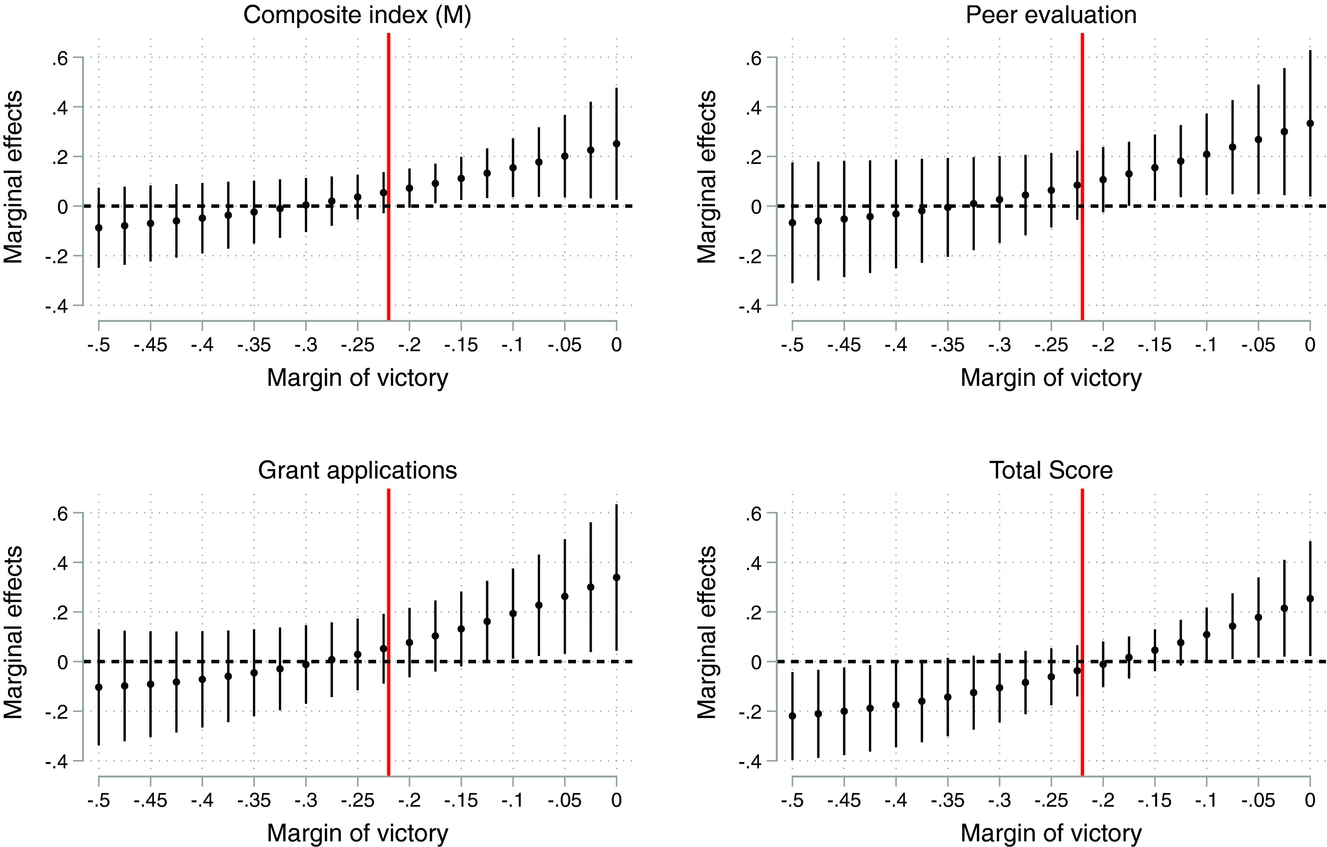
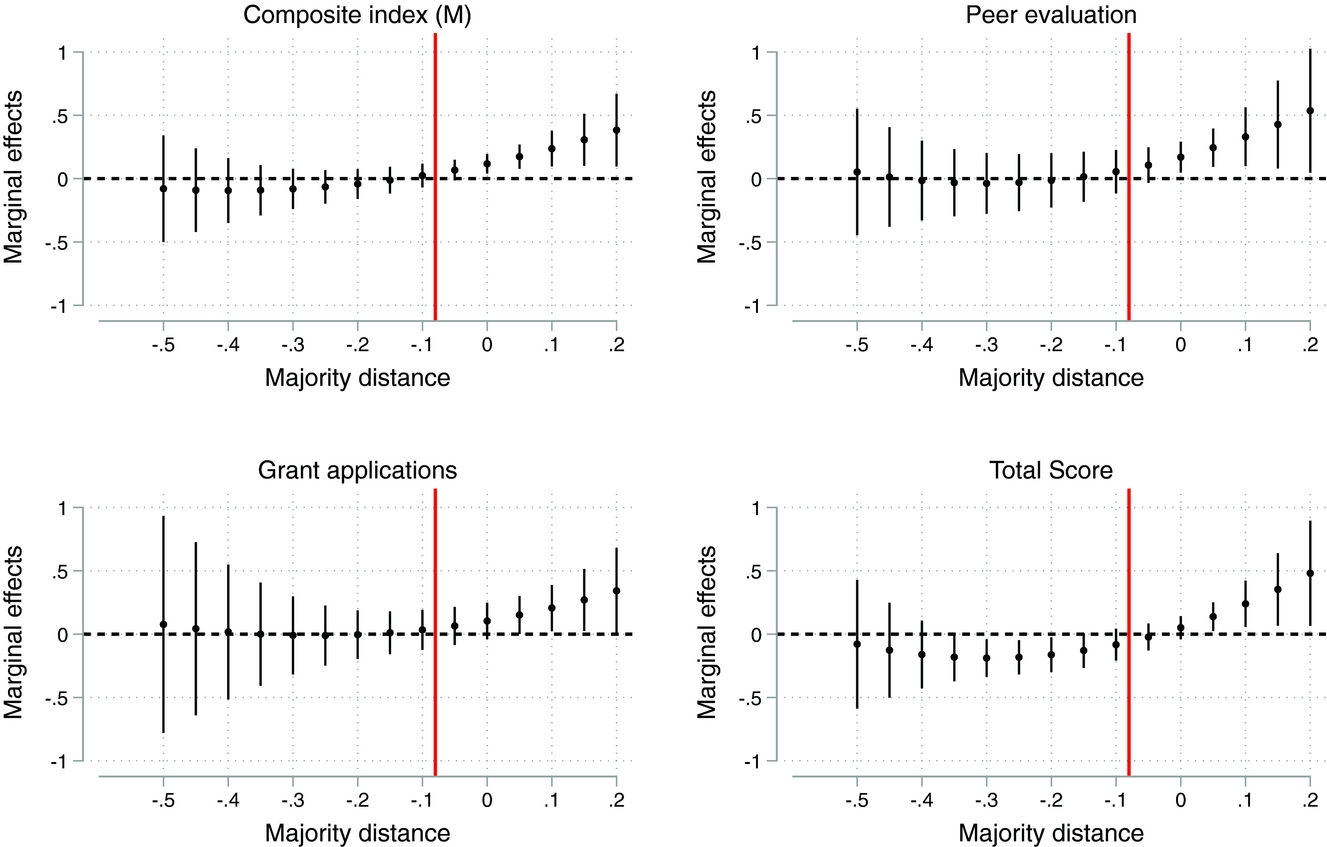
In this section, we demonstrate the findings’ robustness to alternative variable measurements and different model specifications. First, our results are robust to the inclusion of pretreatment covariates (SI, Section 4 lists detailed results). Second, our finding that the transparency ID program increases politician performance in more competitive constituencies is robust to using continuous measures of the margin of victory as well as a majority distance (Figures 7–8). The results show that as the election becomes tighter, the treatment effects are larger. Third, since for each politician we have multiple peer evaluations and multiple technocrat assessments, we are able to run models in which we stack all evaluations instead of calculating mean scores (SI, Sections 4.4 and 4.5). The technocrats’ assessment results are stronger when stacked, in part because they further allow controlling for each technocrat’s position and office.
Marginal treatment effects conditional on competitiveness measured as the margin of victory (MoV) in the 2011 elections. Models include the quadratic term of MoV, district fixed effects, and covariate adjustments. Standard errors clustered at the district level are further bootstrapped using 1,000 iterations.

Marginal treatment effects conditional on competitiveness measured as majority distance in the 2011 elections. Models include the quadratic term of majority distance, district fixed effects, and covariate adjustments. Standard errors clustered at the district level are further bootstrapped using 1,000 iterations.

Extension: Development Projects and Public Services
Exerting greater effort to fulfill legally defined job duties may not necessarily translate into tangible benefits for incumbents’ constituents. Thus, we examine whether the transparency treatment contributed to development outcomes using two data sources.
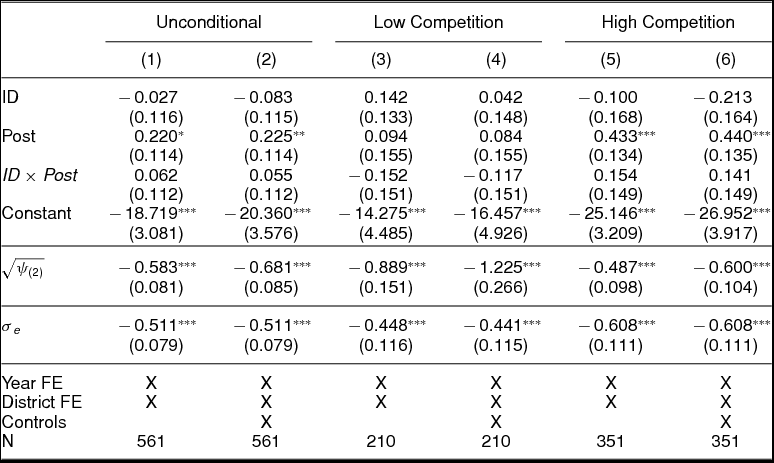
First, using districts’ annual budgets, we assemble data on the location and funding amount of all development projects.Footnote 16 We aggregate across sectors and parishes to create two annual measures of spending in each subcounty: (1) the log number of development projects and (2) log development spending. Since allocations in a given year reflect the previous year’s approved budget, we code 2012–13 as baseline (pretreatment) and 2013–14 and 2014–15 as posttreatment. We then estimate difference-in-difference multilevel models (councilors nested within subcounties), with and without covariate adjustment.
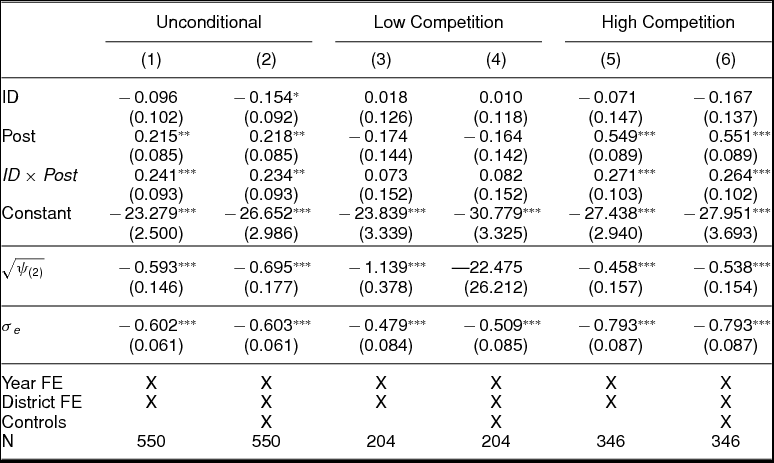
Consistent with the results reported above, we find no evidence of a significant (unconditional) treatment effect on development outcomes (Tables 5 and 6, columns 1–2). However, we find that politicians assigned to the transparency treatment from competitive constituencies implement a larger number of development projects (Table 5).Footnote 17 By contrast, log total project spending is not significantly higher in treatment competitive subcounties, even though the coefficient is relatively large (Table 6, columns 5–6). In other words, though treatment politicians are (understandably) unable to obtain a significantly larger slice of the budgetary pie, those hailing from competitive constituencies spend their share in more locations, arguably to reach a larger share of the constituency. This behavior is also consistent with an anticipatory electoral sanctioning mechanism.
DV: Number of Development Projects (Log)

Notes:  $\sqrt{\psi _{(2)}}$ refers to variability between constituencies and σe is the estimated standard deviation of the overall error term. The dependent variable has been standardized by financial year for comparability *p < 0.10, **p < 0.05, ***p < 0.01
DV: Development Projects Spending (Log)

Notes:  $\sqrt{\psi _{(2)}}$ refers to variability between constituencies and σe is the estimated standard deviation of the overall error term. The dependent variable has been standardized by financial year for comparability *p < 0.10, **p < 0.05, ***p < 0.01
Second, the research team conducted two rounds of unannounced audits of randomly selected public health clinics and schools during the posttreatment period—the first in early 2014 and the second in late 2014. The “in-charge” worker of the health center was asked about the center’s infrastructure, the availability of key medicines, and recent staff hiring and firing. Similarly, we interviewed school headmasters regarding the availability of classrooms, chalkboards, and books, as well as staff hiring and firing. We use this data to construct a variety of measures of service delivery. We find no evidence of a treatment effect on service delivery (SI, Section 5.2).
Scope and Limitations
We consider the scope conditions of the study’s core findings. First, we expect our findings to generalize to subnational candidate-centric legislators, elected via a majoritarian system as in the present case. A party-centric proportional representation system, which largely centers on political accountability through party discipline, likely necessitates other theories of accountability and therefore different CSO initiatives.
Second, Uganda’s political parties cannot be placed on a right-left spectrum, and while ethnicity is a salient social cleavage, a single ethnic group does not dominate either the ruling party or the main opposition parties. We recognize that the importance of left-right ideology or identity politics (e.g., copartisanship or coethnicity of candidates) may be overwhelming in other contexts, such that they would override “competence” considerations. We thus expect our findings to be broadly applicable to settings in which preferences for policy or identity congruence do not crowd out competence as an evaluative criterion for politicians.
Third, we do not expect political transparency initiatives to be effective in countries without a baseline level of political freedom for civil society to monitor and disseminate information about the performance of elected officials. Given the sheer dominance of its ruling party, Uganda is perhaps a hard test of the ability of transparency initiatives to incentivize better government performance. However, even in electoral authoritarian regimes, civil society is often freer to report on politicians’ (mis)conduct at the subnational level. It is thus unclear whether our findings generalize to high-stakes national politics. Testing the validity of these scope conditions is an important avenue for future work.
This study is not without limitations. For example, we were not able to capture all aspects of electoral pressure. While we capture interparty competition in the 2011 elections, data on party primaries—i.e., intraparty competitiveness—is not publicly available. Thus, in a sense, we underestimate previous electoral pressure, which should bias against our findings, if at all. Further, since ACODE chose not to disseminate the 2014–15 scorecard to constituents during the campaign season, we cannot determine whether the lack of discernible treatment effect in the last term year was due to this decision or to the timing of the dissemination of the last scorecard during the campaign season. Readers should not interpret the lack of dissemination in the last year as a shutdown of ACODE activities, given that “weak dissemination” activities still took place throughout the study area. Indeed, in part due to the study’s results, ACODE has expanded the scorecard initiative to more districts for the next electoral term.
DISCUSSION
Politicians can shirk their job duties in weak information environments, as the ones characterizing many low-income, newly democratizing countries. We find in a multiyear field experiment in Uganda that when a local CSO initiative increased the transparency of politicians’ job duty performance to their constituents early in the electoral term, politicians in competitive (but not safe) districts subsequently improved their performance. Further, treated politicians from competitive areas increased the number of development projects in their constituencies, but we find no evidence that they affected public service delivery. Importantly, the findings represent the marginal effect of increased information in the hands of citizens above and beyond assembling performance information and disseminating it to a limited number of local (district) elites.
These findings have important implications for political accountability scholarship. First, they underscore the idea that constituency competitiveness is likely a necessary condition for transparency initiatives to affect politician behavior. Especially in newly democratizing countries where opposition parties cannot widely mount credible campaigns, a viable challenger is more likely to arise in areas where the opposition already has a presence. In such constituencies, we postulate, a CSO transparency initiative exposing underperforming incumbents effectively subsidizes opposition campaigns, and inspires fear among incumbents that they must improve their performance or else be voted out. Given the importance of viable challengers for political accountability, more scholarly attention should be paid to understanding what influences potential challengers’ decisions about whether to run for office (Grossman and Hanlon Reference Grossman and Hanlon2014; Svolik Reference Svolik2013). In a follow-up paper, we examine the “downstream effect” of the transparency initiative on challenger entry and electoral outcomes.
Second, politicians in competitive constituencies improved their performance in the middle of the electoral term, demonstrating that transparency initiatives can help discipline politicians well in advance of elections. Past work has shown that the connection between citizens and their representatives commonly strengthens shortly prior to elections, and substantially weakens for many years between electoral campaigns (Michelitch and Utych Reference Michelitch and Utych2018). We speculate that the transparency program was effective in inducing a response from incumbents, even during the electoral term, at least in part because it was led by a local and reputable CSO that represented a sustainable (and thus predictable) feature of a new political incentive structure. If politicians were instead subjected to a noninstitutionalized initiative that was “one-shot,” they may presume the intervention would not represent a sustainable fixture of the political environment and therefore ignore it.
Third, our findings point to the role that information can play in incentivizing politicians to compete on the basis of performance. Notwithstanding the introduction of formal electoral institutions, accountability relations with respect to legally defined duties have remained weak, partly because politicians and citizens are thought to be locked in a mutually reinforcing pattern of clientelistic exchange or ethnic voting. Our study’s findings are consistent with the idea that politicians anticipate that citizens do care about their performance if performance information is available, but that citizens resort to using other criteria when such information is unavailable. Relatedly, a growing number of studies has explored the conditions under which citizens might sanction politicians at the polls after acquiring new political information (Dunning et al. Reference Dunning, Grossman, Humphreys, Hyde and McIntosh2018). Importantly, this study focuses instead on politicians’ behavior in response to a performance transparency initiative. Although studying politicians’ behavior is not easy, given its centrality to the study of political accountability, future work should continue exploring the conditions under which politicians improve their performance in response to changes in the information environment.
Fourth, we find that politicians (from competitive constituencies) only improved outcomes that are under their direct control, but did not influence outcomes such as public services delivery, which involve the actions and interactions of many actors across different levels and branches of government. One implication is that to improve the delivery of public services, one must strengthen a “long chain” of accountability relationships that also include the ties between politicians and bureaucrats (Raffler Reference Raffler2017), and between bureaucrats and service providers (Kosack and Fung Reference Kosack and Fung2014), in addition to those between citizens and politicians. Another implication is that public service delivery outcomes are poor evaluative criteria for citizens to use to hold individual legislatures accountable. We join others [e.g., Prat (Reference Prat2005)] in emphasizing that, at least for legislators, evaluative criteria for politicians’ performance should be based on performance of their domain of job responsibilities, not on outcomes over which they have little influence.
In addition to contributing to the political accountability literature, this paper offers policy-relevant lessons. It informs other politician scorecard initiatives, which have recently become a core interest for practitioners and policymakers globally. A key challenge of any such initiative is ensuring that underperforming politicians do not derail the program by discrediting the CSO’s methodology or intentions (Humphreys and Weinstein Reference Humphreys and Weinstein2012). Our conversations with ACODE and district officials (as well as focus group discussions we facilitated) suggest three possible reasons why politicians in Uganda accepted ACODE’s scorecard program. First, ACODE involved many local stakeholders in the early project stages, which produced broad agreement that the scorecard components accurately capture politician performance of their statutory job duties. Second, ACODE invested heavily in quality control to ensure that the scorecard initiative would be impartial and accurate. Third, politicians reported that ACODE’s capacity-building training and support at the start of the electoral term gave them a clearer expectation of the statutory responsibilities on which they were being scored. Last, since subnational politics are lower stakes than national politics and involve less seasoned politicians, we speculate that CSOs will encounter less resistance at this level. We suggest that future politician transparency initiatives may want to first establish themselves at the subnational level before scaling up to the national level.
SUPPLEMENTARY MATERIAL
To view supplementary material for this article, please visit https://doi.org/10.1017/S0003055417000648.
Replication material can be found on our Dataverse at: https://doi.org/10.7910/DVN/AI3VM8.
APPENDIX
Covariate Balance by Treatment Assignment

Covariate Balance by Competitiveness (2011)








Comments
No Comments have been published for this article.