


Methane (CH4) is a natural end product of anaerobic microbial fermentation in the rumen and is also a potent greenhouse gas (GHG), estimated to have 28 times greater global warming potential than carbon dioxide (CO2) (WRI, 2023). Emissions from the dairy industry are recognised as a major contributor to climate change (Scoones, Reference Scoones2023). Globally, livestock contribute approximately 17% of total anthropogenic GHG emissions (Kamyab et al., Reference Kamyab, SaberiKamarposhti, Hashim and Yusuf2024), of which dairy cattle account for approximately 20% of livestock-related emissions (Vaghar Seyedin et al., Reference Vaghar Seyedin, Zeidi, Chamanehpour, Nasri and Vargas-Bello-Pérez2022). In Ireland, enteric CH₄ from cattle and sheep contributes 63% of agricultural GHG emissions (EPA, 2026) and the agricultural sector as a whole accounts for 94% of national CH₄ output (EPA, 2025). Reducing methane emissions is therefore central to meeting Ireland’s climate targets of a 25% reduction relative to 2018 levels by 2030 (DAFM, 2022). Over the past two decades, numerous CH4 abatement strategies have been evaluated for ruminant livestock (Beauchemin et al., Reference Beauchemin, Kebreab, Cain and VandeHaar2025; Kreuzer, Reference Kreuzer2025; Tricarico et al., Reference Tricarico, Garcia, Bannink, Lee, Miguel, Newbold, Rosenstein, der Saag MR and Yáñez-Ruiz2025). Dietary manipulation, aimed at altering the rumen microbial community or its metabolic activity, is among the most extensively studied approaches (Qi et al., Reference Qi, Xue, Jia, Zhang, Yan and Sun2024; Thacharodi et al., Reference Thacharodi, Hassan, Ahmed, Singh, Maqbool, Meenatchi, Pugazhendhi and Sharma2024). A range of anti-methanogenic feed additives have been evaluated, including seaweeds (Malik et al., Reference Malik, Kolte, Trivedi, Tamilmani, Mohapatra, Vaswani, Belevendran, Sahoo, Gopalakrishnan and Bhatta2025), tannins (Aboagye and Beauchemin, Reference Aboagye and Beauchemin2019), essential oils (Belanche et al., Reference Belanche, Newbold, Morgavi, Bach, Zweifel and Yáñez-Ruiz2020), fat (Giagnoni et al., Reference Giagnoni, Lund, Johansen and Weisbjerg2025) and chemical based inhibitors (Kirwan et al., Reference Kirwan, Tamassia, Walker, Karagiannis, Kindermann and Waters2024; Roskam et al., Reference Roskam, Kenny, Kelly, O'flaherty and Waters2024) with numerous reviews summarising their effects (Ncho et al., Reference Ncho, Kim, Rang and Lee2024; Purba and Sangsawad, Reference Purba and Sangsawad2025; Smith et al., Reference Smith, Kelly, Kenny and Waters2022). Among these, 3-nitrooxypropanol (3-NOP; commercial name Bovaer, DSM, Heerlen, Netherlands) has been studied most extensively, with meta-analyses reporting average reductions in enteric methane of 33–39% (Dijkstra et al., Reference Dijkstra, Bannink, France, Kebreab and Van Gastelen2018; Kebreab et al., Reference Kebreab, Bannink, Pressman, Walker, Karagiannis, van Gastelen and Dijkstra2023). Its effectiveness is well established in total mixed ration (TMR) feeding systems, where it can be consistently incorporated into the diet. In contrast, its application in pasture-based systems remains challenging due to limited supplementation opportunities and the high forage composition of the diet (∼96% fresh weight [FW], of which ∼75% is grazed) (O'Brien et al., Reference O'Brien, Moran and Shalloo2018). In addition, the efficacy of 3-NOP appears sensitive to diet composition, particularly fibre level (Dijkstra et al., Reference Dijkstra, Bannink, France, Kebreab and Van Gastelen2018; Kebreab et al., Reference Kebreab, Bannink, Pressman, Walker, Karagiannis, van Gastelen and Dijkstra2023), and reductions may be transient when pulse-dosed (Reynolds et al., Reference Reynolds, Humphries, Kirton, Kindermann, Duval and Steinberg2014). Although 3-NOP has demonstrated consistent methane reduction under controlled feeding conditions, its use requires continuous inclusion of a synthetic additive, may increase feed costs and presents practical challenges in pasture-based systems. These limitations highlight the need to explore alternative, biologically derived mitigation strategies compatible with grazing systems.
Direct-fed microbials (DFMs), particularly lactic acid bacteria (LAB), represent a promising natural alternative due to their ability to modulate the rumen microbiome, thereby affecting feed efficiency and methane emissions (Doyle, Reference Doyle2023). They inhibit the growth of spoilage organisms through the production of organic acids, hydrogen peroxide and ribosomally synthesised peptides known as bacteriocins (Cotter et al., Reference Cotter, Ross and Hill2013). Because of these properties, LAB are extensively applied as silage inoculants to improve fermentation profile, reducing deterioration and nutrient losses (Carvalho et al., Reference Carvalho, Sales, Schwan and Ávila2021; Mejía-Avellaneda et al., Reference Mejía-Avellaneda, Suárez, Jiménez and Mesa2022). Several studies have also reported that LAB silage inoculants can improve animal performance (Daniel et al., Reference Daniel, Queiroz, Arriola, Daetz, Basso, Romero and Adesogan2018; Nair et al., Reference Nair, Huaxin, Andrada, Yang, Chevaux, Drouin, McAllister and Wang2020; Oliveira et al., Reference Oliveira, Weinberg, Ogunade, Cervantes, Arriola, Jiang, Kim, Li, Gonçalves and Vyas2017). Furthermore, numerous studies have investigated the use of LAB to help meet ruminant CH4 emissions reduction targets (Doyle et al., Reference Doyle, Mbandlwa, Kelly, Attwood, Li, Ross, Stanton and Leahy2019; Huyen et al., Reference Huyen, Martinez and Pellikaan2020; Christelle Philippeau et al., Reference Philippeau, Lettat, Martin, Silberberg, Morgavi, Ferlay, Berger and Nozière2017).
There are also reports that bacteriocins from LAB can inhibit CH4 production both in vitro and in vivo (Z Li et al., Reference Li, Wang, Usman, Khan, Zhang, Li, Bai, Chen, Zhang and Guo2023c; Renuka et al., Reference Renuka, Punia, Srinivasulu, Goud, Singh, Sharma, Saini, Devi, Kumar and Singh2013; Shen et al., Reference Shen, Liu, Yu and Zhu2017). Numerous in vitro studies have reported that LAB-inoculated silage has the potential to reduce CH4 production in the rumen (Z Li et al., Reference Li, Li, Kharazian and Guo2023b), although relatively few in vivo studies have confirmed this effect in cattle (Qi et al., Reference Qi, Xue, Jia, Zhang, Yan and Sun2024). Therefore, the primary rationale for this trial was to determine whether grass silage inoculated with bacteriocin-producing LAB could reduce enteric CH₄ emissions in dairy cows under pasture-based conditions.
This study investigated the impact of feeding grass silage inoculated with LAB on CH₄ production in dairy cows. The silage inoculant contained two bacteriocin-producing strains, Lactiplantibacillus plantarum LP58 (Lpb. plantarum LP58) and Lactococcus lactis subsp. lactis SL242 (L. lactis subsp. lactis SL242). It was hypothesised that feeding this silage would improve animal performance and alter the rumen microbiome, ultimately leading to reduced CH4 emissions.
Materials and methods
Detection of antimicrobial activity
Lactiplantibacillus plantarum LP58 (14D/CSL; LACTOSIL 3.0; CECT 4528) and L. lactis SL242 were obtained from SACCO (Sacco Srl, Via Manzoni 29/A, 22071 Cadorago, Italy). Lactiplantibacillus plantarum LP58 was cultured aerobically in Lactobacillus selective broth (LBS; Oxoid Ltd, Basingstoke, UK) at 30°C for 48 h. L. lactis SL242 was cultured anaerobically in glucose-M17 (GM17; Merck KGaA, Darmstadt, Germany) broth at 30°C for 24 h. Cell-free supernatants (CFSs) were prepared via centrifugation at 9,500 × g for 10 min at 4°C to remove live cells, and the resulting supernatants were neutralised to pH 6.9–7.2 using 1 M NaOH to eliminate inhibition due to acid production. Bacteriocin production of CFS was verified using deferred antagonism assays with Lactobacillus delbrueckii ssp. bulgaricus LMG 6901 as the indicator strain (Ryan et al., Reference Ryan, Rea, Hill and Ross1996).
Methane (CH4) inhibition assays
Cultures of M. boviskoreani JH1T, M. gottschalkii HOT (DSM 11977) and M. ruminantium M1T (DSM 1093), belonging to three different Methanobrevibacter clades (Poehlein et al., Reference Poehlein, Schneider, Soh, Daniel and Seedorf2018), were obtained from DSMZ (Braunschweig, Germany) and grown in DSMZ medium 1523 at 39°C for use in CH4 inhibition assays. At the beginning of the log phase of methanogen growth (day 3), CFS prepared from Lpb. plantarum LP58 and L. lactis SL242 (30% vol/vol) were added anaerobically into actively growing methanogen cultures. Each trial was carried out over an 11-day period, consisting of CH4 sampling every 2 days, followed by the replacement of the gas headspace with fresh H2:CO2 (80:20, v/v). Methane concentration was quantified using an 8000-GC Series gas chromatograph (System GC-4) equipped with a flame ionisation detector (FID) at Teagasc Research Centre, Johnstown Castle, Co. Wexford (Rira et al., Reference Rira, Chentli, Boufenera and Bousseboua2015). Separation was performed under isothermal conditions at 50°C with heat-only zones maintained at 100°C and the FID block at 300°C. Helium was used as the carrier gas under pressure-controlled conditions (24–25 psi), providing a column flow of 1.0 ml/min and total flow of 50 ml/min (linear velocity 30 cm/s). The FID was supplied with hydrogen (30 ml/min), air (300 ml/min) and helium make-up gas (10 ml/min). Headspace gas samples (2 ml) were injected manually. Total run time was 6 min, and methane was identified at a retention time of approximately 2.25 min. Quantification was performed using an external standard calibration curve (1–100 ppm CH₄) with linear regression. Methane inhibition (%) was calculated relative to untreated control cultures using the following formula: Methane inhibition (%) = 100 × [1 − (methane volume of treated culture/methane volume of control culture)]. Control cultures consisted of methanogen cultures supplemented with an equivalent volume (30% v/v) of sterile, uninoculated and pH-adjusted culture medium to account for dilution effects. All control and treatment cultures were prepared in triplicate and incubated under identical conditions. All treatment and control samples were prepared in triplicate.
Silage management
Grass silage was harvested using a 3 m Pottinger rear mower (POETTINGER Ireland Ltd, Glenaleamy, Co. Tipperary, Ireland) on 10 July 2020 at the Teagasc Animal and Grassland Research and Innovation Centre, Moorepark, Fermoy, Co. Cork, Ireland. The pre-cutting herbage mass was approximately 4,000 kg DM/ha, and the sward, which was predominantly perennial ryegrass (>85%; cv. Fintona, Moira and Astonconqueror) with a mix of meadow grasses (Poa and Festuca pratensis), was 3 years old. The sward was wilted for 24 h to achieve a DM content of 25–30% prior to ensiling. Two batches of grass silage were prepared: one for the CONT group and one for the LAB group. Prior to inoculation, LAB counts were performed to confirm starting inoculum levels. Silage samples (2 g) were mixed with 18 ml of phosphate-buffered saline (PBS, pH 7.4) and homogenised in a stomacher bag using a stomacher blender (Interscience BagMixer 400, Saint-Nom-la-Bretèche, France) for 3 min at maximum speed. Following homogenisation, samples were serially diluted in PBS (10−1–10−5) and 100 µl spread-plated onto de Man, Rogosa and Sharpe agar (Difco™, Becton Dickinson, Franklin Lakes, NJ, USA). Both treated and control silages had initial LAB counts of approximately 7.5 log CFU/g prior to inoculation. A freeze-dried commercial preparation of Lpb. plantarum LP58 and L. lactis SL242 was used as the silage inoculant, with a CFU target of 1.76 × 10⁷ CFU/g for Lpb. plantarum and 8.64 × 10⁶ CFU/g for L. lactis (information provided by SACCO). These preparations were diluted with sterile chlorine-free water and added to a Hardi sprayer (Hardi International, Herthadalvej 10, 840 Nørre Alslev, Denmark) mounted on a tractor, containing 250–1000 l of water. The inoculant was sprayed directly onto the 1.2 m swath at a flow rate of 6.08 l/min and a forward driving speed of 8 KPH, achieving an application rate of 0.12 kg additive/1000 kg DM of grass. The grass was then harvested using a Kuhn FBP 3135 baler (Kuhn Farm Machinery Ltd, Stafford Park 7, Telford, Shropshire, GB) with a 1.8 m pick-up. A total of 15,000 kg DM was treated with a silage inoculant and ensiled, while an equivalent 15,000 kg DM from the same area was ensiled without the inoculant. Both treated and control bales were then ensiled for 98 days prior to feeding. Bales for the CONT treatment were wrapped in black plastic, and LAB treatment bales were wrapped in purple plastic. Silage bales were fermented for 12 weeks prior to the start of the feeding trial. Sampling was performed using a sanitised stainless steel bale silage sampler (Grasstec Ltd, Cork, Ireland) to prevent cross-contamination; cores from four bales were combined and split into two subsamples: one for immediate analysis and one stored at −20°C. Untreated silages were sampled first, followed by inoculated silages. Figure S1 provides images of the silage manufacturing process.
Chemical composition of silage
Fresh silage samples were collected twice weekly on Mondays and Thursdays over the 7-week experimental period. A 100 g sample was dried at 40°C for 48 h to determine DM and milled through a 1 mm screen (Cyclotec 1093 Sample Mill – FOSS, Nils Foss Allé 1, DK-3400 Hillerød, Denmark) prior to chemical analysis. Similar to Hart et al. (Reference Hart, Huntington, Wilkinson, Bartram and Sinclair2015), a subsample of fresh forage was analysed for pH and ammonia N content. The chemical composition of the milled silage samples was analysed for organic matter digestibility (OMD), crude protein (CP), neutral detergent fibre (NDF) and ash concentrations. The OMD was estimated using the in vitro neutral detergent cellulase method as described by Morgan et al. (Reference Morgan, Stakelum and Dwyer1989) (Fiberec™ Systems; Foss, Ballymount, Dublin, Ireland). CP concentration was determined using an N analyser (Leco FP-428; Leco Australia Pty Ltd, Baulkham Hills B.C. zxNSW, Australia) using the method described by Sweeney et al. (Reference Sweeney1989), while NDF content was analysed using an Ankom 2000 Fiber Analyzer as outlined by Ankom Technology Corporation (NY, USA) by the method adapted from van Soest et al. (Reference van Soest, Robertson and Lewis1991). Amylase and a sodium sulphite solution were used in the NDF concentration determination process. Ash content of each milled sample was determined by burning the sample at 550°C for 16 h using a muffle furnace. Gross energy (GE) content of both silage and concentrate used was determined by bomb calorimetry.
Animal study design
The study was conducted at the Teagasc Animal and Grassland Research & Innovation Centre in Moorepark, Fermoy, Co Cork, Ireland (52°09′42.4″N, 8°15′10.3″W) with 30 late-lactation, spring-calving dairy cows (6 primiparous, 24 multiparous) selected from the Moorepark herd, based on breed, parity, calving date and animals that had previously used the GreenFeed emissions monitoring (GEM). Of the 30 cows enrolled in the study, 24 were allocated for CH₄ measurements (n = 12 per treatment), and 6 rumen-cannulated cows were assigned for rumen sampling and microbiome analyses (n = 3 per treatment). The experiment was conducted over a 7-week period from 19 October to 6 December 2020. The treatment groups consisted of a control (CONT) and an inoculated treatment (LAB) group. The cows were blocked by breed and parity and balanced for key factors such as calving date, lactation number and milk production traits (Supplementary Tables S1 and S2). Pre-experiment (2 weeks), all cows were managed as one group and allocated 15 kg DM/cow/day of untreated grass silage (control silage taken from the same harvest as the inoculated treatment silage), supplemented with 2 kg of concentrate. The concentrate was made up of soybean meal (300 g/kg of FW), beet pulp/molasses (155 g/kg), barley (150 g/kg), maize (130 g/kg), maize distillers (120 g/kg), rapeseed meal (75 g/kg), Megalac (33 g/kg; Volac Wilmar Feed Ingredients Ltd, Hertfordshire, UK), maize/beet (25 g/kg), acid buff (7 g/kg) and salt (5 g.kg); the unité fourragère lait content of the concentrate was 0.92 and the CP content was 14%.
At the beginning of the trial, mean body weight and days in milk across all cows were 582 ± 58 kg and 245 ± 19 days, respectively (Supplementary Table S2). During the experimental period, cows were housed in a custom-designed cubicle shed with free access to water, adequate feeding space and cubicles cleaned and limed daily. The treatment groups were housed separately in accordance with a randomised factorial block design, with a daily herbage allocation of 15 kg of grass DM/cow/day plus 2 kg of a 14% CP concentrate/day. Each cow had an ID number, displayed on an ear tag, used throughout the trial. The experiment lasted 7 weeks (49 days), with a 2-week adaptation period for training with the GreenFeed system for methane measurements and acclimatisation to the silage feed prior to the commencement of the trial. Cows were fed once daily after morning milking using a Keenan Mechfibre 350 mixer wagon, with silage provided ad libitum, with allocations adjusted daily based on the level of feed left each day prior to feeding. Based on dry matter intake (DMI) on week 4, it was determined that each cow received an average daily dose of 2.56 × 10¹¹ CFU of Lpb. plantarum LP58 and 1.26 × 10¹¹ CFU of L. lactis SL242. Cows were milked twice daily for the duration of the experiment and were offered concentrate both at 07.00 and 15.30 milkings, but also through the GEM unit (Greenfeed; C-Lock Inc., Rapid City, SD, USA).
Animal performance: DMI, body weight and body condition score, milk yield and milk composition
Individual DMI was estimated once during the experimental period (week 4) when animals were fully adapted to the experimental diets. DMI estimations were carried out using the n-alkane technique as described by Mayes (Reference Mayes, Lamb and Colgrove1986) and modified by Dillon and Stakelum (Reference Dillon and Stakelum1989). Cows were dosed twice daily before milking, with an alkane bolus containing 500 mg of dotriacontane (C32 – alkane) for 12 days. Individual faecal samples were collected from day 7 to day 12 (prior to am and pm milkings), either in the shed during the hour immediately before milking by observing the cows and collecting the sample when voided or by rectal grab sampling after milking. Faecal samples were stored at −20°C before analysis. Faecal samples from each cow were thawed and bulked together (14.4 g from each sample), dried at 60°C in an oven for 48 h, milled through a 1 mm screen and analysed for alkane content. In conjunction with the faecal collection, 2 silage samples of approximately 15 individual silage snips were manually collected from each group from day 6 to day 11. The daily samples were stored at −20°C. The frozen herbage samples were bowl-chopped (Muller, Type MKT 204, Special, Saarbrucken, Germany), freeze-dried at −50°C for 72 h, milled through a 1 mm screen and analysed for alkane content, as described by Hameleers and Mayes (Reference Hameleers and Mayes1998) and modified by Dillon (Reference Dillon1993). Four kilograms FW of concentrate was fed per cow daily over the course of the experimental period. Additionally, group-level FW intake was recorded, and refusals were weighed back weekly. Prior to feeding, one weekly refusal was measured by bulking and weighing residual FW silage within each treatment. Body weight and body condition scores (BCSs) were recorded fortnightly throughout the experiment. Cows were weighed using an electronic portable weighing scale using the Winweigh software package (Tru-test Limited, Auckland, New Zealand). BCS was assessed by a trained professional using a scale from 1 to 5 (where 1 = emaciated, 5 = extremely fat), increasing in 0.25 increments, as described previously (Lowman et al., Reference Lowman, Scott and Somerville1976). Cows were milked twice daily at 07.00 and 15.30, with an average of 2 h/day spent out of the shed in the collecting yard and the milking parlour. Individual milk yields were measured daily during milking (Dairymaster, Causeway, Co. Kerry, Ireland) for the duration of the 7-week study. Milk protein, fat and lactose concentrations were determined weekly from one successive evening and morning milking using mid-infrared spectroscopy analysis (MilkoScan 203, Foss Electric DK-3400, Hillerød, Denmark).
Methane measurements
Enteric CH₄ emissions were measured using the GEM system (Greenfeed; C-Lock Inc., Rapid City, SD, USA) (Supplementary Figure S2), following the methodology described by Hristov et al. (Reference Hristov, Oh, Giallongo, Frederick, Weeks, Zimmerman, Harper, Hristova, Zimmerman and Branco2015) and Huhtanen et al. (Reference Huhtanen, Cabezas-garcia, Utsumi and Zimmerman2015). Daily CH₄ data were obtained from 24 (non-cannulated) cows over the duration of the experimental period. Methane data from the six rumen-cannulated cows were not used for analysis. There was a 2-week adaptation period prior to the experimental period to allow animals to be trained to the GEM and adaption to grass silage and concentrate. During the adaptation period, animals were allocated 15 kg of grass silage (control silage taken from the same harvest as the inoculated treatment silage) along with 2 kg of concentrate, as described above. Each treatment group was assigned a GEM unit, and cows could voluntarily visit the units at 4 h intervals during each 24 h period. To encourage visits, 32 g of pellet-form concentrates, similar to that provided in the parlour as previously described, were dispensed in 20 s intervals, with a maximum of 10 drops per cow per visit (maximum of 320 g per day). Both groups visited the GEM units consistently, with an average of 2.69 visits per day for the LAB group (n = 12) and 2.60 visits for the CONT group (n = 12), which was above the recommended average for reducing coefficient of variation in emission data (Coppa et al., Reference Coppa, Jurquet, Eugène, Dechaux, Rochette, Lamy, Ferlay and Martin2021). Animal GEM visit duration (242.97 s) was above the recommended average of 180 s (Arthur et al., Reference Arthur, Barchia, Weber, Bird-gardiner, Donoghue, Herd and Hegarty2017; Della Rosa et al., Reference Della Rosa, Jonker and Waghorn2021), with all feeding periods greater than 120 s used for analysis in the current study. Each week, air filters were cleaned and changed on the GEM units to keep airflow above 27 l/s. A CO2 recovery was performed on the GEM units before starting the trial, on week 4 and at the end of the trial to ensure accurate data collection, by releasing a known amount of CO2 directly into the GEM unit for a period of 180 s, followed by a waiting period before the next release. The initial weight and final weight of the CO2 canister were recorded. This process was repeated on three occasions at each CO2 recovery estimation to calculate percentage recovery (average percentage recovery, 100.43 ± 3.48%). Daily auto calibrations were also performed on each unit, as described by Della et al. (Reference Della Rosa, Jonker and Waghorn2021). Zero gas (N2) was first released, followed by span gas with known concentrations of CH4, CO2 and H2. This procedure ensured accurate calibration of non-dispersive infrared spectrometer.
Rumen sample collections
Six rumen-cannulated (101.6 mm internal diameter, Bar Diamond Inc., Parma, USA) cows that were already available at Teagasc, Moorepark, were selected on calving date and parity. Cannulated cows were blocked on calving date, lactation number and their previous 2 weeks’ milk yields and randomly assigned to treatments (n = 3 rumen-cannulated animals per group). The cows remained on their allocated treatment for the duration of the experiment. Rumen samples were taken from each cannulated cow at two time points: 07.30 and 15.00 on two consecutive days at weeks 1, 4 and 7. Solid and liquid rumen contents were obtained from four representative locations of the rumen of each cow and strained through three layers of synthetic cheesecloth to separate the solid and liquid fractions as previously described (O'Callaghan et al., Reference O'Callaghan, Vázquez-fresno, Serra-cayuela, Dong, Mandal, Hennessy, McAuliffe, Dillon, Wishart and Stanton2018). For rumen microbiome analyses, two whole (containing solid and liquid fractions) samples were snap-frozen in liquid nitrogen at −80°C until analysis. Two additional snap-frozen samples were stored at −20°C.
DNA extraction
Total genomic DNA was extracted from rumen samples collected throughout the trial. DNA extraction was performed using the Qiagen QIAamp DNA Stool Kit (Qiagen Ltd, Manchester, England) protocol, with some modifications to accommodate rumen fluid and maximise DNA yield, according to Zeale et al. (Reference Zeale, Butlin, Barker, Lees and Jones2011). Briefly, 200 μl of rumen fluid was transferred to a tube containing tungsten carbide beads and 1.4 ml Buffer ASL and homogenised in a Qiagen TissueLyser for 5 min at 24 Hz. Proteinase K (20 mg/ml) was then added; the suspension was mixed thoroughly and incubated for 30 min at 70°C. DNA extraction was then completed according to the manufacturer’s instructions, except that DNA was eluted in 50 μl Buffer EB (Sigma) to increase the final DNA concentration. Genomic DNA concentration was determined using a Qubit™ 3.0 Fluorometer with the dsDNA HS Assay Kit.
16S rRNA gene amplification and MiSeq sequencing
Using the 16S metagenomic sequencing library protocol (Illumina), the V3–V4 hypervariable region of the 16S rRNA gene was amplified from DNA samples. A no-sample (buffer-only) DNA extraction blank for every sample type studied and a no-template negative-control sample for every sequencing library were prepared. DNA was amplified with primers specific to the V3–V4 region; forward primer 5′ TCGTCGGCAGCGTCAGATGTGTATAAGAGACAGCCTACGGGNGGCWGCAG; and reverse primer 5′ GTCTCGTGGGCTCGGAGATGTGTATAAGAGACAGGACTACHVGGGTATCTAATCC. Each PCR reaction contained template DNA (5 ng/µl), 1 µl forward primer (5 µM), 1 µl reverse primer (5 µM), 12.5 µl 2X KAPA2G Robust HotStart ReadyMix (Anachem, Dublin, Ireland) and PCR-grade water. The PCR conditions for amplification consisted of a heated lid at 110°C, initial denaturation at 95°C × 3 min, 30 cycles of 95°C × 30 s, 55°C × 30 s, 72°C × 30 s, followed by 72°C × 5 min and holding at 4°C. The PCR amplicons were visualised using gel electrophoresis (1X TAE buffer, 1.5% agarose, 100 V) stained with SYBR Safe (Thermo Fisher, MA, USA). Amplicons were cleaned using AMPure XP magnetic bead-based purification (Labplan, Dublin, Ireland) and subjected to a second PCR reaction. Illumina sequencing adapters and dual‐index barcodes (Illumina Nextera XT indexing primers, Illumina, Sweden) were added to the purified DNA (5 µl) to index each of the samples, allowing the library to be pooled for sequencing, as outlined in the Illumina library preparation protocol. Samples were quantified using the Qubit™ 3.0 Fluorometer using dsDNA HS Assay Kit, and samples were then pooled in an equimolar fashion. The pooled sample was run on the Agilent Bioanalyzer for quality analysis prior to sequencing. The sample pool was prepared following Illumina guidelines. Samples were sequenced on the MiSeq sequencing platform in the Teagasc Sequencing facility, using a 2 × 300 cycle V3 kit, following standard Illumina sequencing protocols.
Bioinformatic analysis
The amplicon sequence data were processed in R (v4.2.0; R Core Team, 2022) using DADA2 (v1.30.0) as described by Callahan et al. (Reference Callahan, McMurdie, Rosen, Han, Johnson and Holmes2016), with minor modifications (Smith et al., Reference Smith, Enriquez-hidalgo, Hennessy, McCabe, Kenny, Kelly and Waters2020). Read quality was assessed to confirm average Q scores > 30. Low-quality reads and primer sequences were trimmed (trimLeft), identical reads were de-replicated, and forward and reverse reads were merged. An amplicon sequence variant (ASV) table was created, and chimeric sequences were removed. Taxonomic classification was assigned to the sequence variants using the SILVA (v.138) database downloaded from the DADA2 website. A phyloseq object was formed by integrating sample metadata, sample taxonomy and ASVs (v1.46.0; McMurdie and Holmes, Reference McMurdie and Holmes2013). ASVs were decontaminated using the ‘decontam’ R package (v1.16.0; Davis et al., Reference Davis, Proctor, Holmes, Relman and Callahan2018). Downstream analysis was performed in R using the packages ‘phyloseq’ (v1.38.0), ‘microbiome’ (v1.16.0) and ‘ggplot2’ (v3.3.2). To compute alpha diversity, the ‘iNEXT’ package was used, calculating indices for the first two Hill numbers: Chao1 and Shannon entropy (Hsieh et al., Reference Hsieh, Ma and Chao2016). The Wilcoxon test was performed to test whether the difference between any two groups or time points was significant. Principal component analysis was performed on centred log-ratio transformed (clr) values as a visual companion to the beta diversity analysis. Zeroes were imputed using the ‘const’ method (Lubbe et al., Reference Lubbe, Filzmoser and Templ2021). Beta diversity was computed in terms of Aitchison distance (Euclidean distance of clr-transformed counts) (Aitchison et al., Reference Aitchison, Barceló-vidal, Martín-fernández and Pawlowsky-glahn2000). Differences in beta diversity (between-sample diversity) were assessed using the adonis PERMANOVA function in the vegan library (v2.6.4), and the P-values were adjusted using the Bonferroni–Holm correction method. A difference was considered statistically significant if the adjusted P ≤ 0.05. Statistical analysis was also performed in R using the Wilcoxon test and Dunn test with the function ‘stat_compare_means’ and ‘stat_pwc’ from package ‘ggpubr’ (v0.4.0) and PERMANOVA using the pairwiseAdonis (v0.4) package. P-values were adjusted using the false discovery rate method in R unless specified otherwise. The analysis of composition of microbiomes with Brown-correction method was used to identify differentially abundant bacterial taxa (Lin and Peddada, Reference Lin and Peddada2020).
Statistical analysis
Statistical analyses were performed using GraphPad Prism software (v9.1.0), SAS 9.4 (SAS Institute Inc., Cary, USA) and in R (v4.1.2) with the RStudio GUI (v1.4.1717). Plotting was handled using ‘ggplot2’ (v3.4.1). Data were checked for normality in SAS using PROC UNIVARIATE and analysed by a linear mixed model, which allowed for repeated measurements using PROC MIXED.
Forage sample data were analysed using PROC MIXED in SAS. Week of the experiment was the repeated measure and was included as a random effect. The variables included in the model were treatment, week and the interaction between treatment and week. Forage data were analysed using the following statistical model:
 \begin{equation*}{Y_{ijk}} = \mu + {T_i} + {W_j} + {T_i} \times {W_j} + { \in _{ij}}\end{equation*}
where  ${Y_{ijk}}$ = dependent variable,
 $\mu $ = overall mean,
 ${T_i}$ = effect of treatment (i = LAB or CONT),
 ${W_j}$ = effect of week (j = 1–7), Ti × Wj
 $ = $ interaction between treatment and week and
 ${ \in _{ij}}$ = residual error.
Milk production (average daily milk yield, weekly milk fat and protein concentration, milk fat and protein yield and daily milk solids) and CH4 emission (yield, intensity and yield) were analysed using PROC MIXED in SAS. The individual cow was the experimental unit, and week of experiment was the repeated measure. Pre-experimental production (milk or CH4 emission), body weight and days in milk at the start of the experiment were used as covariates in the model. For both milk production and CH4 emission data, the statistical model used was:
 \begin{align*}
{Y_{ijklm}} = &\,\mu + {\text{ }}{B_l} + {P_m} + {W_j} + {\text{ }}{C_k} + {T_i} + {W_j} \nonumber\\
& + {F_j} \times {W_n} + {\text{ }}{X_{ijklm}} + {\text{ }}DI{M_{ijklm}} + {\text{ }}{ \in _{ijm}}
\end{align*}
where 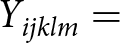 ${Y_{ijklm}} = {\text{ }}$is the response of the animal k of breed l, in parity m dependent variable,
 $\mu = $ overall mean,
 ${T_i} = $ effect of treatment (i = LAB or CONT),
 ${W_j} = $ week of experiment (j = 1–7),
 ${C_k} = $ cow within treatments (k = 1–15),
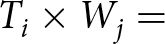 ${T_i} \times {W_j} = $ interaction between treatment and week, Xijklm, pre-experimental production (milk or methane); DIMijklm, days in milk at the start of the experiment; and
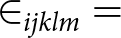 ${ \in _{ijklm}} = $ residual error.
All data were subjected to the Tukey–Kramer multiple range test for mean separation. All results reported are least-squares mean values with significant effect declared when P ≤ 0.05 and tendencies ranging from 0.05 ≤ P ≤ 0.10. Daily CH4 data were obtained from 24 cows over the duration of the experimental period. Methane data and DMI within each estimation period for individual cows were used to derive CH4 yield (g/kg DMI). Methane emissions were expressed per unit of milk solids to calculate CH4 intensity (g/kg MS). GE intake (GEI) was calculated by multiplying the energy content in each individual feed by the corresponding DMI value, which were then summed together to calculate the total GEI for each individual animal. Individual cow GEI was used to calculate the proportion of GEI converted to CH4 energy (Ym) (Eugène et al., Reference Eugène, Klumpp and Sauvant2021). This was calculated by multiplying each cow’s daily CH4 (kg/day) by CH4 energy content (55.65 MJ). The total megajoules (MJ) of CH4 energy emitted by the cow was then divided by the cow’s GEI, calculating the Ym conversion factor (%) (Liu et al., Reference Liu, Zhang, Xue, Zhu and Mao2016). Statistical difference between CONT and LAB groups was assessed using the Wilcoxon test for non-normally distributed data. Additionally, a spline-based statistical tool (R package ‘splinectomeR’) was employed to compare the two groups across the whole time series (Shields-Cutler et al., Reference Shields-Cutler, Al-ghalith, Yassour and Knights2018).
Results
Lactococcus lactis subsp. lactis SL242 and Lactiplantibacillus plantarum LP58 display methane inhibition in vitro
To identify LAB strains with potential to inhibit methanogen CH4 production, we first screened a biobank of bacterial strains from a variety of sources (MethLAB cultures). Emerging from this screen were two commercial bacteriocin-producing strains: Lpb. plantarum LP58 and L. lactis SL242, available from SACCO. Supplementation with CFS from LP58 and SL242 strains affected CH₄ production in Methanobrevibacter cultures, with varying levels of inhibition across species, as follows: Lpb. plantarum LP58 reduced methane production by 15% in M. boviskoreani JH1, 27% in M. gottschalkii HO, but had no effect on M. ruminantium M1. In contrast, L. lactis SL242 exhibited a stronger inhibition of 36% in M. boviskoreani JH1, while showing lower reductions of 8.3% in M. gottschalkii HO and 7.5% in M. ruminantium M1.
Lactococcus lactis subsp. lactis SL242 and Lactiplantibacillus plantarum LP58 achieve high titre in silage and dose rate in dairy cows
The study was conducted over a 7-week intervention period, during which animals were fed CONT (n = 15) or LAB (n = 15) silage. The silage used for the LAB group was prepared by inoculating forage with Lpb. plantarum LP58 and L. lactis SL242. The final CFU of the inoculant silage, on average, was calculated to be 1.8 × 10⁷ CFU/g for Lpb. plantarum LP58 and 8.6 × 10⁶ CFU/g for L. lactis SL242. Each cow consumed, on average, 55–62 kg of FW inoculated silage per day or ∼14 kg of DMI silage weight. Treatment cattle ingested approximately 4.2 × 10¹¹ CFU/g of Lpb. plantarum LP58 and 9.9 × 10¹¹ CFU/g of L. lactis SL242 per day, based on the average DMI consumption rates noted throughout the intervention period.
Chemical composition of silage
The chemical composition of the fed silage is reported in Table 1. The CONT treatment had significantly higher DM (P = 0.012) compared to LAB-treated silage. However, there was no significant effect (P = 0.614) of treatment on silage OMD concentration, which was 676.8 g/kg DM. Inoculated grass silage tended to have a higher CP (P = 0.067) and protein digestibility in the intestine in the absence of degradation in the rumen (PDIA) concentration compared to the untreated grass silage (P = 0.063) (Table 1).
Chemical composition of LAB and CONT treatmenta grass silage with the level of significance of treatmenta

Table 1 Long description
Chemical composition measures are listed for LAB and CONT, with columns for SEM and P value1 Treat. Organic matter digestibility was 675.9 grams per kilogram DM for LAB and 677.8 for CONT, SEM 2.60, P value1 Treat 0.614. Crude protein was 125.5 grams per kilogram DM for LAB and 120.0 for CONT, SEM 1.95, P value1 Treat 0.067. PDIA was 29.7 grams per kilogram DM for LAB and 28.7 for CONT, SEM 0.35, P value1 Treat 0.063. PDIE was 69.0 grams per kilogram DM for LAB and 68.4 for CONT, SEM 0.39, P value1 Treat 0.250. PDIN was 80.1 grams per kilogram DM for LAB and 76.5 for CONT, SEM 1.27, P value1 Treat 0.067. NDF was 423.0 grams per kilogram DM for LAB and 426.5 for CONT, SEM 4.61, P value1 Treat 0.596. Ammonia was 9.0 percent of total N for LAB and 6.1 for CONT, with SEM and P value1 Treat not shown. pH was 4.4 for LAB and 4.6 for CONT, with SEM and P value1 Treat not shown. GE was 19.8 Mj per kilogram DM for LAB and 20.2 for CONT, with SEM and P value1 Treat not shown.
a Treatments: LAB, lactic acid bacteria-inoculated grass silage; CONT, untreated silage.
Silage dry matter intake (SDMI), total dry matter intake (TDMI) in week 4 only and milk production, milk composition, body weight and body condition score (BCS) of dairy cattle within the LAB and CONT treatmenta with a level of significance for treatment, week and their interaction

Table 2 Long description
Measures for LAB and CONT include silage dry matter intake, total dry matter intake, gross energy intake, milk yield and composition, bodyweight, and body condition score, with SEM and P values for Treat, Week, and Treat x Week. SDMI was 12.8 kg for LAB and 12.3 kg for CONT, SEM 0.34, Treat P value 0.205, with Week and Treat x Week shown as hyphens. TDMI was 17.1 kg for LAB and 16.6 kg for CONT, SEM 0.35, Treat P value 0.213, with Week and Treat x Week shown as hyphens. GEI was 332.1 MJ for LAB and 326.3 MJ for CONT, SEM 6.97, Treat P value 0.484, with Week and Treat x Week shown as hyphens. Milk yield was 13.8 kg for LAB and 13.0 kg for CONT, SEM 0.77, Treat P value 0.458, Week P value 0.001, Treat x Week P value 0.273. FPCM yield was 16.5 kg for LAB and 15.0 kg for CONT, SEM 1.00, Treat P value 0.183, Week P value 0.001, Treat x Week P value 0.013. Milk fat percent was 5.5 for LAB and 5.4 for CONT, SEM 0.15, Treat P value 0.421, Week P value 0.001, Treat x Week P value 0.033, and milk fat kg was 0.7 for both, SEM 0.05, Treat P value 0.135, Week P value 0.001, Treat x Week P value 0.006. Milk protein percent was 4.2 for LAB and 4.3 for CONT, SEM 0.05, Treat P value 0.268, Week P value 0.001, Treat x Week P value 0.591, and milk protein kg was 0.6 for both, SEM 0.29, Treat P value 0.813, Week P value 0.001, Treat x Week P value 0.341. Lactose percent was 4.6 for LAB and 4.7 for CONT, SEM 0.71, Treat P value 0.907, Week P value 0.031, Treat x Week P value 0.012, and lactose kg was 0.6 for both, SEM 0.04, Treat P value 0.749, Week P value 0.001, Treat x Week P value 0.377. Milk solids kg was 1.3 for LAB and 1.2 for CONT, SEM 0.08, Treat P value 0.266, Week P value 0.001, Treat x Week P value 0.016. Bodyweight was 577.1 kg per cow for LAB and 583.5 for CONT, SEM 9.26, Treat P value 0.479, Week P value 0.001, Treat x Week P value 0.001, and BCS on a scale 1 to 5 was 3.1 for LAB and 3.2 for CONT, SEM 0.07, Treat P value 0.200, Week P value 0.001, Treat x Week P value 0.274.
a Treatments: LAB, lactic acid bacteria-inoculated grass silage; CONT, untreated silage.
b SDMI and TDMI were only measured on week 4 of the experimental period and as such have no week effect included in the results.
c Fat- and protein-correct milk (FPCM) yield calculated using the following equation: FPCM (kg/day) = Production (kg/day) × (0.1226 × Fat % + 0.0776 × True Protein % + 0.2534) (IDF 2015).
d P-value for treatment (Treat), weeks (Week) and treatment by week interaction (Treat × Week).
DMI, body weight and BCS, milk yield and milk composition
Silage DMI (SDMI) and total DMI (TDMI) are reported in Table 2. There was no effect of treatment (P > 0.05) on SDMI (12.6 ± 0.34 kg DM/cow/day) or TDMI (16.9 ± 0.35 kg DM/cow/day). Treatment had no significant (P > 0.05) effect on daily milk yield (LAB: 13.7 kg, CONT: 13.2 ± 0.772 kg, respectively). Week had a significant effect on milk production for all expressed units, body weight and BCS (P < 0.001) (Table 2). There was a significant (P < 0.05) treatment by week interaction for fat- and protein-corrected milk (FPCM) yield, and the LAB treatment had greater FPCM yield in weeks 4 and 5 compared to the CONT treatment. There was a significant treatment by week interaction (P < 0.05) on milk fat concentration, and the LAB treatment had greater milk fat concentration in week 5 compared to the CONT treatment (LAB: 0.70 kg, CONT: 0.58 ± 0.042 kg, respectively). There was a significant treatment by week interaction on daily milk solids production (P < 0.05), with the LAB treatment having greater milk solid production in weeks 4 and 5, compared to CONT treatment (Table 2). There was no effect of treatment on body weight; however, a significant (P < 0.001) treatment by week interaction was evident.
Rumen microbiota diversity
Sequencing of rumen fluid samples from the canulated animals yielded a total of 2,900,399 reads, with a mean read length of 270 bp (range: 251–301 bp). On average, each sample contained 42,653 reads (±32,228 standard deviation). Following quality control, the average read count per sample was 39,979 (ranging from 12,014 to 84,178). Two samples were excluded due to read depth anomalies: RF4-C6, which had a read depth of 189, and RF3-C4, which had a read depth exceeding 200,000 reads. After abundance and variance filtering, a total of 3,215 ASVs were identified. Both Shannon and Chao1 diversity indices did not show variation between time points within the treatment groups (Figure 1). Concerning individual time points, no significant differences were observed between the two groups. The beta diversity of rumen microbiota between CONT and LAB groups did not demonstrate distinct clustering at week 1 (P = 0.695), but significant clustering was observed at week 4 (P = 0.045) and week 7 (P = 0.042) (Figure 1). Overall, the treatment had no significant effect on beta diversity (P = 0.057), and changes over time were more prominent. Samples from different weeks showed some dispersion along PCoA 1, suggesting temporal shifts in microbial composition. CONT and LAB groups largely overlapped at each time point, indicating that the treatment did not drive significant differences in community structure (Figure 1).
(A) Alpha diversity measured by the Shannon index at each time point (week 1, week 4, week 7) comparing the control and treatment groups. (B) Alpha diversity measured by the Shannon index for each group (control and treatment) across the three time points (week 1, week 4, week 7). (C) Principal coordinate analysis (PCoA) plots based on Bray–Curtis distances for each time point, showing distinct clustering between control and treatment groups: (a) week 1, (b) week 4, (c) week 7. Ellipses represent 95% confidence intervals around treatment groups. (D) Overall PCoA plots for all groups throughout time based on Bray–Curtis distances: (a) clustering by time points (week 1, week 4, week 7) across both groups; (b) clustering by treatment groups with symbols indicating different time points.

Figure 1 Long description
Multiple graphs labeled A, B, C and D. Graph A features box plots showing Shannon diversity at each time point (Week 1, Week 4, Week 7) for control and treatment groups. The horizontal axis is labeled ′Group′ and the vertical axis is labeled ′Shannon′. Treatment groups are differentiated by color, with control in one color and treatment in another. Week 1 shows similar diversity between groups, while Week 4 and Week 7 display higher diversity in the treatment group. Graph B presents box plots of Shannon diversity for each group across the three time points. The horizontal axis is labeled ′Time (Weeks)′ and the vertical axis is labeled ′Shannon′. Diversity increases over time in the treatment group, peaking at Week 7. Graph C contains three PCoA plots based on Bray-Curtis distances for each time point: (a) Week 1, (b) Week 4, (c) Week 7. The horizontal axis is labeled ′PCoA 1′ and the vertical axis is labeled ′PCoA 2′. Points are plotted to show clustering between control and treatment groups, with ellipses representing 95 percent confidence intervals. Week 1 shows overlapping clusters, while Week 4 and Week 7 display more distinct separation. Graph D includes two PCoA plots for all groups throughout time: (a) clustering by time points (Week 1, Week 4, Week 7) across both groups and (b) clustering by treatment groups with symbols indicating different time points. The horizontal axis is labeled ′PCoA 1′ and the vertical axis is labeled ′PCoA 2′. Symbols and colors differentiate time points and treatment groups, with specific shapes for each week and colors for each group. The plots show temporal shifts and treatment effects, with Week 7 showing the most distinct clustering between groups.
Rumen microbiome taxonomic composition
The relative abundance of the microbial composition of the ruminal microbiome was similar for both groups at all the time points (Figure 2). A total of 16 phyla were identified within the ruminal microbiota (Figure 2). The relative abundances of Bacteroidota (47.1% in CONT and 49.4% in the LAB treatment group) and Firmicutes (39.0% in CONT and 35.5% in the LAB group) dominated the phylum dataset within each group. Euryarchaeota, which are archaeal in nature, accounted for 2.29% in the CONT and 4.19% in the LAB group. A significant difference was observed in the relative abundance of Firmicutes (P = 0.013) between the CONT and LAB groups. A total of 67 families were identified within the ruminal microbiota (Figure 3B). The top three families across all time points and treatments were Prevotellaceae, Lachnospiraceae and Rikenellaceae. Prevotellaceae was the most abundant, with relative abundances of 28.5% in the CONT and 31.7% in the LAB group. Lachnospiraceae had a relative abundance of 14.1% in the CONT and 12.3% in the LAB group, while Rikenellaceae had similar relative abundances in both groups (9.22% in CONT and 9.48% in LAB). Statistical analysis indicated a significant difference in the relative abundances of Lachnospiraceae (P = 0.027) and Muribaculaceae (P = 0.037) between the CONT and LAB groups. Christensenellaceae also showed a significant difference in relative abundance (P = 0.022). At the genus level, a total of 147 genera were identified within the ruminal microbiota. The top 10 genera found in rumen samples from each group over all time points included Candidatus Saccharimonas, Christensenellaceae R-7 group, Lachnospiraceae AC2044 group, Lachnospiraceae XPB1014 group, Methanobrevibacter, NK4A214 group, Prevotella, Prevotellaceae UCG-001, Rikenellaceae RC9 gut group and Succiniclasticum (Figure 2). The top three genera across all time points and treatments were Prevotella, Rikenellaceae RC9 gut group and NK4A214 group. Prevotella was most abundant, averaging 28.9% in the CONT and 32.5% in the LAB. Rikenellaceae RC9 gut group averaged 10.6% in both groups, while NK4A214 group had relative abundances of 7.37% in the CONT and 6.28% in the LAB group. Significant differences were observed in the relative abundances of Prevotella (P = 0.019) and Christensenellaceae R-7 group (P = 0.019) between the CONT and LAB groups. Lachnospiraceae AC2044 group also showed a significant difference in relative abundance (P = 0.005). Differential abundance analysis highlighted that Faecalibaculum and Oscillospira had higher W-statistics in the CONT group, while Lachnospiraceae UCG-010 showed higher abundance in the LAB group (Figure 2).
Taxonomic composition and differential abundance of the rumen microbiota in dairy cows fed either LAB-treated (Treatment) or untreated (Control) silage across weeks 1, 4 and 7. (A) Phylum-level distribution: Stacked bar plots showing relative abundance of bacterial phyla over time. (B) Family-level distribution: Stacked bar plots of the top 10 bacterial families across weeks. (C) Genus-level distribution: Stacked bar plots of the top 10 bacterial genera for each group and week. (D) Differential abundance of genera: Bar plot showing genera significantly different between Treatment and Control groups, with colours indicating higher abundance in either group.

Figure 2. Long description
Phylum-level distribution per group. Text at top reads Phylum-level distribution per group. Two grouped plots are labeled Treatment and Control. The vertical axis label is Relative abundance, with tick labels 0.00, 0.25, 0.50, 0.75, 1.00. The horizontal axis label is Time (weeks). The x-axis categories are Week 1, Week 4, Week 7 for Treatment and Week 1, Week 4, Week 7 for Control. A legend titled Phylum lists Bacteroidota, Firmicutes, Euryarchaeota, Proteobacteria, Spirochaetota, Chloroflexi, Elusimicrobiota, Planctomycetota, Verrucomicrobiota, Actinobacteriota, Desulfobacterota, Thermoplasmatota, Patescibacteria, Synergistota, Elusimicrobiota, Campylobacterota. Each week is shown as one stacked bar reaching 1.00 on the vertical axis. The largest stacked sections in each bar are Bacteroidota and Firmicutes, with smaller stacked sections for the remaining phyla. Top 10 Family-level distribution per group. Text at top reads Top 10 Family-level distribution per group. Two grouped plots are labeled Control and Treatment. The vertical axis label is Relative abundance, with tick labels 0.00, 0.25, 0.50, 0.75, 1.00. The horizontal axis label is Time (weeks). The x-axis categories are Week 1, Week 4, Week 7 for Control and Week 1, Week 4, Week 7 for Treatment. A legend titled Family lists Prevotellaceae, Lachnospiraceae, Rikenellaceae, Oscillospiraceae, Acidaminococcaceae, Muribaculaceae, F082, Saccharimonadaceae, Methanobacteriaceae, Christensenellaceae, Other. Each week is shown as one stacked bar reaching 1.00 on the vertical axis. The largest stacked sections in each bar are Prevotellaceae and Other, with multiple smaller stacked sections for the remaining families.
Boxplots showing the relative abundance of three archaeal genera in the rumen of dairy cows across three different time points (week 1, week 4 and week 7). Label (A) displays the relative abundance of Methanobrevibacter, the dominant archaeal genus. Each boxplot compares the ‘Control’ group (red) and the ‘Treatment’ group (blue) for weeks 1, 4 and 7. Label (B) shows the relative abundance of Candidatus Methanomethylophilus. The abundance is much lower than Methanobrevibacter. Boxplots are shown for both ‘Control’ (red) and ‘Treatment’ (blue) groups across weeks 1, 4 and 7. Label (C) depicts the relative abundance of Methanosphaera, another archaeal genus present in lower abundance. Comparisons between the ‘Control’ group (red) and the ‘Treatment’ group (blue) are shown for each of the time points.

Archaeal community
For the archaeal community analysis, three genera were identified: Methanobrevibacter, Candidatus Methanomethylophilus and Methanosphaera. Methanobrevibacter accounted for the majority of the archaeal community in both the LAB (95.5%) and CONT groups (94.9%) (Figure 3). In contrast, Candidatus Methanomethylophilus and Methanosphaera were present at much lower relative abundances, accounting for 2.93% and 1.53%, respectively, in the LAB group, and 3.79% and 1.32%, respectively, in the CONT group. Wilcoxon tests were conducted to assess the differential abundance between the LAB and CONT groups for each genus, showing no significant differences: Methanobrevibacter (P = 0.61), Candidatus Methanomethylophilus (P = 0.87) and Methanosphaera (P = 0.89) (Figure 3). These findings suggest that the LAB treatment did not significantly affect the composition of the archaeal community in the rumen.
Methane measurements
Daily CH₄ measurements were collected from 24 (non-cannulated) cows throughout the experimental period. Methane data from the rumen-cannulated cows were not included in the analysis. The detailed data for individual animals, including treatment group, body weight, condition scores and other relevant variables, are provided in Supplementary Table S1. This supplementary table allows for a comprehensive overview of the study data used for statistical analyses and interpretation. There was no significant effect of treatment on daily CH₄ emissions (LAB: 373 g/day, CONT: 379 ± 6.6 g/day, respectively). Significant differences were observed only in weeks 5 (P < 0.01) and 7 (P < 0.05) (Figure 4). A comparison of CH4 emissions between week 7 and week 1 revealed a significant reduction for the LAB group (adjusted P = 0.0384, Wilcoxon test), but not for the CONT group (Figure 4). A spline-based statistical analysis identified significant differences starting just before week 5 (P < 0.05, Figure 4). From week 5 to week 7, methane emissions decreased by an average of 5.7% in the treatment group (Figure 4). The greatest reduction in CH₄ emissions was observed in week 5, where LAB-treated cows showed a 7.7% decrease. Over the full trial period, CH₄ emissions in the LAB group declined by 7.7% from week 1 to week 7 (Figure 4). While CH₄ production in the CONT group also varied, particularly in weeks 1 and 3, these early weeks were considered training periods. Overall, no significant week-by-treatment interaction was detected, although reductions in methane emissions were most notable in week 5. Daily enteric CH₄ emissions were not affected by treatment (LAB: 373 g/day, CONT: 379 ± 6.6 g/day, respectively) (Table 3). There was no effect of treatment on CH₄ emission intensity (g/kg milk solids); however, a significant treatment by week interaction (P < 0.05) was evident, with the LAB treatment having lower CH₄ emission intensity in week 5 compared to the CONT treatment. Methane per kilogram of body weight was not affected by treatment; however, a significant treatment by week interaction (P < 0.05) was evident with both treatments, with CH₄ per kilogram of body weight alternating from week to week due to significant weekly body weight alterations. There was no significant effect of treatment on either CH₄ emission yield (g/kg DMI) or GEI loss to CH₄.
Methane production trends and treatment effects in LAB and Control groups over time. (A) Boxplots of daily methane production (g/day) in LAB and Control groups across weeks 1–7. Statistical comparisons between groups for each week were conducted using the Wilcoxon test. Significance between groups is indicated by * for P < 0.05, ** for P < 0.01 and ns for non-significant comparisons (P > 0.05). (B) Pairwise comparison of methane production (g/day) at week 1 and week 7 within each treatment group. Statistical significance is denoted as described above. (C) Spline-based analysis of methane production differences over the experimental period. The P-value trend is shown, with dashed lines indicating significance thresholds at P = 0.05 (black) and P = 0.01 (red). (D) Percentage decrease in methane production for the control and treatment cattle at each week (blue = treatment cattle, red = control cattle).

Figure 4 Long description
Boxplots of daily methane production in grams per day for LAB and Control groups across Weeks 1 to 7. The horizontal axis is labeled Weeks and the vertical axis is labeled Methane production grams per day. The Control and LAB groups show similar values across weeks, with significance indicated by ns for non-significant. Panel B displays pairwise boxplots comparing methane production at Week 1 and Week 7 for each group. The Control group shows no significant change, while the LAB group shows a significant decrease from Week 1 to Week 7, marked by an asterisk. Panel C presents a line graph of the P value of difference over weeks, with dashed lines indicating significance thresholds at 0.05 and 0.01. The P values drop below 0.05 after Week 5, indicating significant differences. Panel D is a bar graph showing the percentage decrease in methane production from baseline Week 1 for both groups. The LAB group shows a mostly negative trend after baseline, with the largest decrease in Week 5. The graphs collectively illustrate the treatment effects over time, highlighting significant reductions in methane production for the LAB group.
Methane (CH4) emissions, methane emissions intensity and methane yield of dairy cattle within LAB and CONT treatmentsa, with a level of significance for treatment, week and their relative interaction

Table 3 Long description
Methane emissions are reported for two treatments, LAB and CONT, with SEM and p values for Treat, Week, and Treat x Week. For CH4 in grams per day, LAB is 373.4 and CONT is 379.2, SEM 6.57, with p values 0.492 for Treat, 0.001 for Week, and 0.106 for Treat x Week. For CH4 in grams per kilogram milk solids, LAB is 322.7 and CONT is 335.1, SEM 26.00, with p values 0.681 for Treat, 0.001 for Week, and 0.011 for Treat x Week. For CH4 in grams per kilogram of bodyweight, both LAB and CONT are 0.7, SEM 0.02, with p values 0.994 for Treat, 0.018 for Week, and 0.003 for Treat x Week. For CH4 in grams per kilogram of TDMI, LAB is 22.9 and CONT is 23.2, SEM 0.44, with p value 0.543 for Treat and no Week or Treat x Week values shown. For CH4 as percent of GEI, LAB is 6.5 and CONT is 6.6, SEM 0.13, with p value 0.910 for Treat and no Week or Treat x Week values shown.
a Treatments: LAB, lactic acid bacteria-inoculated grass silage; CONT, untreated silage.
b P-value for treatment (Treat), weeks (Week) and treatment by week interaction (Treat × Week).
c TDMI was only measured on week 4 of the experimental period and as such has no week effect included in the results.
d Gross energy intake (GEI).
Discussion
This study evaluated the effect of LAB supplementation on CH4 emissions in Holstein Friesian late-lactation spring calving dairy cows through ingestion of LAB-inoculated silage. The inoculant strains Lpb. plantarum LP58 and L. lactis SL242 were selected based on their strong anti-methanogenic properties identified in vitro and their commercial availability. Both species have been granted European Food Safety Authority (EFSA) approval for use as feed additives or silage inoculants, supporting their suitability for ruminant applications. L. lactis SL242 produces the bacteriocin nisin A (Malvisi et al., Reference Malvisi, Stuknytė, Magro, Minozzi, Giardini, De Noni and Piccinini2016). Lpb. plantarum LP58 is predicted to produce plantaricin N (Doyle, Reference Doyle2023; Mbandlwa, Reference Mbandlwa2022). Purified nisin has been reported to exert strong inhibitory effects against methanogens (Z Li et al., Reference Li, Wang, Usman, Khan, Zhang, Li, Bai, Chen, Zhang and Guo2023c; Shen et al., Reference Shen, Liu, Yu and Zhu2017). The inhibitory activity of the LP58 and SL242 strains was species-dependent, with SL242 showing stronger and more consistent inhibition across Methanobrevibacter isolates. This highlights the need to test a broader panel of methanogens, including methylotrophic taxa such as Methanosphaera and Methanomassiliicoccales, which are abundant in the rumen (Palevich et al., Reference Palevich, Jeyanathan, Reilly, Palevich, Maclean, Li, Altermann, Kelly, Leahy, Attwood, Ronimus, Henderson and Janssen2024; Waters et al., Reference Waters, Roskam, Smith, Kenny, Popova, Eugène and Morgavi2025; Xie et al., Reference Xie, Zhao, Zhan, Zhou, Li, Zhu, Pope, Attwood, Jin and Mao2024), but rarely cultured. Although this study assessed methane production rather than direct methanogen growth, future work should incorporate high-throughput screening approaches to detect methanogen inhibition, such as those recently developed by Li et al. (Reference Li, Crouzet, Kelly, Reid, Leahy and Attwood2023a).
The primary goal of ensiling is to preserve forage through controlled fermentation, yielding high nutritional and microbiological quality while minimising losses (Ávila and Carvalho, Reference Ávila and Carvalho2020). LAB are widely applied as sustainable tools to improve silage preservation. The strains used in this study differ in their fermentative pathways: L. lactis SL242 is homofermentative, producing lactic acid as the dominant end-product, whereas Lpb. plantarum LP58 is heterofermentative, generating lactic acid, acetic acid, alcohols and CO₂. Co-inoculation with multiple LAB species may be advantageous, as complementary growth dynamics and metabolic outputs can enhance silage fermentation quality (Ávila and Carvalho, Reference Ávila and Carvalho2020; Puntillo et al., Reference Puntillo, Gaggiotti, Oteiza, Binetti, Massera and Vinderola2020).
Silage quality is a critical determinant of animal performance, influencing feed costs and overall profitability (Borreani et al., Reference Borreani, Tabacco, Schmidt, Holmes and REa2018; Muck et al., Reference Muck, Nadeau, McAllister, Contreras-govea, Santos and Kung2018). However, the inclusion of grass silage in late-lactation diets typically reduces DMI and milk yield compared with grazed grass (Reid et al., Reference Reid, O'Donovan, Murphy, Fleming, Kennedy and Lewis2015). In this study, feeding LAB-inoculated silage did not improve animal performance, consistent with reports that responses vary depending on inoculant strain and forage type (Bernardi et al., Reference Bernardi, Härter, Silva, Reis and Rabelo2019; Carvalho et al., Reference Carvalho, Sales, Schwan and Ávila2021). Silage digestibility is a key driver of intake (Warner et al., Reference Warner, Bannink, Hatew, Laar and Dijkstra2017), and the absence of differences in measured DMI on week 4 of the study here aligns with the lack of improvement in OMD.
Previous studies have demonstrated increased DMI when LAB inoculants improved OMD and NDF digestibility (Monteiro et al., Reference Monteiro, Paula, Muck, Broderick and Faciola2021; Pang et al., Reference Pang, Yan and Krizsan2021; Warner et al., Reference Warner, Bannink, Hatew, Laar and Dijkstra2017). However, no such effects were observed during the week 4 DMI measurement period in the present study. Moreover, the lack of an overall improvement in animal performance suggests that any increase in DMI, if present, was likely minimal and insufficient to influence production responses over the experimental period. Previous studies have reported increased DMI when LAB inoculants improved OMD and NDF digestibility. When baseline silage quality is already high, the additional benefits of inoculation may be limited. Future work should evaluate the survival and activity of inoculated LAB post-ingestion, for example, by tracking strain-specific markers using qPCR and shotgun metagenomics. Direct-fed LAB supplementation should also be compared with silage inoculation to determine whether bypassing ensiling improves LAB survival and functional activity in the rumen.
The rumen harbours a diverse and complex microbial community that enables ruminants to access nutrients otherwise unavailable to the host (Qi et al., Reference Qi, Xue, Jia, Zhang, Yan and Sun2024). The current study reported that the relative abundance of the microbial composition in the rumen of the parallel canulated animals was similar for both the CONT and LAB-treated groups across all time points, with Bacteroidota and Firmicutes dominating the microbiota. Notably, Firmicutes was significantly more abundant in the CONT group compared to the LAB-treated group (P = 0.013). This difference could suggest a potential shift in the microbial ecosystem due to the LAB treatment, which may influence fibre digestion and nutrient absorption, given Firmicutes’ known role in polysaccharide breakdown (Flint et al., Reference Flint, Scott, Duncan, Louis and Forano2012). The observed increase in Euryarchaeota abundance in the LAB group (4.19%) compared to the CONT group (2.29%) aligns with the potential impact of probiotics on archaeal communities. The implications for methane production and fermentation efficiency require further investigation, as the relationship between Euryarchaeota and rumen methanogenesis is complex (Hook et al., Reference Hook, Wright and McBride2010). At the family level, significant differences were observed between the groups in the relative abundances of Lachnospiraceae (P = 0.027), Muribaculaceae (P = 0.037) and Christensenellaceae (P = 0.022). These families are known for their roles in carbohydrate metabolism and short-chain fatty acid production, indicating that LAB treatment may modulate these processes (Gharechahi et al., Reference Gharechahi, Vahidi, Bahram, Han, Ding and Salekdeh2021). The increased abundance of Prevotellaceae in the LAB group suggests enhanced fibre and protein breakdown, as this family is associated with propionate production, a key rumen fermentation product linked to improved feed efficiency and reduced methane emissions (Liu et al., Reference Liu, Zhang, Xue, Zhu and Mao2016), although this was not significant in the current study. At the genus level, Prevotella was significantly more abundant in the LAB-treated group (P = 0.019). The role of Prevotella in propionate production via succinate and acrylate pathways might be a contributing factor to the observed marginal increase in propionate in the treatment group (Betancur-Murillo et al., Reference Betancur-Murillo, Aguilar-marín and Jovel2022). The relative abundances of Lachnospiraceae AC2044 group and Christensenellaceae R-7 group also showed significant differences, suggesting potential shifts in metabolic activity within the rumen microbiome (Ribeiro et al., Reference Ribeiro, Oss, He, Gruninger, Elekwachi, Forster, Yang, Beauchemin and McAllister2017). Differential abundance analysis highlighted the higher presence of Faecalibaculum and Oscillospira in the CONT group, while Lachnospiraceae UCG-010 was more prevalent in the LAB-treated group. This shift could indicate that the LAB treatment selectively enhances certain bacterial populations that may be more efficient in fibre degradation or compete more effectively for substrates in the rumen (Zhang et al., Reference Zhang, Shi, Wang, Li, Cao, Ji, He and Zhang2017).
While the overall microbial community structure remained relatively stable, the LAB treatment induced significant changes in specific taxa, suggesting that such modifications may have implications for rumen fermentation, nutrient utilisation and potentially methane mitigation. Further research is warranted to clarify the functional consequences of these microbial shifts.
The order Methanobacteriales, which includes the family Methanobacteriaceae, is considered the most prevalent group of methanogens in the ruminal environment (Bonin and Boone, Reference Bonin and Boone2006). Within this family are the genera Methanobrevibacter, Methanobacterium and Methanosphaera. In the current data set, the archaeal community was dominated by Methanobrevibacter, accounting for 95.5% of the archaeal community in the LAB treatment group and 94.9% in the CONT group. This is consistent with previous findings identifying Methanobrevibacter as a dominant hydrogenotrophic methanogen in the rumen (Danielsson et al., Reference Danielsson, Dicksved, Sun, Gonda, Müller, Schnürer and Bertilsson2017). The high relative abundance of Methanobrevibacter suggests its central role in reducing CO2 with H2 to produce CH4, a process integral to enteric methanogenesis. The lower relative abundances of Candidatus Methanomethylophilus and Methanosphaera (2.93% and 1.53% in the LAB group, respectively; 3.79% and 1.32% in the CONT group) indicate that while these genera are present in the rumen, they play a lesser role in CH4 production. The methylotrophic nature of Methanosphaera also highlights its unique niche in utilising methyl compounds for CH4 production. Methane mitigation strategies often target the reduction of specific methanogenic groups. However, as Hook et al. (Reference Hook, Wright and McBride2010) emphasised, the resilience of methanogens and the functional redundancy within the rumen microbial community pose challenges in achieving significant shifts through treatments such as probiotics (Hook et al., Reference Hook, Wright and McBride2010). In this study, while LAB treatment influenced some bacterial taxa, its effect on methanogen populations remained limited. These results suggest that achieving meaningful reductions in enteric CH4 production requires a multifaceted approach, potentially incorporating both microbiome modulation and dietary interventions.
Late lactation is a period of declining animal productivity with reductions in pasture quality (McKay et al., Reference McKay, Lynch, Mulligan, Rajauria, Miller and Pierce2019) and greater enteric CH4 emissions due to alterations in animal DMI and rumen microbial community (Lyons et al., Reference Lyons, Bielak, Doyle and Kuhla2018). Inoculating feed and forages with LAB to reduce enteric CH4 emissions has had little to no success in vivo (Cao et al., Reference Cao, Takahashi, K-i, Yoshida and Cai2010; Ellis et al., Reference Ellis, Hindrichsen, Klop, Kinley, Milora, Bannink and Dijkstra2016). Enteric CH4 emissions, regardless of the expressed unit, were not significantly reduced by feeding LAB-inoculated silage in the current study. Enhancing forage digestibility is reported to increase animal DMI, which often results in greater levels of emitted daily CH4 (van Gastelen et al., Reference van Gastelen, Dijkstra and Bannink2019), due to the well-known positive correlation between animal DMI and CH4 emissions (R 2 = 0.82) (Hristov et al., Reference Hristov, Oh, Giallongo, Frederick, Weeks, Zimmerman, Harper, Hristova, Zimmerman and Branco2015). Inoculated grass silage OMD was not improved in the current study, which resulted in no effect on daily CH4 (g/day), CH4 yield (g/kg TDMI) or CH4 emission intensity (g/kg milk solids). Improving digestibility of grass silage is reported to elevate animal DMI, resulting in reductions in both CH4 yield and GEI loss to CH4 (Pang et al., Reference Pang, Yan and Krizsan2021; Warner et al., Reference Warner, Bannink, Hatew, Laar and Dijkstra2017), which was not the case in the current study. Overall CH4 reduction was observed in treatment cattle at a total of 5.7%. Week 5 showed the greatest reduction in CH4 emissions, with a 7.74% reduction. When comparing CONT and LAB animals, the CONT animals produced an additional 20 g of CH4 per day compared to the LAB treatment group. This was a within-week difference; however, over the full period, no CH4 effect was detected. Similar to effects on animal performance, both dosage rate and bacterial species used can dictate LAB capacity to reduce enteric CH4 in vivo (Doyle et al., Reference Doyle, Mbandlwa, Kelly, Attwood, Li, Ross, Stanton and Leahy2019; Ellis et al., Reference Ellis, Hindrichsen, Klop, Kinley, Milora, Bannink and Dijkstra2016; Jeyanathan et al., Reference Jeyanathan, Martin, Eugène, Ferlay, Popova and Morgavi2019; Philippeau et al., Reference Philippeau, Lettat, Martin, Silberberg, Morgavi, Ferlay, Berger and Nozière2017). Similar to the current study, Ellis et al. (Reference Ellis, Hindrichsen, Klop, Kinley, Milora, Bannink and Dijkstra2016) reported that feeding dairy cattle LAB-inoculated grass silage had no effect on CH4 emissions due to treatments having similar silage digestibility and milk production, similar to the current study and overall animal DMI. Other in vivo experiments such as those by Philippeau et al. (Reference Philippeau, Lettat, Martin, Silberberg, Morgavi, Ferlay, Berger and Nozière2017) and Jeyanathan et al. (Reference Jeyanathan, Martin, Eugène, Ferlay, Popova and Morgavi2019) reported no treatment differences in daily CH4 emissions when feeding three contrasting DFMs daily to cows on a high or low starch diet, which could be attributed to the propionate levels already being elevated, reducing the effect of DFMs on rumen fermentation in the high starch diet treatment (Jeyanathan et al., Reference Jeyanathan, Martin, Eugène, Ferlay, Popova and Morgavi2019; Vyas et al., Reference Vyas, McGeough, Mohammed, McGinn, McAllister and Beauchemin2014).
Conclusion
The use of LAB-inoculated silage in late-lactation, spring-calving Holstein Friesian cows did not result in a statistically significant overall reduction in enteric CH₄ emissions, providing further evidence for the limited efficacy of LAB supplementation as a standalone methane mitigation strategy. The response observed was transient and complex in nature, with a temporary reduction in CH₄ production peaking at 7.74% in week 5 (P < 0.01) but not sustained over the full intervention period. This pattern is consistent with previous observations of variable and time-dependent effects of silage inoculants on animal performance and metabolism and underscores the difficulty of achieving durable methanogenesis inhibition through microbial inoculants alone. While LAB inoculation did not significantly alter animal performance metrics, it did induce shifts in the rumen microbial community, particularly in bacterial and archaeal populations. Notably, changes in Firmicutes, Prevotellaceae and Lachnospiraceae suggest potential metabolic adaptations that warrant further investigation. Given the functional redundancy of methanogens and the resilience of CH₄-producing pathways in the rumen, future studies should explore whether targeted microbial interventions, such as bacteriocin-producing LAB, can be optimised to enhance their inhibitory effects on methanogenesis. Bacteriocin-producing LAB remain a promising strategy given that they are naturally occurring, EFSA-approved, already used in silage fermentation, and align with consumer preferences for non-chemical interventions. LAB can also be incorporated into both TMR and pasture-based diets, addressing one of the main barriers to 3-NOP adoption. Future research should focus on integrating LAB with complementary strategies, such as dietary interventions, slow-release additives or microbiome-targeted approaches, to develop scalable and sustainable solutions for reducing methane emissions in ruminant livestock.
Supplementary material
The supplementary material for this article can be found at https://doi.org/10.1017/S0022029926102702.
Acknowledgements
The authors thank the staff of Moorepark Research Farm (Animal & Grassland Research and Innovation Centre, Teagasc Moorepark, Ireland) for their care, assistance and support of the experimental cows and procedures.
Author contributions
N.D., M.K. and P.M. have contributed equally to this work.
Declaration of interest
None declared.
Data availability statement
All 16S rRNA gene sequencing data have been deposited into the NCBI Sequence Read Archive, BioProject ID SUB15686766. Other data will be made available on request.
Ethics and approvals
Ethical approval for this trial was obtained through the Teagasc Animal Ethics Committee, under project 0267 – ‘Refining direct fed microbials (DFM) and silage inoculants for the reduction of methane emissions from ruminants’. The handling and care of the animals followed an experimental protocol approved by the Teagasc Animal Ethics Committee (TAEC) and was conducted using procedures consistent with the experimental license (AE19132/ P052) issued by the Irish Health Products Regulatory Authority in accordance with European Union legislation (Directive 2010/63/EU), for the protection of animals used for scientific purposes.
Funding statement
The authors acknowledge financial support of the METHLAB project. METHLAB, refining DFMs and silage inoculants for reduction of methane emissions from ruminants, has been funded by FACCE ERA–GAS, an EU ERA–NET Cofund programme, whereby national money is pooled to fund transnational projects, and the European Commission also provides co-funding for the action. FACCE ERA–GAS is the ERA–NET Cofund for Monitoring and Mitigation of Greenhouse Gases from Agri- and Silvi-culture and comprises funding agencies and project partners from 19 organisations across 13 European countries. Teagasc, the Agriculture and Food Development Authority in Ireland, is the overall coordinator of the ERA–NET. METHLAB was one of the 10 successful projects to be funded from 79 proposals from across Europe, the United States and New Zealand. The New Zealand contribution to the METHLAB project is funded by the New Zealand Government in support of the objectives of the Livestock Research Group of the Global Research Alliance on Agricultural Greenhouse Gases. Funding from RUMINING funded by DAFM and SFI for APC Microbiome Ireland is also gratefully acknowledged.


 Open access

