

1. Introduction
Economic prosperity is a complex function of an economy's natural resources, technology, human and physical capital, culture and geography. But, most importantly, prosperity is a function of an economy's institutions and policies, which determine the incentive structure under which resources are employed and investment decisions are made.Footnote 1 Good institutions are those that incentivize individuals and firms to engage in economic decisions that increase long-run growth. Furthermore, because desirable economic outcomes often occur where institutions are compatible with the principles of economic freedom, institutional quality and economic freedom are synonymous.Footnote 2
For decades, scholars have studied the relation between institutions and economic outcomes using institutional indexes, such as the Economic Freedom of the World (EFW) index and the International Country Risk Guide (ICRG) index.Footnote 3 These indexes quantify institutional quality for more than 100 countries around the world and are employed in hundreds of peer-reviewed publications. Decades of research have shown a positive relation between economic freedom and income per person, literacy rates, life expectancy and even Olympic gold medals. Moreover, scholars have found the impact of institutions on economic outcomes to be robust to institutions and policies under local government control.Footnote 4 However, very little research has investigated changes in economic freedom over time.Footnote 5 In other words, we know that economic freedom is highly correlated with desirable economic outcomes both internationally and locally, but we know little about the transition from low levels of economic freedom to high levels of economic freedom.
The lack of empirical research examining the evolution of institutions and freedom is not exclusive to the local economics literature. A similar lack exists internationally, where the study of reform is often reserved to specific circumstances, such as the liberalization of the former Soviet states. An exception to this is the work of Sobel (Reference Sobel2017), which measures the dynamic properties of institutional change at the international level. Sobel finds increasing economic freedom internationally, driven primarily by increasing freedom to trade. Moreover, his results indicate that the process of institutional improvement is a gradual process unlike that of institutional decline, which occurs sharply. The study of the properties of reform not only explains the trends in economic freedom over time but also yields principles of reform that apply broadly.
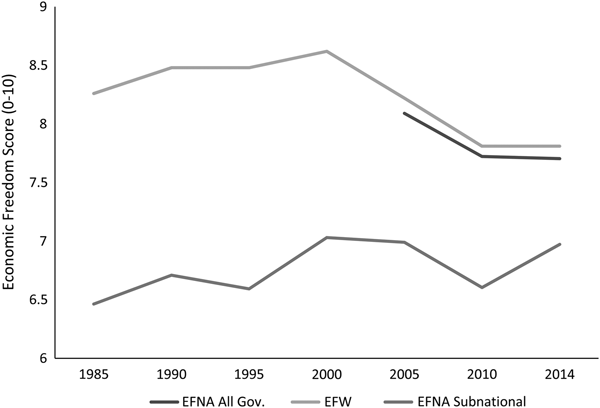
Despite the international trends toward liberalization around the world, the national economic freedom score for the United States has declined in recent years according to the EFW index. The United States’ EFW score fell from 8.62 at its highest point in 2000 to 7.74 at its lowest in 2013. Moreover, since 2009, economic freedom in the United States has been lower than at any time since the 1970s. This trend in federally controlled institutions, however, tells us little about the quality of economic institutions under local control within the United States. Under the system of federalism, both federal and local governments have the ability to encroach on the economic liberties of their constituents. Therefore, split authority within federalism warrants an investigation of the properties of institutional change at the local level similar to the investigation of institutional change at the federal level.
I use the Economic Freedom of North America (EFNA) index as a measure of institutional quality at the local level for states of the United States.Footnote 6 Following Sobel's methodology, this research investigates trends in economic freedom among the states of the United States. While the term “state” refers to a nation or territory under a shared government in international context, I use the terms “state” and “local” interchangeably in this paper to refer to the institutions and governments of the 50 states of the United States.
The EFNA index, like its sister index the EFW, is the result of an effort by economists, including Nobel Laureates Milton Friedman and Frederich Hayek, to create a measure of economic freedom as a proxy for growth-promoting institutions. The EFW index was originally published in 1996 and had been cited more than 400 times as of mid-2011.Footnote 7 The EFNA, which applies the same methodologies to local governing bodies as the EFW index does to international countries, was first published in 2002. It is cited in more than 235 published papers and book chapters. At least 155 of these citations are empirical papers using the EFNA to test/control for the effects of institutional quality on economic outcomes.Footnote 8
The EFNA index measures institutional quality as consistency with the principles of economic freedom, specifically the freedom of individuals to voluntarily exchange with one another without government interference. Fiscal policies, particularly those aimed at redistributing income, weaken property rights and reduce private choices. Wage restrictions and requirements for union membership restrict the ability of workers and firms to voluntarily contract. Government consumption of resources, including labor, reduces the amount of resources available to private firms and even forces firms to bid for labor against their own tax dollars. It is with these ideas in mind that the authors construct the EFNA index to measure institutional quality.
The EFNA index provides two overall economic freedom measures. One of these measures, the all-government score, includes both national and local policies in the overall score for each state. The other measure, the subnational score, includes only policies under direct control of the state: the size of government, tax burden, and labor market freedom. I discuss the changes in both of these measures over time, but I give special attention to institutions under local control rather than federal control. Therefore, I primarily examine changes to the subnational score, which is the measure used in roughly 80% of the papers citing the EFNA index. I identify the drivers of the institutional liberalization of states by decomposing the index into its three equally weighted policy scores and analyzing their movements. Additionally, I examine the speed with which economic reform occurs among the states and compare it to international trends.
While institutional quality and the size of government are not synonymous, they are intimately connected. Indeed, both the EFW index and the EFNA index include measures of government expenditures and taxes as components of economic freedom. Therefore, increasing economic freedom, or liberalization, may be understood as the shrinking of government and declining economic freedom as the growth of government. Because of this interrelation, the theories and conclusions of the government growth literature inform the interpretation of my results.
Holcombe (Reference Holcombe2005) summarizes three schools of thought regarding the growth of government in the public choice literature. The rational-choice school argues that government grows in response to increasing preferences for larger government expressed through a collective choice mechanism. The budget maximization school argues that government bureaucracies are budget maximizers that grow when constitutional and electoral constraints are loosened and shrink when they are tightened. The path-dependency school argues that government growth is a function of historical circumstances, such as economic crises and wars, that have allowed government expenditure to rise. I find some evidence to support each school of thought. Therefore, I interpret each result in light of these competing schools without exclusively advocating for any one in particular.
My first result suggests that while economic freedom has declined in recent years when including measures of federal government institutions, institutions under local control are liberalizing. Increasing freedom, which is associated with a shrinking role of government in the economy, is inherently inconsistent with the path-dependency school. Proponents of this school of thought argue that government ratchets in size during a crisis but provide no explanation for shrinking government. This result is also inconsistent with the rational choice model because it implies that the median voter (or some other alternative collective choice mechanism) has inconsistent preferences for the size of government at the federal and local levels.
However, these trends are consistent with the budget-maximizing hypothesis if the constraints on the size of government are loosening at the federal level and/or tightening at the local level. Holcombe and Lacombe (Reference Holcombe and Lacombe2004) describe this exact situation, where federal and local institutions trend in opposite directions due to differences in electoral constraints. The authors show that local governments grew substantially in the 19th century despite the limited growth of the federal government. The authors attribute the growth of local government to the increase in relatively immobile tax bases attracted by agglomeration economies to cities.
They go on to show that these trends reversed in the 20th century when mobility increased, reducing local governments’ tax bases and slowing the growth of local government. In the meantime, federal government grew following an increase in its tax base due to the creation of the income tax and slowing international capital movements.
Second, I find that labor market freedom is the primary catalyst for economic liberalization among the states. Thus, increases in private sector employment relative to public sector employment, decreases in the minimum wage as a percentage of income, and decreases in union density precede reforms to government spending and tax policies. One interpretation of this result is that increasing private sector opportunities increases the constraint on government spending. This result is also consistent with the budget maximization model. As Mises (Reference Mises1944) explains, when an individual acts as an employee in government rather than an employer, there is an incentive to swell the payroll. As more individuals find labor market opportunities in the private sector and act as employer in the public sphere, the electoral constraint on budget-maximizing bureaucrats increases.Footnote 9
Additionally, this result is consistent with the rational choice model. Becker (Reference Becker1983) argues that competition among interest groups in the political marketplace determines government policies.Footnote 10 Unions are often powerful interest groups in the US political marketplace with incentives to pursue government subsidies and protective regulations. Furthermore, the bureaucracy responsible for administering government policies is an interest group with a unique incentive to maintain or increase the size of government. Increasing labor market opportunities weakens the interest groups that are public employees and unions, and allows for fiscal reform.
Lastly, I find that economic liberalization occurs gradually, and the deterioration of economic freedom occurs rapidly. In the paper most similar to this research, Sobel (Reference Sobel2017) finds that in federally controlled institutions, institutional deterioration also occurs more rapidly than institutional improvement. Therefore, the speed with which institutions deteriorate is more rapid than the speed by which institutions liberalize for both locally and federally controlled institutions.
The relative rapidity with which institutions decline in quality, or government grows, is consistent with the path-dependency school. The path-dependency model, including most notably the ratchet theory proposed by Higgs (Reference Higgs1987), suggests that government grows rapidly in times of crisis as constraints on government loosen. Therefore, the arguments of both the budget maximization model and path-dependency model are compatible with the findings regarding the speed of reform. However, the path-dependency model includes no explanation for increasing freedom, or shrinking government. Therefore, the collective conclusions of this paper are most consistent with government being a budget maximizer that shrinks in size as constraints increase, and ratchets up in size when constraints decrease.
This research does not settle the debate surrounding the cause(s) of government growth, nor is it its purpose to do so. But the literature surrounding this debate provides a framework by which to interpret the results. I highlight those theories of government growth that are most compatible with the results of this research.
2. Federal trends in economic freedom
The EFNA all-government index scores the economic freedom of states between 0 and 10 based on the compatibility of their institutions and policies with the ideals of economic freedom. Both federal and state government policies affect the all-government score of each state. Unfortunately, the all-government index is only available from 2003 to 2014, but the data is sufficient to show the trend occurring at the federal level. In 2003, the average institutional quality for states of the US is 8.2 points. In 2014, the average drops to 7.7 points. This represents a 6.1% decline in the average level of economic freedom among the states in only 11 years. Furthermore, the score for every state in the sample fell from 2003 to 2014.
The unanimity of the decline in institutional quality suggests that national policy changes drive the decline. This is consistent with the trend of the United States in the EFW index, the international counterpart of the EFNA index. In 2000, the United States ranked fourth in the world in institutional quality. In 2014, the United States fell to thirteenth in the world following a drop of 0.81 points in its EFW score. Moreover, EFW scores for the US since 2009 have been the lowest since the 1970s. The swift decline in the quality of the US federal institutions is a result of significant declines in the scores for the quality of the legal system and property rights, and for the freedom to trade.Footnote 11
Figure 1 shows the long-run trends of the EFW index, the EFNA all-government index and the EFNA subnational index. The EFW index is available from 1970 to 2014 but only in five-year increments prior to 2000. The EFNA subnational index is available annually from 1981 to 2014. The EFNA all-government index is only available annually from 2003 to 2014 for US states. As the figure clearly demonstrates, the EFNA all-government index, which is a literally a combination of the EFW and EFNA subnational indexes, is heavily influenced by the trend of the EFW index.
Economic freedom in the United States according to the EFW and EFNA indexes

Meanwhile, as demonstrated in the figure, the EFNA subnational index experiences a general upward trend. In the following section, I use the EFNA subnational index to show that institutions under local control are increasing in quality rather than decreasing, like the federal institutions. Hereafter, the focus of this paper is on economic freedom among state governments rather than federal as measured by the EFNA subnational index. Specifically, I investigate the driver, speed, and explanations for the change in institutional quality among state governments.
3. State and local trends in economic freedom
The EFNA subnational index differs from the all-government index in that it only includes scores for institutions directly under state government control. It is particularly useful for comparing states within the United States, because they share common national institutions. Therefore, the quality of monetary policy, trade, and other nationally determined institutions do not affect the relative economic freedom scores. In contrast to the all-government score, the average subnational score for institutional quality of individual states in the United States is increasing over time. The average increased from 6.1 points in 1981 to 7.0 points in 2014.
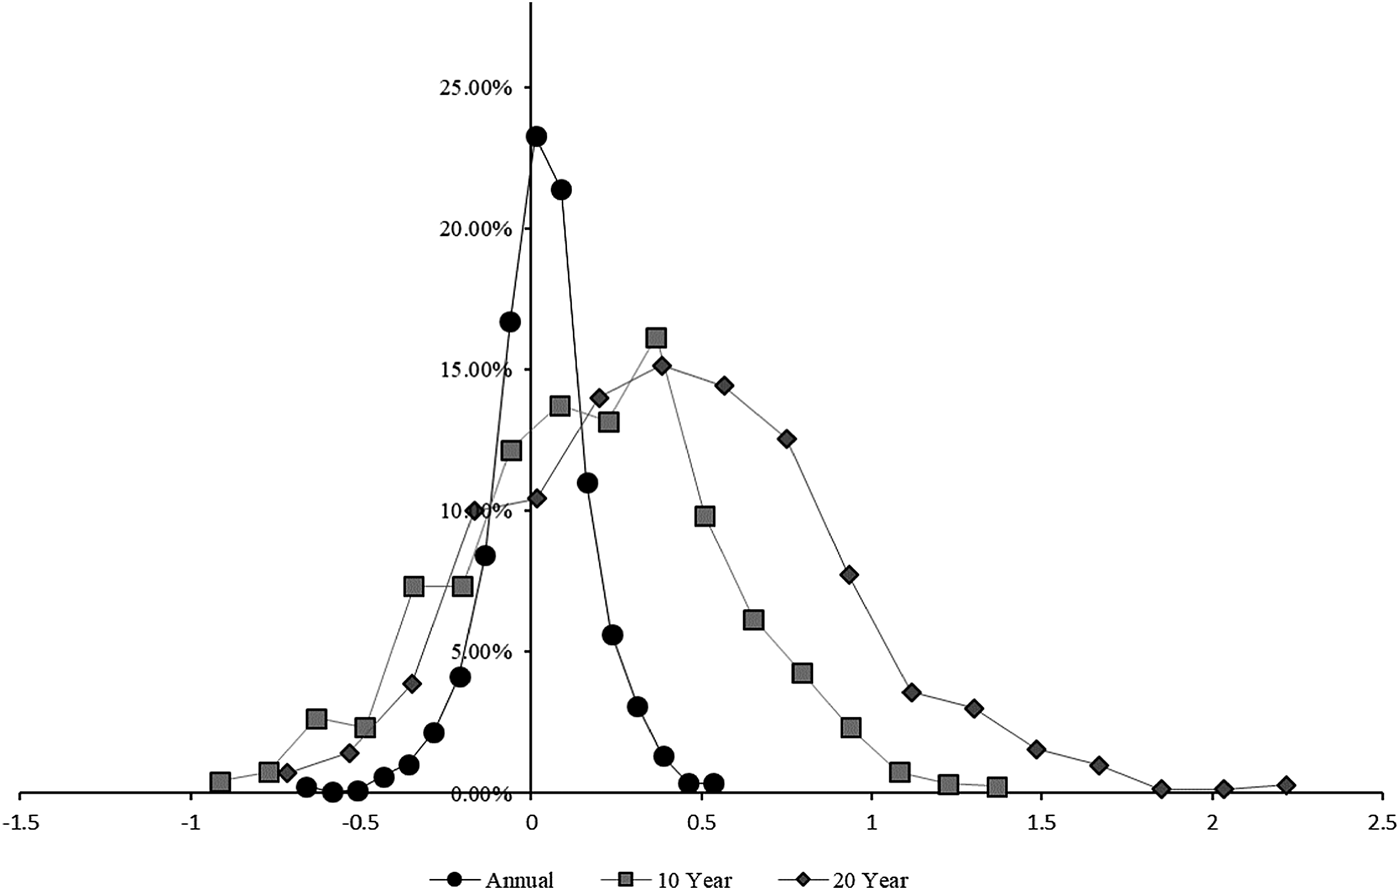
Figure 2 shows the relative frequency distribution of the changes in the EFNA index for the entire sample. I divide the data into 17 equal-width intervals from the minimum to maximum values of annual changes. The annual distribution is narrow with over 60% of the observations falling into the three groupings closest to the center of the distribution. The average annual change in institutional quality is 0.026 points. The cutoff values for the bottom and top tails of the distribution, as defined by a 90% confidence interval, are −0.229 and 0.278. In other words, there is a 10% chance that a randomly selected state experiences an annual change in institutional quality less than −0.229 or greater than 0.278.
Relative frequency of EFNA subnational index changes

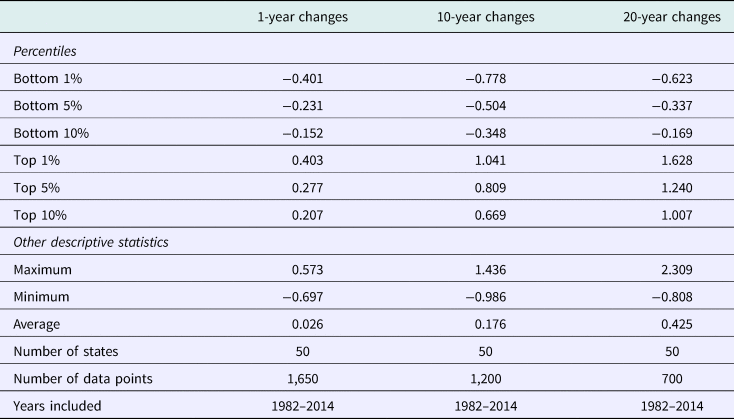
Consider the distributions for 10-year and 20-year changes in the EFNA subnational index overlapping the annual frequency distribution shown in Figure 2. Strikingly, the center of the distribution moves to the right and the distribution widens with an increase in the period of measurement. The rightward shift shows that states tend to gain economic freedom over the long run. This mirrors the trend occurring in the EFW index, which measures national institutions.Footnote 12 The cutoff values for the bottom and top tails of the 10-year distribution, as defined by a 90% confidence interval, are -0.504 and 0.809. The cutoff values for the 20-year distribution are –0.337 and 1.240. The increase in the cutoff value for the bottom tail of the 20-year distribution relative to the 10-year distribution indicates that institutional declines occur less frequently over longer time horizons.
Visually, the right tail of the distribution grows over time, while the left tail remains relatively constant, which depicts larger institutional improvements occurring more frequently as the time horizon expands. As a result, institutional improvements must be larger in magnitude than institutional declines to qualify as a significant institutional reform due to the skewness of the long-run data. Alternatively, the relatively constant left tail of the distribution hints that institutional declines occur rapidly relative to improvements, because increasing the time horizon does not significantly increase the frequency of large institutional declines. A state that falls by 0.75 points over any length of time in the sample is rare, but an equal-sized improvement would not even qualify for the top 10% of institutional improvements over 20 years.
During a period in which federally controlled institutions decline in quality, institutions under local control improve significantly.Footnote 13 As discussed previously, it is not a unique occurrence for federal and state institutions to differ in trends. In the US, the 1800s witnessed the growth of local governments relative to the federal government, and 1900s witnessed the growth of the federal government relative to local government. Holcombe and Lacombe (Reference Holcombe and Lacombe2004) note that local and federal governments face unique constraints, and specifically that the size and mobility of their respective tax bases differs. Thus, federal and state institutions experience unique growth trends.
Coase (Reference Coase1937) points out that there is no natural tendency for firm leadership to respond to shareholders. Therefore, there is no reason to believe political officials’ actions will match the wishes of their constituents without a proper incentive structure. However, federalism, a system of government defined by demarcated scopes of authority between at least two levels of government and self-enforcing restrictions, may produce economically efficient results. Federalism aligns the incentives of political officials with the preferences of constituents who can “vote with their feet” and migrate to other areas.Footnote 14 As a result, federalism is “market-preserving” (see Oates, Reference Oates1972; Qian and Weingast, Reference Qian and Weingast1997; Tiebout, Reference Tiebout1956; Weingast, Reference Weingast1995).
As interstate competition is increasing, the constraints on government increase. Therefore, institutions liberalize and government shrinks, according to the budget maximization model. But interstate geographic mobility in the United States has been declining in recent decades according to the US Census Bureau. Therefore, one might argue that local governments are experiencing less competition rather than more. However, decreasing transportation and communication costs increases the threat of geographic migration, and even the threat of relocation creates competition among local governments. In other words, states compete both to attract and to keep growth-enhancing labor and capital within their borders by offering an attractive combination of public goods and fiscal policies.
Hall (Reference Hall2016) supports this argument by showing that economic freedom converges internationally where individuals can easily exit a country, a measure the author calls Exitability. Hall (Reference Hall2016) goes on to state that “Exitability is likely to be stronger within a country rather than across countries given the importance of passport controls and immigration restrictions” (original italic). Thus, even the threat of individuals exiting a state incentivizes liberalization and results in convergence. Indeed, the states of the US are converging in economic freedom (Naghshpour and Nissan Reference Naghshpour and Nissan2018).
Intergovernmental competition provides one explanation for the liberalization of states in a period in which economic freedom is decreasing nationally. However, it is not the intent of this paper to specify the “why.” Rather, this paper highlights the “what” – that economic freedom is increasing among the states, driven primarily by increasing labor market freedom. It remains a task for future researchers to explore other possible explanations for this to occur, in addition to intergovernmental competition. But, based on the literature discussed above and the positive relation between labor market freedom and in-migration among US states (Ashby, Reference Ashby2007), intergovernmental competition is consistent with the results of this paper.
4. Drivers of economic reform among US states
Analyzing the long-run drivers of economic change requires defining institutional reform and distinguishing institutional improvements from institutional declines. To distinguish long-run policy reforms from normal policy variation, I borrow the methodology of Sobel (Reference Sobel2017). I measure institutional reform for improvers as the total EFNA change from each state's most recent minimum value to the earliest maximum value (and vice versa for decliners). For example, if a state has EFNA values of 5, 5, 5, 6, 8, 9, 9, the third year serves as the beginning of reform and the sixth year completes the reform. Thus, in this example, the state reformed by four EFNA points in three years. This methodology allows for the determination of not only the driver of reform, but also the necessary time horizon for the full reform to complete. Also in accordance with Sobel (Reference Sobel2017), I eliminate states whose institutional quality moves in a V-shaped pattern or whose maximum or minimum value occurs in the first or last year of the sample. This disregards states that are not purely reformers in one direction and states whose economic transition may be incomplete.
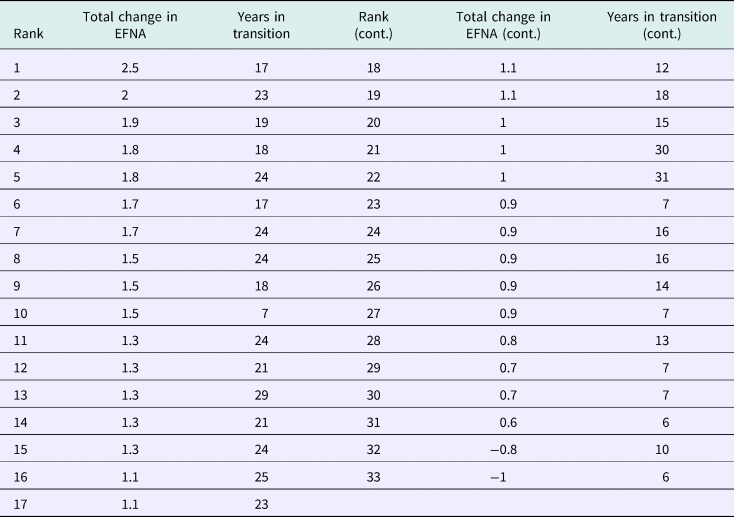
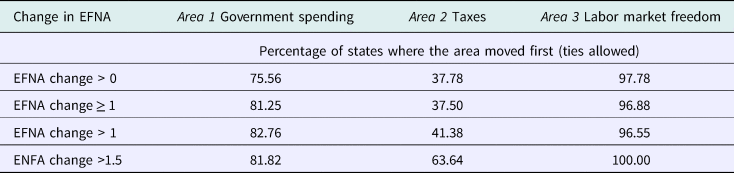
Table 1 presents the size and length of economic reforms observed in the data that meet these qualifications. Using these occurrences of long-run economic reform, I determine the driver of reform based on two criteria: contribution to the total reform and timing of movement during reform. I measure each area's contribution to the total reform as the proportion of the change in the EFNA index that is attributable to each area. I measure the timing of movement based on when each area moves. An area of the index is the first mover if the area trends up before its counterparts.Footnote 15 States that improved their institutional quality are separated from states whose institutional quality declines for determining drivers of reform. Furthermore, institutional improvers are divided into four classes based on the size of reform, and the results are presented for each class.
Years in transition from minimum to maximum EFW values (or vice versa)

Note: The maximum number of years in transition is 34, which is the number of years covered by the EFNA dataset. Occurrences of reform are listed from the largest to the smallest as measured by the size of the overall change in the EFNA index.
Table 2 shows the results of this analysis. Labor market freedom is the first mover in nearly all cases of institutional improvement, while tax policy is clearly the slowest mover. The sum of the first-mover percentages are significantly above 100% showing that ties occur frequently. If I exclude observations in which two or more areas tied for first mover, labor market freedom remains the most common first mover and tax reform is never the first mover. This result implies that labor market liberalization is most often the catalyst behind full and lasting liberalization.
First moving areas of reform

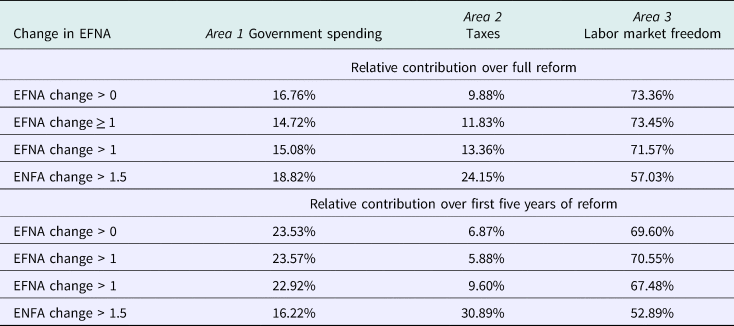
In further support of this conclusion, increasing labor market freedom is also the primary contributor to liberalization for every class of improvers over the first five years and the full liberalization period. Because the three areas of the index are equally weighted, the percentage contribution is simply (1/3)*(change in area score/change in total EFNA). The results in Table 3 show the contribution of each area to the reform over both time horizons. These results imply that increases in private sector employment relative to public sector employment, decreases in minimum wage as a percentage of average income, and decreases in union density precede reforms to government spending and tax policies.Footnote 16
Area contributions to reform

Why is labor market freedom the catalyst for deeper economic liberalization? Increasing labor market opportunities decreases the number of public employees and union density. In the rational choice model, this means that the equilibrium of the political marketplace will shift toward smaller government because two prominent interest groups with an incentive to resist liberalization are weakened. In the budget maximization model, this means that constraints on government tighten and government shrinks because the portion of the electorate acting as employer rather than employee in government increases.
To clarify this point, consider the analysis of the voting incentives of government employees by Mises (Reference Mises1944). Mises states:
The bureaucrat is not only a government employee. He is, under a democratic constitution, at the same time a voter and as such a part of the sovereign, his employer. He is in a peculiar position: he is both employer and employee. And his pecuniary interest as employee towers above his interest as employer, as he gets much more from the public funds than he contributes to them. This double relationship becomes more important as the people on the government's pay roll increase. The bureaucrat as voter is more eager to get a raise than to keep the budget balanced. His main concern is to swell the pay roll.
Public employees have an incentive to resist efforts to reform state fiscal policies because the benefits received as an employee are greater than the costs incurred as employer from these policies. As Bellante and Porter (Reference Bellante and Porter1998) explain, the organizational structure, high rates of unionization and ease of access to decision makers make public employees a formidable interest group opposing reform. Therefore, increasing labor market opportunities, which lowers the costs of and resistance to tax and spending reforms for these individuals, often precedes liberalization in other areas.
The driver of institutional decline in states is not as unanimous as the driver of institutional improvement. For states that experienced declines in institutional quality, the clear driver in three of the five cases was government spending. New Hampshire and Connecticut experienced institutional decline equally driven by tax and spending reforms. Holcombe (Reference Holcombe2005) argues that the growth of government is a result of the increasing availability of revenues. I do not observe a sufficient number of occurrences of institutional decline, or government growth, to support nor deny this conclusion. However, I do observe that labor market freedom, and not tax reform, drives liberalization among the states. In other words, it may be the case that the government grows because of increasing revenue, but my results indicate that government shrinks because of increasing labor market freedom.
These results are not directly comparable to the international results of Sobel (Reference Sobel2017) because the institutions and, thus, the components of the EFNA and EFW indexes, differ. For example, Sobel (Reference Sobel2017) finds that freedom to trade is the driver of liberalization internationally, but there is no analogous measure in the EFNA index. However, labor market liberalization is related to in-migration among the states (Ashby, Reference Ashby2007). Therefore, it is noteworthy that both labor market liberalization (EFNA driver) and freedom to trade (EFW driver) are related to the movement of individuals and goods across borders.
One area in which this analysis is directly comparable to that of Sobel (Reference Sobel2017) is the speed of economic reform. Despite a shortage of observations, the data from states whose institutions deteriorate in the sample shows a noticeable trend. The average length of time required for institutions to decline from their maximum score to their minimum score is significantly shorter than the length of time required for institutional improvement. This result is consistent with the trend internationally and highlights a similarity in the economic reform process between federally controlled institutions and locally controlled institutions. I give this trend additional attention in the proceeding section.
5. Speed of economic reform among US states
Table 1 shows the length of time required to experience full reform for instances of significant institutional change measured in the data. A simple comparison of the average length of time in transition for institutional improvers and decliners shows that the average time spent in reform is much shorter for institutional decliners. The average length of time required to experience full institutional decline is eight years; while the average length of time required to experience full institutional improvement is 19 years. This result is unchanged if we include states whose institutions moved in a V-shape or whose maximum or minimum value occurred in the first or final year (these states were dropped in earlier analysis to be consistent with the methodology of Sobel, Reference Sobel2017).
The cutoff points for the tails of the distributions shown in Table 4 also support the shorter length of time necessary for full institutional decline. The cutoff points for the bottom tail reach their lowest value by 10 years, but the cutoff points for the upper tail continue to increase with the time horizon. This demonstrates that periods of institutional decline have reached completion by roughly 10 years, while periods of institutional improvement require closer to 20 years to run their course. In other words, very few additional instances of significant institutional decline appear when I measure 20-year changes rather than 10-year changes.
Descriptive statistics for changes in economic freedom by time length

Connecticut is a good example of the speed with which institutional decline occurs. In 1991, Connecticut passed the income tax for the first time in state history, decreasing its EFNA tax component score by one full point. As suggested by Holcombe (Reference Holcombe2005), increased revenue led to increased government spending and a drop in Connecticut's government spending score by 0.5 points from 1991 to 1994. Over the same period, labor market freedom increased by 0.2 points. Connecticut's overall EFNA score dropped 0.5 points from 1991 to 1994, which was part of a larger drop of one full point from 1989 to 1995. According to data from How Money Walks, Connecticut lost $16.33 billion in annual adjusted gross income from 1992 to 2016, including $10.65 billion lost to Florida and $1.2 billion lost to Texas – neither of which has a state income tax.Footnote 17
On the other hand, Michigan's EFNA score increased by 3.5 points over 17 years as labor market freedom increased and government spending declined slowly over time. Michigan's government spending score increased by 3.5 points from 1983 to 2000, driven primarily by decreases in spending on transfers and subsidies as a percentage of income and insurance and retirement payments as a percentage of income by 1.1 and 0.9 percentage points respectively. Michigan's labor market freedom score increased by 3.1 points, driven equally by a decreased burden of minimum wage as a percentage of income and decreased union membership. Thus, the increased ability of firms and workers to contract and the decreased transfer of constituents’ incomes to transfer programs increased the EFNA score of Michigan.
This result is consistent with the trend in national-level data and with the theories in the literature explaining the expansion of the role of government in the economy. Specifically, the path-dependency model, including the ratchet theory, states that economic freedoms deteriorate because of single events that lead to the expansion of government. There is no equivalent explanation for institutional improvements, but rather, the literature on prosperity argues that small increases in economic growth over time accompanied by a corresponding institutional improvement will lead to higher standards of living. Furthermore, this trend is consistent with the trend in the international literature and highlights a similarity between national institutional change and local institutional change.
6. Conclusion
While economic freedom at the federal level in the United States has decreased in recent decades, economic freedom is increasing among state governments. This suggests that a characteristic unique to each governing authority drives institutional change over time. Shared characteristics, like demographics and ideology, are insufficient to explain institutional trends, because they cannot explain the discrepancy in trends between federal and state institutions. Differences in electoral and constitutional constraints between federal and state governments are a better explanation for the differences in institutional trends.
Consistent with this expectation, I show that labor market liberalization, which has been shown to be positively related to geographic in-migration, drives long-run liberalization at the state level. Improved labor market freedom is not only the largest contributor to changes to institutional quality as measured by the EFNA, but it is also the most common first mover for reform. As labor market freedom increases, meaning union density and the public employment percentage decreases in a state, institutions liberalize and government shrinks. This result is consistent with both the rational choice and budget maximization models of government growth. As interest groups with incentives to resist reforms weaken, constraints on government tighten, which allows for increased liberalization. Furthermore, I show that liberalization occurs gradually relative to the rapidity with which institutional deterioration occurs. This is consistent with the claims of the path-dependency model of government growth that government grows and institutions deteriorate rapidly in times of crisis.
The policy implications of these results are simple – liberalize labor market institutions and further liberalization is likely to follow. As employment opportunities in the private sector and entrepreneurship increase, reliance on public employment and union membership decreases, interest groups incentivized to oppose cuts to government shrink, and doors open for the further expansion of economic freedom. Removing government obstacles to labor market freedoms unleashes market forces that spur further increases in economic freedom.
Acknowledgment
The author would like to thank Claudia R. Williamson, Dean Stansel, Randall C. Campbell, Cheng Li and Travis Wiseman for helpful comments and suggestions.