1. Introduction
Ultrasonic atomization, or the emission of a fog of micro-droplets from an acoustically excited liquid–air interface, has been well-known since the landmark experiment by Wood & Loomis (Reference Wood and Loomis1927). Since then, ultrasonic atomization has been used commercially in air humidifiers, medical nebulizers, and other such devices. However, the mechanism of atomization is still not well understood. Currently, the most accepted theory of atomization is the cavitation-wave hypothesis (illustrated in figure 1), which states that a combination of capillary waves on the liquid surface (i.e. Faraday ripples) along with acoustically driven bubble oscillations beneath the liquid surface (i.e. acoustic cavitation) cause the droplets to be emitted (Rozenberg Reference Rozenberg1973). Further, the surface is often transformed into a fountain in the shape of a stack or chain of nearly spherical drops, and any one drop in the chain can atomize, presumably by a similar process. There remains debate as to the relative contributions of bubbles and surface instabilities, particularly in the drop-chain fountain. In this paper, high-speed videography of water atomization at different frequencies, temperatures, and static pressure levels, as well as the atomization of other liquids, is used to provide experimental evidence as to the mechanism of atomization, specifically in the regime when a focused ultrasound beam creates an acoustic fountain in the form of a drop chain. We hypothesize that bubbles are a significant mechanism of liquid atomization in the drop-chain fountain.
Schematic depicting the cavitation-wave hypothesis describing atomization from a focused ultrasound wave encountering a liquid–air interface. The focused wave forms a protuberance in the liquid surface, focusing the wave inverted from the pressure-release interface and causing cavitation bubbles to form within the liquid protuberance. Oscillations of the cavitation bubbles along with capillary waves on the liquid surface facilitate the pinch-off of droplets in atomization.

Previously, researchers have investigated the role of cavitation in liquid atomization with sonoluminescence and the manipulation of material surface tension, shear viscosity, and ambient pressure (Sollner Reference Sollner1936; Rozenberg & Eknadiosyants Reference Rozenberg and Eknadiosyants1960; Gershenzon & Eknadiosyants Reference Gershenzon and Eknadiosyants1964; Il’in & Eknadiosyants Reference Il’in and Eknadiosyants1967, Reference Il’in and Eknadiosyants1969). Many of the initial studies were conducted using plane-wave ultrasound with frequencies ranging between 10 kHz and 1.5 MHz (Wood & Loomis Reference Wood and Loomis1927; Antonevich Reference Antonevich1959; Lang Reference Lang1962; Boguslavskii & Eknadiosyants Reference Boguslavskii and Eknadiosyants1969; Topp Reference Topp1973; Barreras, Amaveda & Lozano Reference Barreras, Amaveda and Lozano2002). Results from these studies were unclear as to whether atomization from the plane wave arose from parametric instabilities (i.e. capillary waves) or from cavitation bubble oscillations. More recently, the mechanism of plane-wave atomization for the specific case of thin-film surface acoustic-wave nebulization was investigated, where it was found that atomization was a result of capillary-wave breakup rather than cavitation (Qi, Yeo & Friend Reference Qi, Yeo and Friend2008; Collins et al. Reference Collins, Manor, Winkler, Schmidt, Friend and Yeo2012; Blamey, Yeo & Friend Reference Blamey, Yeo and Friend2013). When the plane ultrasound wave was replaced with focused waves in the megahertz frequency range (0.5–5.4 MHz), it was found that atomization arose from a liquid fountain (McCubbin Reference McCubbin1953; Gershenzon & Eknadiosyants Reference Gershenzon and Eknadiosyants1964; Eknadiosyants Reference Eknadiosyants1968; Boguslavskii & Eknadiosyants Reference Boguslavskii and Eknadiosyants1969; Bassett & Bright Reference Bassett and Bright1976). At moderate acoustic intensities, the fountain took the form of a chain of drops on the order of millimetres in diameter, and atomization arose from the drops in the chain. At higher acoustic intensities, the fountain was less defined and atomization ensued from a liquid protuberance similar to what is illustrated in figure 1 (Simon et al. Reference Simon, Sapozhnikov, Khokhlova, Wang, Crum and Bailey2012). The figure depicts one version of the cavitation-wave hypothesis for a focused ultrasound wave which begins with the radiation force from the focused wave causing a protuberance to form in the liquid surface. When the protuberance forms, coherent interaction between the waves incident on and reflected from the pressure-release interface results in the formation of numerous cavitation bubbles within the protuberance. Acoustic emissions from the oscillation and collapse of these cavitation bubbles separately or synergistically add to the surface ripples caused by capillary-wave instabilities and facilitate the pinch-off of droplets in atomization. Besides proposing that atomization is the result of capillary waves and cavitation bubbles, some iterations of the cavitation-wave hypothesis also suggest that the size of the emitted droplets depends upon the mechanism of release: capillary-wave instabilities emit small, consistent-sized micro-droplets while cavitation bubble oscillations and collapses emit larger, more diverse-sized micro-droplets (Antonevich Reference Antonevich1959). While many of the experimental results, especially those from a focused source, support some version of the cavitation-wave hypothesis, there is still some debate as to the mechanism, or relative contributions of a variety of mechanisms, of atomization particularly in the drop-chain fountain.
In the decades since the initial atomization studies, high-speed photography technologies have improved significantly, allowing more precise observations of atomization. Recently, we showed that atomization from the top drop in a drop-chain fountain at 2.165 MHz could arise in less than
 $100~{\rm\mu}\text{s}$
from a triangular-shaped distortion (Simon et al.
Reference Simon, Sapozhnikov, Khokhlova, Wang, Crum and Bailey2012). These observations of atomization along with the video frames published in Rozenberg (Reference Rozenberg1973) led to several hypotheses of atomization specific to drop-chain fountains that were detailed in Simon et al. (Reference Simon, Sapozhnikov, Khokhlova, Wang, Crum and Bailey2012). The first possibility was that the top drop in the chain becomes a spherical acoustic resonator, in which highly excited radial oscillations at some stage become unstable causing non-spherical shape deformations that break the drop into pieces. The second possible mechanism was that a cavitation bubble (or bubble cloud) forms in the centre of the drop (where the standing pressure wave amplitude is at its maximum) causing the liquid to move unchecked from the centre of the drop. The final hypothesis was boiling: shocks could form while the spherical wave is reverberating in the drop and cause localized heat deposition near the drop centre, and when the temperature reaches or exceeds
 $100\,^{\circ }\text{C}$
(providing for some superheating in the absence of a suitable nucleus), a vapour bubble forms and the drop explodes. The first two suggested mechanisms are captured in the cavitation-wave hypothesis; however, the novel idea presented here is that heat deposition and boiling could contribute to atomization in the drop-chain fountain.
The goal of this paper is to provide experimental evidence that bubbles are a significant driving force for atomization in drop-chain fountains. High-speed photographic images of atomization are reported encompassing a range of ultrasonic frequencies and for liquids of various viscosities, surface tensions, and boiling points. In addition, images of water atomization in an overpressure chamber at static pressure levels up to
 $14~\text{MPa}$
are also presented and described. The experimental descriptions of atomization in drop-chain fountains enhance the understanding of the basic physical phenomena and provide the basis for future numerical modelling.
2. Methods
2.1. Effect of frequency on atomization
Three different focused ultrasound transducers were operated at frequencies of 2.165 MHz, 1.04 MHz, and 155 kHz to determine the effect of frequency on atomization of water in a drop-chain fountain. All three transducers were air-backed, single-element, piezoceramic crystals (PZ 26, Ferroperm Piezoceramics, Kvistgaard, Denmark) with spherical bowl shapes and were mounted in custom-built polycarbonate housings. The
 $F$
-number (i.e. the ratio between the focal length and source diameter) was one (
 $F=1$
) for all three transducers: both the 2.165 and 1.04 MHz transducers had aperture diameters and radii of curvature of 45 mm; the 155 kHz transducer had a larger, 100 mm aperture diameter and radius of curvature. A function generator (Model 33250A, Agilent, Palo Alto, CA, USA) and linear radiofrequency amplifier (55 dB, model A300, ENI, Rochester, NY, USA) were used to drive the transducers.
Experimental arrangement for water atomization. Exposures were recorded with a high-speed camera and backlit (not shown).

The transducers were focused at the surface of filtered, degassed water, and the acoustic fountain was recorded with a Photron APX-RS high-speed camera (monochrome, Photron, San Diego, CA) as shown in figure 2. Videos taken at 5000–30 000 frames per second (f.p.s.) were backlit with a flash or continuous disperse light source (Photogenic PowerLight 2500DR, Bartlett, IL, USA). A Carl Zeiss lens (Makro-Planar T*2/100, Thornwood, NY, USA) with a bellows extension provided a resolution on the order of
 $40~{\rm\mu}\text{m}~\text{pixel}^{-1}$
.
Prior to experimentation, the 2.165 and 1.04 MHz transducers were characterized using a fibre-optic probe hydrophone (FOPH 2000, RP Acoustics, Leutenbach, Germany) with a
 $100~{\rm\mu}\text{m}$
active diameter. The acoustic field produced by the 155 kHz transducer was mapped with a calibrated Onda Reson hydrophone (Onda Corporation, Sunnyvale, CA, USA) at low input voltages and scaled to the voltages used for atomization. As all transducers were operated at or near the linear regime, the measured waveforms were nearly sinusoidal and are not shown here.
2.2. Heated water atomization
To test the hypothesis that boiling could explain atomization in the drop-chain fountain, an experiment was conducted where water was heated to approximately
 $60\,^{\circ }\text{C}$
and atomized regularly while cooling. The same 2.165 MHz transducer that was described previously was used in the experimental configuration shown in figure 2. After stirring the solution to minimize local temperature gradients, a thermocouple was used to measure the bulk water temperature for each exposure. Water was atomized at a focal acoustic intensity of
 $180~\text{W}~\text{cm}^{-2}$
. This intensity level was chosen because it was shown to be the level at which atomization first appeared (inconsistently) at
 $20\,^{\circ }\text{C}$
(Simon et al.
Reference Simon, Sapozhnikov, Khokhlova, Wang, Crum and Bailey2012). The time for atomization to commence (after turning on the ultrasound source) was determined from recorded high-speed videos and plotted versus temperature to determine whether a relationship exists between the liquid temperature and its atomization.
2.3. Atomization of other liquids
Even though shear viscosity is known to affect all three proposed mechanisms of atomization (capillary waves, acoustic cavitation, and boiling), liquids of various shear viscosities were investigated to test whether atomization ceased when the shear viscosity was increased. Previously, atomization was attempted in glycerol, castor oil, and 70 % ethanol (Simon et al.
Reference Simon, Sapozhnikov, Khokhlova, Wang, Crum and Bailey2012); other liquids, including olive oil, 1,3-butanediol, and n-propanol were also tested. In particular, olive oil and 1,3-butanediol were included because they had similar sound speeds and densities to water, but significantly higher boiling temperatures. Additionally, a recent paper by Maxwell et al. (Reference Maxwell, Cain, Hall, Fowlkes and Xu2013) showed that the cavitation threshold negative pressure amplitude for a single cycle of focused ultrasound in olive oil and 1,3-butanediol was greater than
 $35~\text{MPa}$
whereas the cavitation threshold for distilled and degassed water was measured to be
 $p_{-}=27.4~\text{MPa}$
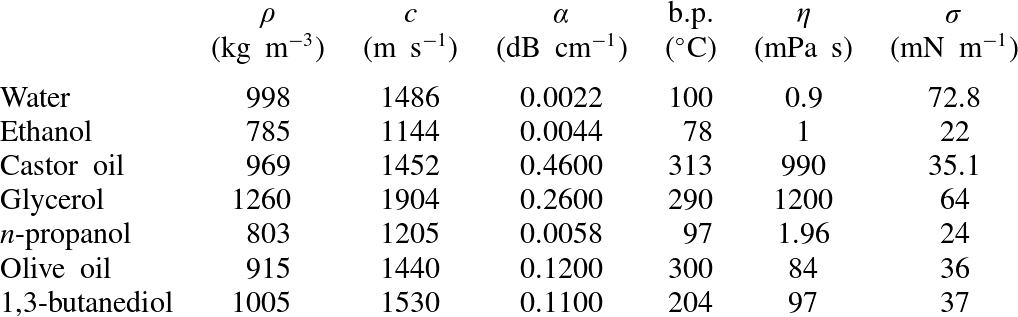
(peak negative pressure). The other chemical, n-propanol, was of interest because it has a boiling point similar to that of water but double the shear viscosity. The physical properties of these liquids are listed in table 1.
Properties of liquids used at
 $25\,^{\circ }\text{C}$
and atmospheric pressure:
 ${\it\rho}=$
density;
 $c=$
sound speed;
 ${\it\alpha}=$
acoustic absorption coefficient at 1 MHz;
 $\text{b.p.}=$
boiling point;
 ${\it\eta}=$
shear viscosity;
 ${\it\sigma}=$
surface tension (Treeby et al.
Reference Treeby, Cox, Zhang, Patch and Beard2009; Kujawska Reference Kujawska2012; Maxwell et al.
Reference Maxwell, Cain, Hall, Fowlkes and Xu2013; National Physical Laboratories 2013; The Engineering Toolbox 2013).

The same 2.165 MHz transducer was used that was described previously. The liquids were poured with variable thicknesses between 2 and 10 mm into a custom-designed container with an acoustically transparent, thin-film bottom. The container was partially submerged in a water tank to couple the liquid in the container to the focused transducer while maintaining a free liquid–air interface. As before, atomization events were monitored using high-speed videography and the transducer was driven with the same function generator and radiofrequency amplifier as described previously. Reported intensities include both the water measurement and the intensity derated through the thin liquid layer by multiplying the level measured in water with the factor
 $\exp (-2({\it\alpha}-{\it\alpha}_{0})h)$
, where
 ${\it\alpha}$
is the acoustic absorption coefficient of the liquid (see table 1),
 ${\it\alpha}_{0}$
is the absorption coefficient of water, and
 $h$
is the liquid layer thickness. The absorption coefficient was assumed to grow quadratically with frequency (i.e.
 ${\it\alpha}(\,f)={\it\alpha}_{0}\,f^{2}$
) except in the cases of castor oil and olive oil, which were previously shown to have 1.67 power dependences on frequency (Treeby et al.
Reference Treeby, Cox, Zhang, Patch and Beard2009; Kujawska Reference Kujawska2012).
Photograph of the experimental configuration for high static pressure atomization. Exposures were recorded through acrylic windows on either side of the chamber. Overpressure was induced using a compressed air cylinder controlled by a regulator. The transducer was built into the lower lid of the chamber and was a flat, piezoceramic source that was focused by a curved, aluminium lens and operated at 2.127 MHz.

2.4. High static pressure atomization
Increasing the static pressure has been shown to suppress bubble activity for other ultrasound-based applications (Bronskaya et al.
Reference Bronskaya, Vigderman, Sokol’skaya and El’piner1968; Hill Reference Hill1971; Bailey et al.
Reference Bailey, Couret, Sapozhnikov, Khokhlova, ter Haar, Vaezy, Shu and Crum2001; Sapozhnikov et al.
Reference Sapozhnikov, Khokhlova, Bailey, Williams, McAteer, Cleveland and Crum2002; Khokhlova et al.
Reference Khokhlova, Bailey, Reed, Cunitz, Kaczkowski and Crum2006). To separate the effects of bubbles, either acoustic cavitation or boiling, from surface instabilities in atomization of the drop-chain fountain, overpressure was applied to a pressure chamber containing a water–air interface. The aluminium-walled overpressure chamber with acrylic windows is shown in figure 3. A 2.127 MHz transducer was built into the bottom lid of the chamber using a flat, 40 mm, piezoceramic source that was focused at the water surface using an aluminium lens. Before experimentation, the waveforms of the aluminium-lensed transducer were measured with the same fibre-optic probe hydrophone that was described previously. As atomization requires a pressure-release (or liquid–air) interface, overpressure was induced using compressed air and controlled with a regulator (ProStar 4092, Praxair, Seattle, WA, USA). Water level within the chamber was controlled by a hydraulic syringe pump, which allowed the water level to be manipulated even when the chamber was pressurized. The acrylic windows in the sides of the chambers allowed recording with the same Photron high-speed camera and backlighting with the same Photogenic continuous light source that were described previously, but with a slightly better resolution on the order of
 $20~{\rm\mu}\text{m}~\text{pixel}^{-1}$
.
(a) Water atomization from a 1.04 MHz focused ultrasound transducer operating at
 $245~\text{W}~\text{cm}^{-2}$
(
 $p_{+}=3.1~\text{MPa}$
and
 $p_{-}=2.3~\text{MPa}$
) and recorded at 30 000 f.p.s. The water drops in the chain oscillate around 1.5 mm in diameter. The top drop changes from transparent to opaque in less than 0.1 ms and begins to explode outward in a triangular pattern with jet velocities up to
 $15~\text{m}~\text{s}^{-1}$
. (b) Water atomization from a 155 kHz focused ultrasound transducer operating at
 $264~\text{W}~\text{cm}^{-2}$
(
 $p_{+}=p_{-}=2.8~\text{MPa}$
) and recorded at 5000 f.p.s. The water drops in the chain oscillate around 7.5 mm in diameter, and the jets explode outward from the neck region between the drops in the chain at velocities of 2–
 $4~\text{m}~\text{s}^{-1}$
. Supplementary movie 1 shows this figure in video format, available online at http://dx.doi.org/10.1017/jfm.2015.11.

With the exception of the heated-water atomization experiment (which was only repeated for a different intensity), all of these experiments were repeated several times. While only a few sample images are presented and discussed in detail, the trends were replicated and are representative of images taken under similar conditions.
3. Results
3.1. Effect of frequency on atomization
For all frequencies tested, a drop-chain fountain forms at low acoustic intensities without atomization. As the acoustic intensity increases, atomization arises from the drop-chain fountain, generally from the top drop in the chain; we define the threshold intensity to be the acoustic intensity at which atomization occurs consistently within a 10 ms pulse. When the acoustic intensity is further elevated, the drop-chain fountain structure becomes less defined and atomization increases. At an ultrasonic frequency of 1.04 MHz and a focal threshold intensity of
 $245~\text{W}~\text{cm}^{-2}$
as shown in figure 4(a), droplets on the order of tens of microns in diameter (limited by camera resolution) are emitted in a triangular (or possibly conical) pattern at horizontal velocities of approximately
 $15~\text{m}~\text{s}^{-1}$
and vertical velocities of
 $7~\text{m}~\text{s}^{-1}$
. Before atomization commences, the top drop in the chain changes from transparent to opaque in less than
 $33~{\rm\mu}\text{s}$
, the temporal resolution of the video. The diameter of the drops in the drop-chain fountain oscillates around 1.5 mm, which is approximately equal to the wavelength of the 1.04 MHz transducer (1.43 mm). The entire droplet explosion sequence occurs in less than 1 ms.
Water atomization from a 2.165 MHz focused transducer operating at
 $180~\text{W}~\text{cm}^{-2}$
(
 $p_{+}=2.5~\text{MPa},p_{-}=2~\text{MPa}$
) and recorded at 20 000 f.p.s. with diffuse lighting. In the second frame, there is a shadow just to the right of centre in the top drop of the chain, which we speculate to be a bubble (or bubble cloud). In the next frame, taken 0.05 ms later, jets of droplets are released from the top drop in the drop-chain fountain. This figure is included in video format in supplementary movie 1.

When the frequency is decreased to 155 kHz, the top drop in the chain atomizes when exposed to a threshold intensity of
 $264~\text{W}~\text{cm}^{-2}$
as shown in figure 4(b). The mean diameter of the drop chain is 7.5 mm, which is somewhat smaller than (but approximately equal to) the calculated acoustic wavelength in water at 155 kHz (9.59 mm). The emitted droplets range from tens of microns (limited by camera resolution) up to
 $600~{\rm\mu}\text{m}$
in diameter and are emitted at velocities of
 $2{-}4~\text{m}~\text{s}^{-1}$
. Compared to atomization at 1.04 MHz, atomization at 155 kHz takes ten times as long to commence (
 $4.1\pm 0.4~\text{ms}$
at 1.04 MHz compared to
 $34\pm 2~\text{ms}$
at 155 kHz). This corresponds to approximately 4200 cycles for atomization to commence at 1.04 MHz or 5300 cycles for atomization to commence at 155 kHz.
In an effort to visualize bubbles in the drop-chain fountain, the lighting was changed from direct backlighting by adding a diffuser, and the camera depth of focus was decreased. The water–air interface was exposed to 2.165 MHz ultrasound operating at
 $180~\text{W}~\text{cm}^{-2}$
(an intensity at which atomization occurred inconsistently) and recorded at 20 000 f.p.s. as shown in figure 5. The mean diameter of the drop chain is 0.62 mm, which is approximately equal to the calculated wavelength at 2.165 MHz (0.69 mm). As shown in the centre frames of figure 5, a shadow appears to the right of centre in the top drop of the chain immediately before an atomization event occurs; the atomized droplets are emitted at velocities up to
 $16~\text{m}~\text{s}^{-1}$
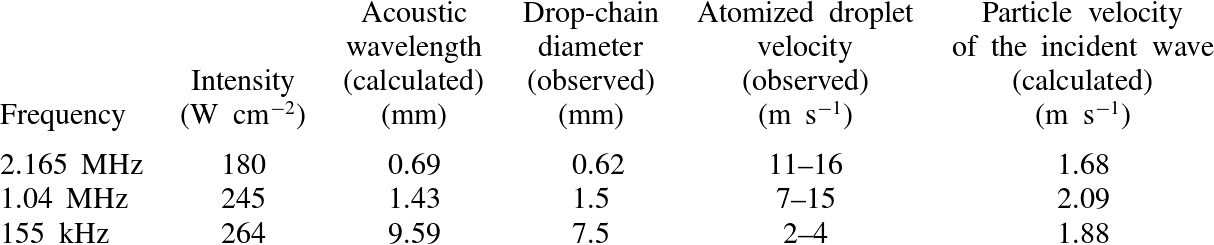
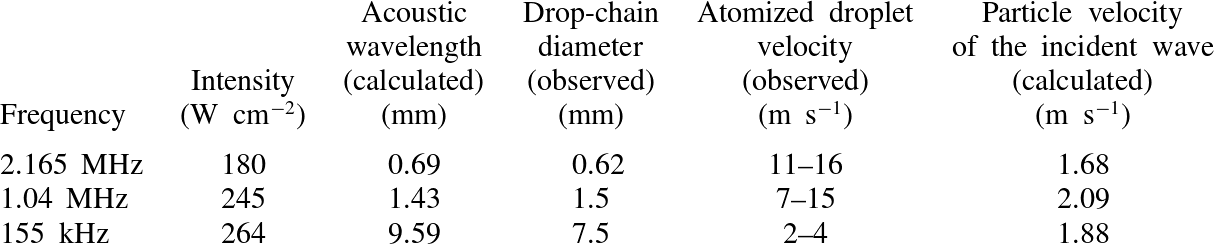
. While the shadow in the top drop is not observed every time before atomization, when it is present it is always immediately followed by the release of atomized droplets. We posit that the shadow is caused by a bubble (or bubble cloud) in the drop. This speculation is supported by work from Tomita & Tanaka (Reference Tomita and Tanaka2012) who observed cavitation activity in the top drop of the drop-chain fountain prior to atomization. The results for atomization at the three different frequencies are summarized in table 2; the atomized droplet velocity is included for comparison to the calculated particle velocity of the incident wave for each frequency/intensity pair, which depends on the focal acoustic pressure, liquid density, and liquid speed of sound.
Plot showing the time to commence atomization versus bulk water temperature. The three open diamonds located at 10 ms indicate that atomization did not occur at the measured temperature within the 10 ms pulse. All other data show an approximate trend: as the temperature increases, the time to commence atomization decreases.

Comparison between calculations and observations for three frequencies at
 $25\,^{\circ }\text{C}$
.
3.2. Heated water atomization
The effect of temperature on atomization in the drop-chain fountain was investigated and the time to the initial atomization event versus bulk water temperature is plotted in figure 6. A general trend is apparent in that as the temperature increases, the time to the commencing of atomization decreases. In three cases, which are marked at 10 ms with an open diamond for the measured temperature, atomization did not occur within the 10 ms pulse. This was unsurprising as at
 $20\,^{\circ }\text{C}$
, atomization occurs inconsistently at the
 $180~\text{W}~\text{cm}^{-2}$
intensity.
(a) Atomization of 70 % ethanol when exposed to 2.165 MHz focused ultrasound at
 $180~\text{W}~\text{cm}^{-2}$
. The emitted droplets (one visible in the photo just to the left of the drop chain) are larger and emitted more slowly than atomization of water for a similar frequency and intensity. Both (b) castor oil, and (c) glycerol do not atomize, even when exposed to 2.165 MHz ultrasound at the maximum intensity (in water) of
 $24\,000~\text{W cm}^{-2}$
(
 $p_{+}=65,p_{-}=16~\text{MPa}$
).

3.3. Atomization of other liquids
When water is exchanged for 70 % ethanol (as shown in figure 7
a), a few relatively large droplets (approximately
 $200~{\rm\mu}\text{m}$
in diameter) are emitted at velocities of
 $2{-}4~\text{m}~\text{s}^{-1}$
upon exposure to 2.165 MHz ultrasound at the atomization threshold intensity of
 $180~\text{W}~\text{cm}^{-2}$
. The mean diameter of the drops in the drop-chain fountain for 70 % ethanol is smaller (0.59 mm) than was observed previously in water at 2.165 MHz (0.62 mm). Note that this fact is in accordance with the lower sound speed in ethanol (1144 versus
 $1486~\text{m}~\text{s}^{-1}$
); the calculated drop diameter in ethanol at 2.165 MHz is 0.53 mm. Castor oil and glycerol form fountains but do not atomize when exposed to 2.165-MHz ultrasound at the maximum acoustic intensity in water of
 $24\,000~\text{W}~\text{cm}^{-2}$
(shown in figure 7
b,c), even for very thin (approximately 2 mm thick) layers (derated intensities are
 $12\,000~\text{W}~\text{cm}^{-2}$
and
 $15\,000~\text{W}~\text{cm}^{-2}$
for castor oil and glycerol, respectively). The mean diameter of the glycerol drop-chain fountain is 0.79 mm (calculated wavelength is 0.88 mm) and propagates vertically at
 $2~\text{m}~\text{s}^{-1}$
. In castor oil, the sides of the fountain are smooth with no drop-chain structure; the fountain propagates vertically at
 $2.4~\text{m}~\text{s}^{-1}$
with a consistent diameter of 0.83 mm (calculated wavelength is 0.68 mm).
When water is exchanged for olive oil or 1,3-butanediol, jets (as opposed to discrete droplets) are released that appear qualitatively different from those of water. Figure 8(a) shows olive oil atomization at the derated threshold intensity of
 $240~\text{W}~\text{cm}^{-2}$
(
 $550~\text{W}~\text{cm}^{-2}$
in water). Thin jets are emitted that remain partially connected to the olive oil drop-chain fountain before eventually being released as a discrete droplet. Atomization of 1,3-butanediol occurs similarly, although the derated atomization threshold of 1,3-butanediol is higher at
 $360~\text{W}~\text{cm}^{-2}$
(not shown). Jets released from either olive oil or 1,3-butanediol have similar diameters of approximately
 $70~{\rm\mu}\text{m}$
and reach velocities up to
 $7~\text{m}~\text{s}^{-1}$
. The mean diameter in the olive oil drop-chain fountain is 0.64 mm (calculated wavelength is 0.67 mm).
(a) Olive oil atomization from 2.165 MHz focused ultrasound operating at an intensity (in water) of
 $550~\text{W}~\text{cm}^{-2}$
(
 $p_{+}=5.5~\text{MPa},p_{-}=4~\text{MPa}$
). A jet begins to be emitted from the left-hand side of the drop chain, but collapses rather than being ejected from the chain. On the right-hand side of the drop chain, a
 $70~{\rm\mu}\text{m}$
diameter jet is emitted with a velocity of
 $3.7~\text{m}~\text{s}^{-1}$
. (b) n-propanol atomization from 2.165 MHz ultrasound operating at an intensity (in water) of
 $365~\text{W}~\text{cm}^{-2}$
(
 $p_{+}=4~\text{MPa},p_{-}=3~\text{MPa}$
), which appears qualitatively very similar to water atomization at similar intensities. The jets explode in a triangular pattern at velocities reaching
 $10.2~\text{m}~\text{s}^{-1}$
. These initial atomization events excite further atomization events as shown in the final frame. This figure is available in video format in supplementary movie 2.

Atomization exposures were also conducted in n-propanol, a chemical that has a similar boiling point to water but double the shear viscosity. Figure 8(b) shows n-propanol atomization at the derated intensity of
 $350~\text{W}~\text{cm}^{-2}$
(
 $365~\text{W}~\text{cm}^{-2}$
in water), an intensity above the atomization threshold of n-propanol of
 $180~\text{W}~\text{cm}^{-2}$
. The droplets explode outward in a triangular pattern at velocities up to
 $10~\text{m}~\text{s}^{-1}$
. The initial triangular atomization event excites more atomization events past the 1 ms time point (not shown). Except for the jet connected to the upper surface of the drop-chain fountain, individual droplets are emitted with diameters on the order of tens of microns (measurement precision limited by camera resolution). The mean diameter of the n-propanol drop-chain fountain is 0.58 mm (calculated wavelength is 0.55 mm).
Water atomization in the overpressure chamber from the 2.127 MHz focused ultrasound transducer operating at
 $850~\text{W}~\text{cm}^{-2}$
(
 $p_{+}=5.5~\text{MPa},p_{-}=4.5~\text{MPa}$
) and recorded at 10 000 f.p.s. At atmospheric pressure (
 $0.1~\text{MPa}$
), atomization is very dramatic, with droplets ranging from less than 20 (1 pixel) up to
 $400~{\rm\mu}\text{m}$
in diameter and emitted at velocities ranging from 2 to
 $8~\text{m}~\text{s}^{-1}$
. When the static pressure applied to the system reaches
 $1.38,2.41$
and
 $3.45~\text{MPa}$
, the fountain becomes drop-chain in structure and a decreasing number of droplets are emitted. As the pressure is increased to 6.89, 8.27, or
 $10.34~\text{MPa}$
, atomization ceases and no droplets are emitted during the 10 ms exposures. Interestingly, however, when the static pressure increases still further to
 $13.79~\text{MPa}$
, droplets are again released from the drop chain. Select static pressure levels from this figure are available in video format in supplementary movie 3.

3.4. High static pressure atomization
As the transducer in the high static pressure chamber differs in design from those used previously (aluminium-lensed focusing as compared to curved piezoceramic focusing), the intensity at which water begins to atomize (albeit inconsistently) at
 $2.127~\text{MHz}$
of
 $200~\text{W}~\text{cm}^{-2}$
(
 $p_{+}=2.5~\text{MPa},p_{-}=2.4~\text{MPa}$
), was compared and found to be similar to the intensity for inconsistent water atomization of
 $180~\text{W}~\text{cm}^{-2}$
reported in a previous study (Simon et al.
Reference Simon, Sapozhnikov, Khokhlova, Wang, Crum and Bailey2012). When water is exposed to
 $850~\text{W}~\text{cm}^{-2}$
(shown in figure 9), atomization is very dramatic at atmospheric pressure (
 $0.1~\text{MPa}$
) with many droplets released from a vaguely drop-chain-like fountain with diameters of less than
 $20~{\rm\mu}\text{m}$
(1 pixel) to
 $400~{\rm\mu}\text{m}$
and velocities up to
 $8~\text{m}~\text{s}^{-1}$
. Yet when the static pressure increases to
 $1.39~\text{MPa}$
, there is a significant reduction in the number of emitted droplets and the fountain drop-chain structure becomes more definite. Droplets are released at slower velocities ranging from 2 to
 $5~\text{m}~\text{s}^{-1}$
, with diameters ranging from 50 to
 $200~{\rm\mu}\text{m}$
. The drop-chain fountain remains as the static pressure increases to 2.41 and
 $3.45~\text{MPa}$
, with fewer droplets of similar size and velocity emitted as the pressure increases. Once the pressure reaches
 $6.89~\text{MPa}$
, no droplets are emitted. This trend continues as the pressure increases to 8.27 and
 $10.34~\text{MPa}$
. Interestingly, however, when the static pressure reaches
 $13.79~\text{MPa}$
, a few droplets are again emitted. These droplets range between 100 and
 $200~{\rm\mu}\text{m}$
in diameter and are emitted at even slower velocities of less than
 $2~\text{m}~\text{s}^{-1}$
.
Water atomization from the 2.127 MHz focused ultrasound transducer operating at
 $1200~\text{W}~\text{cm}^{-2}$
(
 $p_{+}=6.8,p_{-}=5.3~\text{MPa}$
) and recorded at 10 000 f.p.s. for a range of static pressure levels. At
 $0.1~\text{MPa}$
, atomization is dramatic, with droplet diameters ranging from less than 20 (1 pixel) up to
 $550~{\rm\mu}\text{m}$
in diameter and jet velocities reaching
 $11~\text{m}~\text{s}^{-1}$
. When the static pressure is increased to
 $1.38,2.41$
, or
 $3.45~\text{MPa}$
, atomized droplets are larger and released at slower velocities ranging up to
 $7.5~\text{m}~\text{s}^{-1}$
. When the static pressure is increased to 6.89 or
 $8.27~\text{MPa}$
, very few droplets are emitted in the 10 ms pulse (not shown); however when the static pressure is increased to 10.34 or
 $13.79~\text{MPa}$
, droplets of diameters between 100 and
 $400~{\rm\mu}\text{m}$
are released at velocities of
 $1{-}2~\text{m}~\text{s}^{-1}$
. Select static pressure levels are available in video format in supplementary movie 4.

When the acoustic intensity is increased to
 $1200~\text{W}~\text{cm}^{-2}$
(
 $p_{+}=6.8~\text{MPa},p_{-}=5.3~\text{MPa}$
), atomization is even more dramatic at atmospheric pressure with droplet diameters ranging from less than
 $20~{\rm\mu}\text{m}$
(1 pixel) to
 $550~{\rm\mu}\text{m}$
emitted at velocities up to
 $11~\text{m}~\text{s}^{-1}$
as shown in figure 10. As before, the drop-chain structure begins to become more defined at
 $1.38~\text{MPa}$
, and a few droplets of 40–
 $300~{\rm\mu}\text{m}$
in diameter are released from the drop chain at velocities up to
 $7.5~\text{m}~\text{s}^{-1}$
for each static pressure level up to
 $3.45~\text{MPa}$
; the number of emitted droplets decreases with increasing static pressure (to keep the timing similar between frames in the figure, not all pressure levels show the release of droplets). Even fewer droplets are released when the static pressure reaches 6.89 and
 $8.27~\text{MPa}$
; however, when the static pressure reaches 10.34 or
 $13.79~\text{MPa}$
, the number of emitted droplets increases. These droplets are uniformly large (between 100 and
 $400~{\rm\mu}\text{m}$
in diameter) and released at very slow velocities of
 $1{-}2~\text{m}~\text{s}^{-1}$
. When the static pressure is returned to atmospheric levels, atomization again proceeds very similarly to what was originally observed at atmospheric pressure (not shown).
4. Discussion
This paper presents a series of experimental results that show the key role of bubbles in the atomization of the drop-chain fountain. Moreover, in addition to the existing explanation of the bubbles’ role in atomization in the form of acoustic cavitation, the novel idea has been proposed that boiling is a viable mechanism contributing to atomization in the drop-chain fountain under some regimes.
When the ultrasonic frequency and liquid speed of sound were varied, it was found that, at least for transducers with an
 $F$
-number of one, the diameter of the drop-chain approximately equals the acoustic wavelength. This effect can be due to two reasons. First, the acoustic radiation force forms the hydrodynamic jet on the liquid surface, and thus this jet has a diameter that approximately coincides with the acoustic beam width, which is defined by the diffraction effect. The ultrasound intensity of a uniformly vibrating, curved (focused) source has the following distribution at the focal plane (O’Neil Reference O’Neil1949):
 $$\begin{eqnarray}I=I_{0}\left(\frac{2\text{J}_{1}({\it\xi})}{{\it\xi}}\right)^{2},\end{eqnarray}$$
where
 $I_{0}$
is the focal intensity,
 $\text{J}_{1}({\it\xi})$
is the Bessel function of the first kind,
 ${\it\xi}={\rm\pi}x/({\it\lambda}F)$
,
 $x$
is the transverse coordinate,
 ${\it\lambda}$
is the wavelength, and
 $F$
is the
 $F$
-number (ratio of the focal distance to the source diameter). From this, the beam diameter
 $D$
, as defined by the half-intensity level, can be approximately expressed as
 $D\approx 1.03{\it\lambda}F$
, i.e. for the experimental situation of the
 $F$
-number equal to one, the beam width coincides with the wavelength. As the drop chain is formed from the emitted fountain jet, each drop diameter is on the order of
 ${\it\lambda}$
. The second reason for the diameter of the drops to be very close to a wavelength is due to the fact that the acoustic radiation force enhancement (that is needed for the drop to be effectively pushed) happens when the acoustic energy density at the liquid surface is increased, i.e. the incident wave is effectively trapped by the up-going protuberance on the water surface. This occurs when the drop growing from that protuberance becomes an efficient acoustic absorber, which, in turn, happens when the resonance frequency of the drop becomes close to the incident wave frequency. A spherical standing wave inside a spherical drop is expressed as
 $$\begin{eqnarray}p=p_{0}\frac{\sin (2{\rm\pi}r/{\it\lambda})}{2{\rm\pi}r/{\it\lambda}},\end{eqnarray}$$
where
 $p_{0}$
is the acoustic pressure amplitude at the drop centre and
 $r$
is the distance from that centre. At the drop surface,
 $r=R$
, the acoustic pressure is released, which gives the condition for the possible resonance radii
 $R_{n}=n{\it\lambda}/2$
, where
 $n=1,2,\dots$
. From this, the lowest resonance corresponds to the drop diameter
 $d=2R_{1}$
which equals one wavelength.
Across the tested frequencies, a qualitative similarity in atomization was observed in that a distortion in the top drop was observed immediately before jets were emitted. These distortions appear similar to the chaotic oscillations that are often observed in vibrated bubbles shortly before jetting (Movassat Reference Movassat2012). In the 1.04 MHz atomization video (figure 4 a), it was noted that the top drop in the chain changes from transparent to opaque immediately before atomization, which would suggest that some sort of surface instability, such as capillary waves, contributes to atomization. However, observations by Shepherd (Reference Shepherd1981) of superheated butane drops showed similar changes in drop opacity immediately before the explosion occurred due to boiling. Moreover, in some cases (e.g. figure 5) drops remained transparent and an opacity within the drop, which we speculated were cavitation or boiling bubbles, preceded the explosion. Additionally, as the frequency decreased, the time to commence atomization increased, though the number of cycles to commence atomization was similar across the tested frequencies. This result suggests that atomization arises from a cumulative process such as capillary waves or boiling.
When water was exchanged for liquids with various shear viscosities, it was found that, in general, the atomization threshold increased with the shear viscosity, even when accounting for the differences in the absorption coefficients between liquids. This observation can be explained by the fact that the larger viscosity corresponds to higher absorption for the standing spherical wave, which reduces the acoustic pressure level in the centre of the drop and thus increases the cavitation threshold and reduces heating of the drop centre. On the other hand, shear viscosity also damps surface instabilities. When the water temperature was increased, the time to commence atomization decreased. While heating influences the surface tension, cavitation threshold, and time to boil, results from Crum (Reference Crum1979) show a strong effect of temperature on the cavitation threshold whereas the dependence of temperature on surface tension is very small. Thus, these temperature dependences, and the decrease in the time to commence atomization with increasing temperature, as well as the strong influence of shear viscosity on the atomization threshold, suggest that bubbles, either through acoustic cavitation or boiling, play a greater role than capillary waves in the atomization of the drop-chain fountain.
Note that liquid viscosity and surface tension influence not only atomization, but also the formation of the drop-chain fountain, which can be considered a result of fountain or jet instability. Tomotika (Reference Tomotika1935, Reference Tomotika1936) has shown that an incompressible cylindrical jet becomes unstable at a characteristic time
 ${\it\tau}$
that is related to the jet diameter
 $D$
and the liquid parameters as
 ${\it\tau}\approx D{\it\rho}_{0}{\it\eta}/{\it\sigma}$
, where
 ${\it\rho}_{0}$
is the density,
 ${\it\eta}$
is the coefficient of shear viscosity, and
 ${\it\sigma}$
is the surface tension of the liquid. Although this relationship was obtained for a different type of jet, it can be used to understand the influence of viscosity and surface tension on how rapidly the jet is broken into a drop-chain fountain. From the parameters given in table 1, it follows that the most unstable (smallest
 ${\it\tau}$
) is the water jet, with the slowest instability being developed in castor oil (approximately 2200 times slower). The latter fact could explain why drop formation was never observed in the castor oil fountain.
The final study, where atomization was explored in an overpressure chamber, was designed to isolate surface instabilities from bubbles in atomization. In the overpressure experiments, the initial results showed that atomization was reduced or completely suppressed as the static pressure increased, leading to the conclusion that bubbles cause atomization in the drop-chain fountain. However when the static pressure was increased even further, droplets were again released from the drop-chain fountain. While supporting that suppression of bubbles has a significant effect, it is counterintuitive that at higher static pressures atomization (in a diminished state) returns. One possible explanation is in the drop-chain structure. At
 $13.79~\text{MPa}$
, the drop chain is less consistent in definition; at times, the fountain sides appear smooth and droplets are released when the fountain transitions between smooth and drop-chain sides, perhaps in a breathing-mode ejection of fluid mass. These transitions in and out of the drop-chain structure could be due to the difference in the interactions between reflected waves and incoming waves within the water column caused by the changes in the speed of sound of water or changes in the acoustic impedance of air. At
 $13.79~\text{MPa}$
, according to Medwin (Reference Medwin1975) only a slight increase in the speed of sound of approximately
 $62~\text{m}~\text{s}^{-1}$
would be expected. However, there is also an increase in the characteristic impedance in air of approximately 56 kRayleighs at
 $13.79~\text{MPa}$
compared to atmospheric pressure. The increases in the impedance of both air and water when the static pressure is
 $13.79~\text{MPa}$
cause an increase in the intensity transmission and reflection coefficients on the order of 100; at
 $13.79~\text{MPa}$
, the intensity transmission coefficient (normal incidence) is 0.14 as compared to 0.001 at atmospheric pressure. The intensity transmission coefficient shows how efficiently acoustic energy is leaving the water surface or the drops in the chain. It is possible that the changes in the impedances with increasing static pressure influence the wave interactions in such a way that causes the droplets to be released at
 $13.79~\text{MPa}$
when atomization had completely ceased at
 $6.89~\text{MPa}$
. Modelling of the acoustic wave in the fountain could help explain this phenomenon.
In the observed phenomenon of atomization, it is hard to separate the effect of acoustically driven gas bubbles (acoustic cavitation) from thermally driven vapour bubbles (boiling). Indeed, both types of bubbles are affected by the static pressure and temperature changes in a similar way. The possible role of acoustic cavitation was proposed earlier (Sollner Reference Sollner1936; Rozenberg & Eknadiosyants Reference Rozenberg and Eknadiosyants1960; Gershenzon & Eknadiosyants Reference Gershenzon and Eknadiosyants1964; Il’in & Eknadiosyants Reference Il’in and Eknadiosyants1967, Reference Il’in and Eknadiosyants1969); however, in the wide range of acoustic parameters (frequency and intensity), types of liquids, and ambient conditions (static pressure and temperature) that were used, indications of the appearance of boiling have been observed. Bear in mind that boiling in a superheated drop, if it happens, should have the form of an explosion. Observations of thin jets that are sometimes emitted from the drop surface (see e.g. photos in figures 4, 5 and 8) are more likely to be due to the explosion of a vapour bubble in the superheated part of the drop, supposedly near the drop centre.
Note that the drops in the chain could be fairly efficient energy concentrators, because the acoustic wave that penetrates into a drop through a thin waist on its bottom is effectively trapped inside the drop. For instance, consider a case that corresponds to figure 4(a). Suppose that the acoustic intensity of
 $I=245~\text{W}~\text{cm}^{-2}$
is acting on the acoustic fountain consisting of two drops at
 ${\it\tau}=4$
ms. The corresponding amount of acoustic energy that is trapped by the drops can be estimated as
 $I{\it\tau}{\rm\pi}d^{2}/4$
, where
 $d=1.5~\text{mm}$
, the drop diameter. Supposing this energy is evenly divided between two drops (see figure 4
a), the energy trapped in the upper drop can be estimated as
 $E=0.01$
J. In reality, some amount of energy of the focused ultrasound beam will be reflected back towards the transducer, but this should not change the estimate too much. The acoustic pressure amplitude inside the drop is distributed according to (4.2). It can be shown that the total acoustic energy of a drop of one wavelength diameter and the pressure amplitude at its centre are related by the following expression:
 $$\begin{eqnarray}E\approx \frac{d^{3}}{8{\rm\pi}}\frac{p_{0}^{2}}{{\it\rho}_{0}c_{0}^{2}},\end{eqnarray}$$
where
 ${\it\rho}_{0}$
is the liquid density, and
 $c_{0}$
is the sound velocity. From this it follows that for a drop of water,
 $E=0.01$
J corresponds to
 $p_{0}\approx 400~\text{MPa}$
. Even if the estimated value for the drop energy is significantly reduced, the predicted maximum pressure is still very high: for
 $E=0.001$
J, it is
 $130~\text{MPa}$
, and for even smaller energy
 $E=0.0001$
J, it is
 $40~\text{MPa}$
. This indicates that the acoustic pressure in the centre of the drop could be so high that the acoustic cavitation threshold could be easily reached.
At such high pressures, boiling can also be achieved. If the temperature were uniform inside the drop, it would be increased by
 $$\begin{eqnarray}{\rm\Delta}T=\frac{E}{{\it\rho}_{0}c_{p}V},\end{eqnarray}$$
where
 ${\it\rho}_{0}=1000~\text{kg m}^{-3}$
is the density of water,
 $c_{p}=4200~\text{J}~\text{kg}^{-1}~\text{K}^{-1}$
is the specific heat, and
 $V={\rm\pi}d^{3}/6$
is the drop volume. The estimate gives
 ${\rm\Delta}T\approx 1.3$
K which is much below the increase needed for boiling. Therefore, the uniformly heated drop would not reach boiling temperature. This was confirmed in an additional experiment (not presented here) with a high-speed infrared camera that showed that the drop surface was indeed not heated by more than 1 K. However, the above assumption of uniform temperature distribution is too simplified. Even in the linear regime, the drop is heated by a standing wave (4.2), i.e. non-uniformly. At
 $100~\text{MPa}$
pressure levels, the standing wave inside the drop behaves nonlinearly and thus is being more efficiently absorbed in the central part of the drop, especially if shock fronts are generated in the pressure waveform. Theoretical analysis accounting for medium nonlinearity is needed to calculate the corresponding drop heating: this challenging task is outside the scope of the current study.
Atomization in a drop-chain fountain has been of interest since atomization was first discovered in 1927. In this paper, it is shown: that the ultrasound excitation frequency and liquid speed of sound affect the drop-chain diameter; the time to commence atomization decreases when the temperature increases; the threshold for atomization increases with shear viscosity; and atomization is significantly diminished by overpressure. A limitation of this study was that no test changed only one mechanism of interest. For example, changing the shear viscosity also changed the surface tension and increasing the water temperature influenced the boiling, acoustic cavitation, and surface wave mechanisms. Nevertheless, these results show the key role of bubbles in the atomization of the drop-chain fountain, and experimental observations and calculations suggest that these bubbles could arise from acoustic cavitation or boiling. More research and extensive modelling may be able to further elucidate the origin of the bubbles, although it is possible that atomization in the drop-chain fountain is complex enough to be caused by a combination of acoustic cavitation, boiling, and even surface instabilities, depending on the exact geometry and physical properties of the chain.
Acknowledgements
This work was supported by the National Institute of Health (DK043881 and EB007643), the Russian Foundation for Basic Research (13-02-00183 and 14-02-00426), and the National Space Biomedical Research Institute in consortium agreement with the National Aeronautics and Space Administration NCC 9-58. The authors gratefully acknowledge the help of Dr T. Khokhlova and Dr W. Kreider for fruitful discussions and B. MacConaghy for building and testing the overpressure chamber. The authors also wish to thank the staff and researchers at the Center for Industrial and Medical Ultrasound (CIMU).
Supplementary movies
Supplementary movies are available at http://dx.doi.org/10.1017/jfm.2015.11.