1. Introduction
The Dağdibi Pluton is located in the eastern part of the Sakarya Zone, Turkey, a crustal segment lying in the middle parts of the Alpine-Himalayan Orogenic Belt. Although the igneous rocks with ages varying from Carboniferous to Miocene are found in the eastern Sakarya Zone, those formed in the time interval from the Late Cretaceous to the end of Eocene are very common (Sipahi, Reference Sipahi2005, Reference Sipahi2017, Reference Sipahi2019; Arslan & Aslan, Reference Arslan and Aslan2006; Boztuğ et al. Reference Boztuğ, Jonckheere, Wagner, Erçin and Yeğingil2007; Kaygusuz et al. Reference Kaygusuz, Arslan, Wolfgang, Sipahi and İlbeyli2012, Reference Kaygusuz, Yücel, Arslan, Sipahi, Temizel, Çakmak and Güloğlu2018, Reference Kaygusuz, Yücel, Arslan, Temizel, Yi, Jeong, Siebel and Sipahi2020; Temizel et al. Reference Temizel, Arslan, Ruffet and Peucat2012; Aydınçakır, Reference Aydınçakır2014; Sipahi & Sadıklar, Reference Sipahi and Sadıklar2014; Gücer et al. Reference Gücer, Aydınçakır, Yücel and Akaryalı2017; Dokuz et al. Reference Dokuz, Aydin and Karslı2019; Sipahi et al. Reference Sipahi, Gücer and Sadıklar2020a, Reference Sipahi, Gücer and Saydam Eker2020b, Reference Sipahi, Saydam Eker, Akpınar, Gücer, Vural, Kaygusuz and Aydurmuş2022; Gücer, Reference Gücer2021). Particularly the eastern part of the Sakarya Zone is therefore regarded as a paleo-magmatic arc and a natural laboratory to study the tectonic and petrogenetic processes that occurred through the time interval from the final stages of subduction to post-collision. Geochemical data are widely used to discriminate the tectonic settings of igneous rocks during their formation. However, magmas formed during active subduction and collision can bear similar geochemical compositions because their trace element budgets are closely related to their abundance in protolith (e.g., Roberts & Clemens Reference Roberts and Clemens1993; Dokuz et al. Reference Dokuz, Aydin and Karslı2019). Thus, additional data from other disciplines, such as structural geology, stratigraphy and sedimentology, are needed to arrive at a realistic tectonic setting for magmatic rocks.
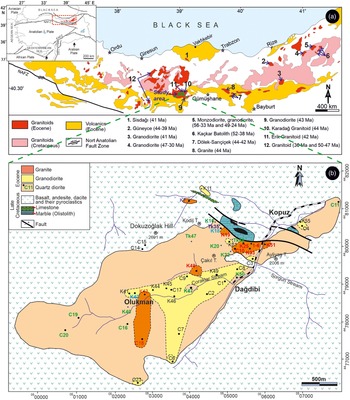
Although there are plenty of studies on the Eocene igneous rocks in the eastern Sakarya Zone (Fig. 1a), the cause of the Eocene magmatism is still not fully understood. Late Cretaceous subduction-related magmatism was followed, after a magmatic stagnation of ∼10–12 Ma, by a short-lived adakitic magmatism that occurred in a time span from 56 to 50 Ma with a peak at around 52–50 Ma (Karslı et al. Reference Karslı, Dokuz, Uysal, Aydin, Kandemir and Wijbrans2010; Eyüboğlu et al. Reference Eyüboğlu, Santosh and Chung2011; Dokuz et al. Reference Dokuz, Uysal, Siebel, Turan, Duncan and Akcay2013; Gücer, Reference Gücer2021) and then a non-adakitic magmatism varying in age from 50 to 38 Ma (Boztuğ et al. Reference Boztuğ, Jonckheere, Wagner and Yeğingil2004; Arslan & Aslan, Reference Arslan and Aslan2006; Karslı et al. Reference Karslı, Dokuz, Uysal, Ketenci, Chen and Kandemir2012; Eyüboğlu et al. Reference Eyüboğlu, Dudas, Thorkelson, Zhu, Liu, Chatterjee, Yi and Santosh2017; Sipahi et al. Reference Sipahi, Akpınar, Saydam Eker, Kaygusuz, Vural and Yılmaz2017; Kaygusuz et al. Reference Kaygusuz, Yücel, Arslan, Sipahi, Temizel, Çakmak and Güloğlu2018; Dokuz et al. Reference Dokuz, Aydin and Karslı2019; Sipahi et al. Reference Sipahi, Saydam Eker, Akpınar, Gücer, Vural, Kaygusuz and Aydurmuş2022).
(a) Distributions of the plutonic rocks of Late Cretaceous and Eocene ages in the eastern part of the Sakarya Zone and (b) Geological map of the Dağdibi Pluton and surrounding area. 1: Karslı et al. (Reference Karslı, Dokuz, Uysal, Ketenci, Chen and Kandemir2012); 2: Taner (Reference Taner1977); 3: Moore et al. (Reference Moore, Mckee and Akıncı1980); 4: Çınar (1975); 5: Delaloye et al. (Reference Delaloye, Çoğulu and Chessex1972); 6: Boztuğ et al. (Reference Boztuğ, Jonckheere, Wagner, Erçin and Yeğingil2007); 7: Karslı et al. (Reference Karslı, Chen, Aydin and Şen2007); 8: Arslan & Aslan (Reference Arslan and Aslan2006); 9: JICA (1986); 10: Sipahi et al. (Reference Sipahi, Saydam Eker, Akpınar, Gücer, Vural, Kaygusuz and Aydurmuş2022); 11: Sipahi et al. (Reference Sipahi, Akpınar, Saydam Eker, Kaygusuz, Vural and Yılmaz2017); 12: Boztuğ et al. (Reference Boztuğ, Jonckheere, Wagner and Yeğingil2004).

The Dağdibi Pluton is one of the members of the middle Eocene non-adakitic plutons. We present U–Pb zircon geochronology, whole-rock geochemistry, Sr–Nd–Pb isotopes and microprobe data to contribute to our understanding of petrogenetic and geodynamic processes acted during the middle Eocene magmatism.
2. Geological setting
Basement rocks of the Sakarya Zone are represented by early Carboniferous metamorphic rocks (Topuz et al. Reference Topuz, Altherr, Schwarz, Dokuz and Meyer2007; Dokuz et al. Reference Dokuz, Gücer, Karslı and Yi2022), and middle to late Carboniferous granitic (Dokuz, Reference Dokuz2011; Kaygusuz et al. Reference Kaygusuz, Arslan, Wolfgang, Sipahi and İlbeyli2012) and rhyolitic rocks (Dokuz et al. Reference Dokuz, Külekçi, Aydınçakır, Kandemir, Alçiçek, Pecha and Sünnetçi2017a). The basement metamorphic and rhyolitic rocks are unconformably overlain by the upper Carboniferous sedimentary rocks (Okay & Leven, Reference Okay and Leven1996; Dokuz et al. Reference Dokuz, Alçiçek, Tunçdemir, Kandemir and Aydınçakır2023). Late Permian and Triassic rocks, which are common as allochthonous blocks within the accretionary complexes of the central and western Sakarya Zone, are absent in the eastern Sakarya Zone. The time period from the Late Triassic to Early Jurassic is regarded as the birth of the Neotethys Ocean behind the ribbon-shaped Cimmerian Continent, which was separated from the northern margin of Gondwana during the closure of the Paleotethys Ocean (Şengör & Yılmaz, Reference Şengör and Yılmaz1981; Dokuz & Sünnetçi, Reference Dokuz and Sünnetçi2019). The Early Jurassic is represented by sedimentary and basic volcanic rocks that lie unconformably over the Variscan basement (Dokuz & Tanyolu, Reference Dokuz and Tanyolu2006) and some basic to intermediate plutonic rocks (Dokuz et al. Reference Dokuz, Tanyolu and Genç2006; Eyüboğlu et al. Reference Eyüboğlu, Dudas, Santosh, Zhuc, Yi, Chatterjee, Jeong, Akaryalı and Liuc2016; Karslı et al. Reference Karslı, Dokuz and Kandemir2017). The Late Jurassic-Early Cretaceous period is characterized by platform-type carbonates and few magmatic rocks (Dokuz et al. Reference Dokuz, Aydınçakır, Kandemir, Karslı, Siebel, Derman and Turan2017b).
The sedimentary rocks deposited in the Late Cretaceous in the eastern Sakarya Zone show distinct facies differences from north to south related to the northward subduction of the Neotethyan oceanic lithosphere (Yılmaz & Boztuğ, Reference Yılmaz and Boztuğ1996; Şengör et al. Reference Şengör, Özeren, Genç and Zor2003; Sipahi & Sadıklar, Reference Sipahi and Sadıklar2014; Kandemir et al. Reference Kandemir, Akbayram, Çobankaya, Kanar, Pehlivan, Tok, Hakyemez, Ekmekçi, Danacı and Temiz2019). A sedimentary succession in the fore-arc side to the south temporally corresponds to at least four different volcano-sedimentary units in the back-arc side to the north (Aydin et al. Reference Aydın, Oğuz Saka, Şen, Dokuz, Aiglsperger, Uysal, Kandemir, Karslı, Sarı and Başer2020; Oğuz-Saka et al. Reference Oğuz-Saka, Aydin, Karsli, Dokuz, Aiglsperger, Miggins, Şen, Kandemir, Sarı and Koppers2023). Upper Cretaceous granitic rocks are dominated in the inner-arc environment of the eastern Sakarya Zone (Yılmaz & Boztuğ, Reference Yılmaz and Boztuğ1996; Şengör et al. Reference Şengör, Özeren, Genç and Zor2003; Sipahi et al. Reference Sipahi, Kaygusuz, Saydam Eker, Vural and Akpınar2018a).
Adakitic rocks emplaced approximately 10–12 Ma after the collision of the Anatolides with Sakarya Zone are a single rock-record formed in the late Palaeocene to early Eocene period (Topuz et al. Reference Topuz, Altherr, Schwarz, Siebel, Satir and Dokuz2005; Eyüboğlu et al. Reference Eyüboğlu, Santosh and Chung2011; Dokuz et al. Reference Dokuz, Uysal, Siebel, Turan, Duncan and Akcay2013). Non-adakitic magmatic rocks began to form in the region almost coevally with the final stage of the adakitic rocks (Aydınçakır, Reference Aydınçakır2014) and continued to middle Eocene (Arslan et al. Reference Arslan, Temizel, Abdioğlu, Kolaylı, Yücel, Boztuğ and Şen2013). The middle Eocene units in the eastern Sakarya Zone crop out in east-west trending semi-isolated areas and are represented mainly by volcano-sedimentary rocks. Basalt, andesite and lesser trachytes with a predominantly calc-alkaline to some alkaline geochemical tendencies are the dominant rock types (Arslan and Aslan, Reference Arslan and Aslan2006; Temizel et al. Reference Temizel, Arslan, Ruffet and Peucat2012; Göçmengil et al. Reference Göçmengil, Karacık, Genç and Billor2018). The Eocene plutonic rocks with a compositional range from gabbro to granite are more common in the central to northern parts of the eastern Sakarya Zone and offer similar geochemical characteristics with those of the extrusive rocks (Eyüboğlu et al. Reference Eyüboğlu, Dudas, Santosh, Zhuc, Yi, Chatterjee, Jeong, Akaryalı and Liuc2016, Reference Eyüboğlu, Dudas, Thorkelson, Zhu, Liu, Chatterjee, Yi and Santosh2017; Dokuz et al. Reference Dokuz, Aydin and Karslı2019; Sipahi et al. Reference Sipahi, Saydam Eker, Akpınar, Gücer, Vural, Kaygusuz and Aydurmuş2022).
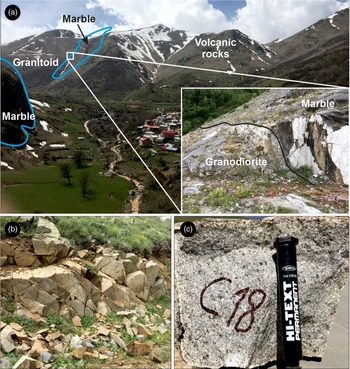
The Dağdibi Pluton intruded into the Upper Cretaceous volcanic and sedimentary rocks. The volcanic rocks comprise basalt, andesite, dacite and associated pyroclastic rocks (Figs. 1b and 2). Sedimentary rocks consist of grey sandy limestone and limestone. The Upper Cretaceous limestone includes olistoliths of the Upper Jurassic-Early Cretaceous low-grade contact metamorphic limestone. The Dağdibi Pluton, which is the youngest unit of the study area, cuts all the older units (Figs. 1b and 2a) and crops out in an area of about 12 km2 with an oval shape extending in southwest–northeast directions (Fig. 1b). The pluton contains mafic microgranular enclaves ranging in size from 0.5 to 5 cm. They are angular in shape and darker in colour and have finer-grained texture than their host pluton. A skarn zone was developed at the limestone contact of the pluton in the eastern boundary. Along this contact, the limestone was transformed into marble and in places recrystallized.
Field, outcrop and hand-sample photos of the studied pluton. (a) Contact between granodiorite, marble and volcanic rocks (C3, K-21), (b) Diorite (C8B) and (c) Hand-sample of granite.

3. Analytical methods
U–Pb Ages: The U–Pb zircon geochronology of the selected samples was performed at the Korea Basic Science Institute Laboratory (South Korea). Cathodoluminescence (CL) images were taken to determine the points to be analyzed on the zircon grains and to control the internal structures of zircon grains. Zircon U–Th–Pb isotopes were measured using SHRIMP (Sensitive High-Resolution Ion Microprobe) IIe/MC at the Korea Basic Science Institute. A 2–4 nA mass-filtered O2 primary beam was focussed on an elliptical spot with a diameter of 20 × 25 μm with a 120 μ Kohler aperture on the polished surface of the zircon with an accelerating voltage of 10 kV. Each spot was scanned with a primary beam for 2–3 min prior to analysis and then analyzed with a single electron multiplier for five cycles. FC1 (1099 Ma; Paces & Miller, Reference Paces and Miller1993) and SL13 (U = 238 ppm) standard zircons were used for Pb/U calibration and U abundances, respectively. Th/U ratios were calculated using a fractionation factor derived from 232Th16O+/238U16O+ measured against 208Pb/206Pb of the SL13 standard, while Pb/U ratios were calibrated against FC1 using the power law relationship between Pb+/U+ and UO+/U+. Common Pb was removed by the correction method of 207Pb (<1000 Ma for dates) or 204Pb (>1000 Ma for dates) using the model of Stacey & Kramers (Reference Stacey and Kramers1975). Data processing was carried out using SQUID 2.50 and Isoplot 4.15 programs running under Excel® (Ludwig, Reference Ludwig2012). Zircons with high U concentrations (>2500 ppm) were corrected using the algorithm of Williams & Hergt (Reference Williams, Hergt, Woodhead, Hergt and Noble2000).
Whole Rock Geochemistry: Representative samples were selected for major, trace, and rare earth element (REE) analyses at the commercial ACME Laboratories, Ltd., Vancouver, Canada. Major elements were measured with inductively coupled plasma–atomic emission spectrometry after fusion with LiBO2. The 0.2 g of powder sample and 1.5 g of LiBO2 flux were mixed in a graphite crucible and subsequently heated to 1050°C for 15 min for trace elements and REE analyses. ICP-AES was used to measure major oxide elements and ICP-MS to measure trace and REEs.
Mineral Chemistry: Microprobe analyses were made on five samples from the studied pluton at the Geology and Mineral Research Laboratory of the New Mexico Institute of Mining and Technology, USA. Plagioclase, K-feldspar, biotite, amphibole, pyroxene and Fe-Ti oxide minerals were analyzed using a CAMECA-SX 100 brand microprobe-3 wavelength dispersive (WD) spectrometry device. The device worked with the 15 kV voltage and 20 nA.
Sr, Nd, Pb isotopes Analysis: Rb–Sr, Sm–Nd, and Pb–Pb isotope geochemistry analyzes of five samples were performed with Thermal Ionization Mass Spectrometry (TIMS) Laboratory at New Mexico State University (USA). Isotopic measurements were made by TIMS on a VG Sector 30 mass spectrometer. Samples analyzed were loaded on rhenium layers either on monofilament Cathodian beads only or on the sidewall of the triple filament junction. The repeatability of the 87Rb/86Sr and 147Sm/144Nd ratios is within 0.3% and the 87Sr/86Sr and 143Nd/144Nd ratios are within ±0.0000025 and ±0.00003, respectively. An analysis of the NBS 987 standard yielded values of 0.710226 (11), 0.710213 (13), 0.710219 (10), and 0.710260 (11). Pb samples were analyzed using the middle filament position of a set of Cathode beads. The samples were loaded in a matrix of silica gel and phosphoric acid and using 5% HNO3. Approximately 2 µL of silica gel was placed on the filament and 1 µL of phosphoric acid was added. Standards were also loaded and analyzed using the same procedures. The average of standard treatments was determined as 206Pb/204Pb = 16.844, 207Pb/204Pb = 15.379 and 208Pb/204Pb = 36.199. The deviations from the standards are within 0.2%. Ramos (Reference Ramos1992) provided detailed analytical procedures for isotopic measurements of Sr and Nd.
Lu–Hf isotope Analysis: Lu–Hf isotope analysis on single zircons of the pluton was made using a LA-MC-ICPMS with Nu Plasma II, Nu instruments + New Wave Research 193 nm ArF, ESI at the Korea Basic Science Institute (KBSI). Instrument parameters include a spot size 50 µm, a 10 Hz repetition rate, and energy density of 6–8 J/cm2, dwell time 60 s for Hf isotope analysis of zircon. The interference of 176Lu and 176Yb on the 176Hf signal was corrected by using Chu et al. (Reference Chu, Taylor, Chavagnac, Nesbitt, Boella and Milton2002) and Vervoort et al. (Reference Vervoort, Patchett, Söderlund and Baker2004), respectively. Mass bias of measured Hf isotopic ratios was corrected to 179Hf/177Hf = 0.7325, using an exponential correction law (Russel et al. Reference Russel, Papanastassiou and Tombrello1978; Patchett et al. Reference Patchett, Kuovo, Hedge and Tatsumoto1981). The 176Lu/177Hf and 176Yb/177Hf ratios were calculated after Iizuka & Hirata (Reference Iizuka and Hirata2005). Data reduction was carried out using Iolite 2.5 running within Igor Pro 6.3.5.5 software program (Paton et al. Reference Paton, Hellstrom, Paul, Woodhead and Hergt2011). All ratios were calculated with 2σ errors. During the sample analysis, to evaluate the precision and accuracy of 176Hf/177Hf ratios, two reference zircons 91500 (0.282297; Griffin et al. Reference Griffin, Pearson, Belousova, Jackson, van Achtersergh, O’Reilly and Shee2000) and Plešovice (0.282482; Sláma et al. Reference Sláma, Košler, Condon, Crowley, Gerdes, Hanchar, Horstwood, Morris, Nasdala, Norberg, Schaltegger, Schoene, Tubrett and Whitehouse2008) were repeatedly analyzed at the beginning and end of each analytical session, and at regular intervals during session.
4. Results
4.a. Petrography
The contacts of the Dağdibi Pluton are discordant with surrounding rocks (Fig. 2). Fe skarn mineralization was developed between the pluton and limestone–andesite contact in the Kopuz area (Sipahi et al. Reference Sipahi, Saydam Eker, Kaygusuz and Vural2018b).
The Dağdibi Pluton consists, in decreasing order of abundance, of quartz diorite, granodiorite and granite with a zonal structure. The granodiorite and granite are located in the central portions of the pluton (see Fig. 1b). The rocks of the pluton show medium-grained, monzonitic, poikilitic and micrographic textures. Orthoclase, plagioclase (An16–40), quartz, biotite, hornblende and augite are the major mineral phases found in the rocks, and zircon and apatite are the accessory minerals. Sericite, chlorite, epidote and clay minerals are found as secondary phases.
The quartz diorite samples include, in decreasing order of abundance, plagioclase, hornblende, quartz, orthoclase, biotite and opaque minerals (Table S1; Fig. 3). Biotite is added to above mentioned major phases in the granodiorites. The granite has quartz, orthoclase, plagioclase, hornblende, biotite and opaque minerals (Table S1; Fig. 3).
QAP diagram (modified from Streckeisen, Reference Streckeisen1976) for the modally analyzed samples of the pluton.

Hornblende is in euhedral and subhedral forms. Some of them show twinning and some others are slightly chloritized. Plagioclase has euhedral and subhedral forms and is slightly sericitized and partially fractured. It shows albite twinning and commonly presents ring zoning with sieve texture. Orthoclase occurs in the form of subhedral small crystals and shows in places Carlsbad twinning. Poikilitic and perthitic textures are observed in some orthoclase crystals. Small hornblende, plagioclase and opaque mineral inclusions are observed in areas where poikilitic texture is found. Orthoclase has altered into clay and sericite. Myrmekitic texture is seen between orthoclase and plagioclase. Quartz is found as large and small anhedral crystals. Quartz with subhedral orthoclase fills the gaps between the other minerals. Wavy extinction is observed in some quartz crystals. Biotite is in the form of euhedral to subhedral crystals and slightly altered into chlorite. Opaque minerals consist of magnetite and pyrite.
4.b. Mineral chemistry
The chemical compositions of the plagioclase, K-feldspar, amphibole, biotite and magnetite from the samples of the pluton are given in supplementary Table S2.
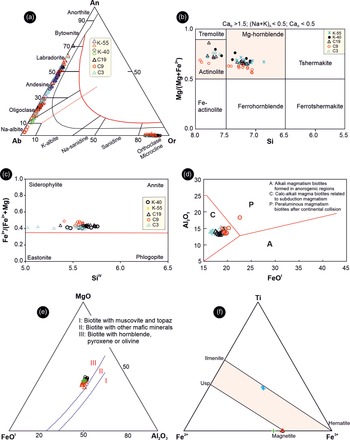
Plagioclase: Compositional zoning is, more or less, a ubiquitous feature of the plagioclases from the pluton. It is indicated by the variation of anorthite (An) end-member from 10.25 in the rim to 61.95 in the core (Fig. 4a). As shown by An–Ab–Or classification diagram (Smith & Brown, Reference Smith and Brown1988), rim composition of the plagioclases is largely oligoclase and anorthite increase towards the core of the plagioclases generally reaches up to andesine and, to a very lesser extent, labradorite composition (Fig. 4a).
(a) The An–Ab–Or classification diagram for the feldspars of the pluton (modified from Smith & Brown, Reference Smith and Brown1988; data of K-55 and K-40 from Sipahi et al. Reference Sipahi, Saydam Eker, Kaygusuz and Vural2018b). (b) Classification of amphiboles from the pluton (modified from Leake et al. Reference Leake, Wooley, Arps, Birch, Gilbert, Grice, Hawthorne, Kato, Kisch, Krivovichev, Linthout, Laird, Mandarino, Maresch, Nickhel, Rock, Schumacher, Smith, Stephenson, Ungaretti, Whittaker and Youzhi1997; data of K-55 and K-40 from Sipahi et al. Reference Sipahi, Saydam Eker, Kaygusuz and Vural2018b). (c) Si vs Fe2+/(Fe2++Mg) diagram for biotites. (d) Al2O3-FeO(t) for biotites (symbols are same as Fig. 4c). (e) MgO–FeO(t) –Al2O3 diagram for biotite (modified from Speer, Reference Speer1987; symbols are same as Fig. 4c). (f) Ti–Fe2+–Fe3+ diagram for magnetite and ilmenite minerals (modified from Bacon & Hirschmann, Reference Bacon and Hirschmann1988).

Orthoclase: In contrast to plagioclase, SiO2 content of orthoclase does not display a large variation. A similar situation is valid for the Al2O3 and K2O contents as well. All these show the absence of an important compositional zoning in orthoclase (Fig. 4a). The Or end-member of the orthoclase varies from Or93 in the cores to Or83 in the rims (Table S2).
Hornblende: Amphiboles display calcic composition (Ca+Na>1; 0>Na<0.5;) and plots in Mg-hornblende and actinolite fields in the amphibole classification diagram of Leake et al. (Reference Leake, Wooley, Arps, Birch, Gilbert, Grice, Hawthorne, Kato, Kisch, Krivovichev, Linthout, Laird, Mandarino, Maresch, Nickhel, Rock, Schumacher, Smith, Stephenson, Ungaretti, Whittaker and Youzhi1997) (Fig. 4b). The rims of amphiboles show actinolite composition. Si and Alt contents of hornblende increase together. The MnO and TiO2 contents of hornblende vary from 0.27 to 1.08 wt% and 0.10 to 2.03 wt%, respectively, and Mg/(Mg+Fe2+) ratios between 0.56 and 0.76. Hornblende generally contains low F (0.19 to 0.55 wt%) and Cl (0.02 to 0.29 wt%), indicating that there is no volatile enrichment during its formation.
Biotite: Fe+2/(Fe+2+Mg) and Mg/(Mg+Fe2+) ratios of biotite are between 0.39 and 0.49, and 0.51 and 0.61, respectively. Biotite is the product of solid solution series between phlogopite and annite end-members and has 60% phlogopite and 40% annite that is slightly closer to the magnesium-rich phlogopite end (Fig. 4c).
Magnetite-ilmenite: Magnetite contains 0.06 to 0.34 wt% of TiO2 and 91.42 to 93.27 wt% of FeOt, and same major oxide contents in ilmenite vary from 46.97 to 48.27 wt% and 45.44 to 48.04 wt%, respectively (Table S2). Magnetite is the product of ulvospinel-magnetite solid melt, and mostly has compositions close to the magnetite end (Fig. 4f). Ilmenite is located between ilmenite and hematite.
4.c. U–Pb zircon geochronology
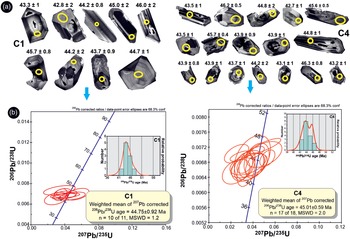
In order to determine the timing of magma emplacement and constrain its crystallization age, U–Pb zircon SHRIMP dating was performed on two granodiorite samples (Tables S3). Zircons are generally small to moderate crystals varying in size between 70 and 310 μm (Fig. 5a). They are commonly elongated grains, mostly euhedral to subhedral in shape and partly fractured. The compositional zoning is a common feature of the zircon grains, indicating that zircon minerals are of magmatic origin. Xenocrystic core is rarely observed. Zircon grains from the sample C1 have Th/U ratios in the range of 0.57 to 1.29 (Table S3). The minimum 206Pb/238U (1σ) age is 42.7 ± 1 Ma and the highest 206Pb/238U (1σ) age is 48.0 ± 2 Ma (Fig. 5a and b). The weighted average (concordia) age is 44.75 ± 0.92 Ma (MSWD = 1.2) for the sample C1 and 45.01 ± 0.59 Ma (MSWD = 2.0) for the sample C4, which correspond to the Lutetian (Eocene) and is interpreted as the intrusion age of the pluton (Fig. 5b).
Selected zircon crystals from the granodiorite samples C1 and C4. (a) cathodoluminescence (CL) images of zircon crystals and the location of analyzed spots and (b) 206Pb/238U–207Pb/235U Wetherill Concordia diagrams with insets of probability distribution-age diagrams.

4.d. Geochemistry
4.d.1. Major, trace and REEs
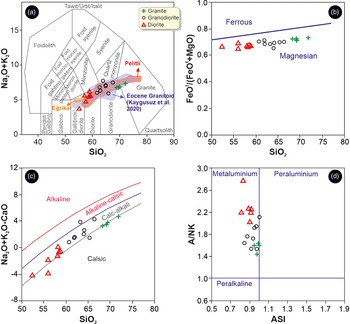
Geochemical compositions of the analyzed samples are presented in supplementary Table S4. Similar to the distribution shown in the modal QAP diagram, the samples have a wide compositional range from diorite to granite in the classification diagram of Middlemost (Reference Middlemost1994) (Fig. 6a). Samples fall in the field of rocks with magnesian affinity in the diagram of Frost et al. (Reference Frost, Barnes, Collins, Arculus, Ellis and Frost2001).
Chemical classification diagrams. (a) SiO2 vs Na2O+K2O diagram (Middlemost et al. 1985), (b) SiO2 vs (FeOt/FeOt+MgO), c) SiO2 vs (Na2O+K2O+CaO) and d) ASI vs A/NK diagram (Frost et al. Reference Frost, Barnes, Collins, Arculus, Ellis and Frost2001).

The samples with ASI [molar Al2O3/(CaO+Na2O+K2O)] values lower than 1 are metaluminous in character (Fig. 6d). They present a high K calc-alkaline composition in the K2O-SiO2 diagram (Le Maitre, Reference Le Maitre1989).
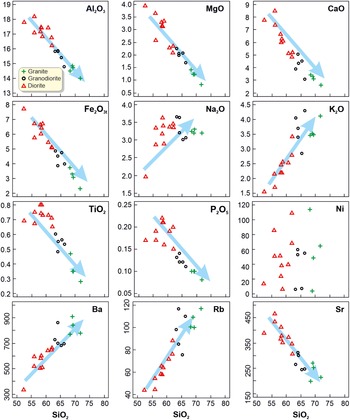
Major oxides and some trace elements versus SiO2 diagrams show almost linear covariations (Fig. 7), suggesting that fractional crystallization (FC) is an effective tool in the development of compositional range in the pluton. Negative correlations of CaO, MgO, Al2O3, Fe2O3t, TiO2 and P2O5 against SiO2 are distinct, whereas K2O and Na2O display positive relationships. Trace elements, except for Sr, also generally show an obvious positive correlation against SiO2. The scattered distribution observed in Ni may be partially related to weathering, contamination or magma mixture.
SiO2 content of pluton versus CaO, MgO, Al2O3, Fe2O3 t, TiO2, Na2O, K2O and P2O5. and trace (Ba, Rb, Sr and Ni) element contents distributions.

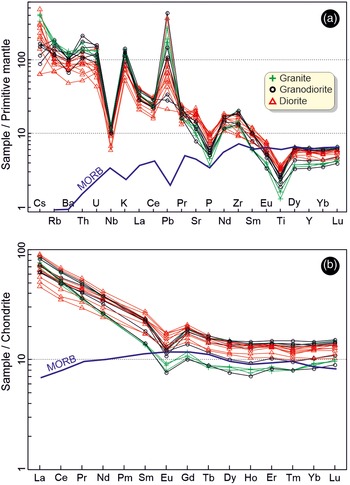
In the primitive mantle-normalized multi-element diagram (Fig. 8a), the samples of the Dağdibi Pluton present enrichments of large ion lithophile elements (LILE) such as Rb, Ba and Th generally over 100 times relative to high field strength elements (HFSE). Negative anomalies in Nb, P and Ti, and a positive anomalies in Pb are quite pronounced (Fig. 8a), which are typical for those formed in subduction and post-collisional settings with protoliths metasomatized via the addition of solutions during the previous subduction.
(a) Primitive mantle-normalized multielement diagram for the studied samples of the Dağdibi Pluton (Sun & McDonough, Reference Sun, McDonough, Saunders and Norry1989) and (b) chondrite-normalized REE diagram for the samples (Boynton, Reference Boynton and Henderson1984).

REE distributions of the samples normalized to chondrite (Boynton, Reference Boynton and Henderson1984) are shown in Fig. 8b. Light rare earth elements (LREE) are more enriched in the granodiorite samples than those of the others. The LREEs are generally moderately fractionated compared to HREEs (La N/LuN = 4.12–7.90) and samples have moderate to strong negative Eu anomalies (Eu/Eu * = 0.55–0.82) (Fig. 8b).
4.d.2. Sr, Nd and Pb isotope geochemistry
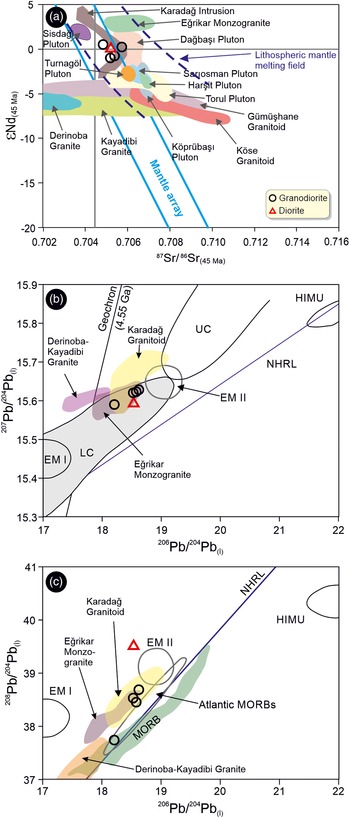
Mean age of 45 Ma was used for the calculations of 87Sr/86Sr(i), ϵNd(i) values, and Nd depleted mantle model ages (T DM 1 and T DM 2; Table S5). 87Sr/86Sr(i) ratios and ϵNd(45Ma) values vary in narrow ranges from 0.704845 to 0.705726 and –1.42 to +0.08, respectively.
In the ϵNd(45Ma)-87Sr/86Sr(45Ma) diagram, all the analysed samples are grouped in the mantle array close to the bulk silicate Earth except for a sample plotting just outside the mantle array (Fig. 9a). Also shown on the plot are the fields of other plutonic rocks from the same region for comparison. The Dağdibi samples have lesser radiogenic isotope ratios compared to those of the Late Cretaceous and middle Eocene granitic rocks.
Distributions of the Dağdibi samples in the isotope correlation diagrams. (a) ϵNd(45Ma)–87Sr/86Sr(45Ma) isotope correlation and age taken as 45 Ma, (b) 206Pb/204Pb(i) vs 207Pb/204Pb(i) and (c) 206Pb/204Pb(i) vs 208Pb/204Pb(i) isotope diagrams. NHRL: North Hemisphere Reference Line (Hart, Reference Hart1984); EMI and EMII: Enrichment Mantle I and II (Zindler & Hart, Reference Zindler and Hart1986); LC: lower crust (Kempton et al. Reference Kempton, Downes and Embey-Istzin1997); UC: upper crust (Mason et al. Reference Mason, Downes, Thirlwall, Seghedi, Szakacs, Mattey and Lowery1996); HIMU: high µ mantle (Zindler & Hart, Reference Zindler and Hart1986); Atlantic MORBs: Atlantic middle ocean rift basalt. Derinoba and Kayadibi Granites (Kaygusuz et al. Reference Kaygusuz, Arslan, Wolfgang, Sipahi and İlbeyli2012), Eğrikar Monzogranite (Sipahi et al. Reference Sipahi, Kaygusuz, Saydam Eker, Vural and Akpınar2018a), Karadağ Intrusion (Sipahi et al. Reference Sipahi, Saydam Eker, Akpınar, Gücer, Vural, Kaygusuz and Aydurmuş2022).

Pb isotope ratios of the rocks vary between 18.206 and 18.621 for 206Pb/204Pb(i), 15.590 and 15.628 for 207Pb/204Pb(i) and 37.743 and 39.520 for 208Pb/204Pb(i) (Table S5). While the isotope ratios of the 206Pb/204Pb(i) and 207Pb/204Pb(i) are distributed in a narrow range, the 208Pb/204Pb(i) isotope ratios exhibit a wide distribution. A positive correlation is observed in the isotope diagrams of 206Pb/204Pb(i) versus 207Pb/204Pb(i) and 208Pb/204Pb(i) of the samples (Fig. 9b and c). The Dağdibi samples fall in the field of lower crust and the upper part of the Northern Hemisphere Reference Line (NHRL). In addition, all the samples are located between the Enriched Mantle I (EM I) and Enriched Mantle II (EM II) fields and plot closer to the field of EM II reservoir (Fig. 9b and c). The samples of the Dağdibi Pluton have Pb isotope ratios resembling characteristically those of the lower crust (Fig. 9b) as observed in the other middle Eocene plutons in the region such as Eğrikar and Karadağ (Sipahi et al. Reference Sipahi, Saydam Eker, Kaygusuz and Vural2018b).
4.d.3. Hf isotope geochemistry
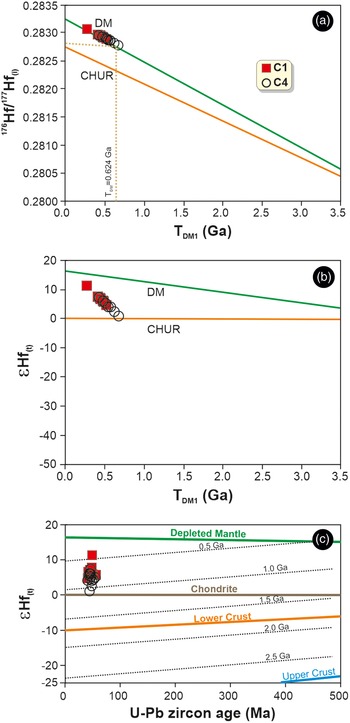
The Lu–Hf isotopes of the zircons were determined to make estimations on the possible mantle source(s) of the studied rocks. ϵHf(i) values of zircons from the granodiorite samples range from +0.14 to +10.26 (Table S6). The 176Hf/177Hf(i) ratios of the studied zircons plot on the depleted mantle (DM) line (Fig. 10a). The ϵHf(i) values show a narrow range and plot between depleted mantle and chondrite uniform reservoir (CHUR) lines (Fig. 10b and c). The Hf isotopes of the zircons yield TDM1 (single-stage Hf isotope) model ages of 0.277 to 0.623 Ma (Table S6) and offer a uniform property, suggesting derivation from the same source for the Middle Eocene magmatism.
(a) 176Hf/177Hf(i) vs TDM1(t) (Ga), (b) ϵHf(t) vs TDM1(t) (Ga), c) ϵHf(t) vs U–Pb zircon age (Ma) from the granodiorite samples.

4.d.4. Temperature and pressure
The amphibole-plagioclase thermometer: T = 0.667 P–48.98 + Y/–0.0429–0.008314 LnK, is an empirical formula proposed by Blundy & Holland (Reference Blundy and Holland1990), is widely used to calculate the crystallization temperature of magmas. Here, pressure (P) is calculated from amphibole minerals that developed in contact with each other at equilibrium crystallization. For Xab < 0.5, Y = −8.06 +25.5(1−Xab)2 is used. If Xab > 0.5, then Y=0. The K value with the formula (Si-4/8-Si)Xab is a special number. Requirements for using this thermometer are that amphibole–plagioclase equilibrium crystallization should be accompanied by biotite, quartz, K-feldspar, pyroxene, Fe–Ti oxides ± sphene minerals and plagioclase should have a less calcic character than An92. Additionally, the Si cationic value of the amphibole developing in contact with plagioclase should be lower than 7.8. The temperatures calculated for the rocks of the pluton range between 625 and 744 °C (Table S7) for granodiorite, 662 ºC for diorite.
A formula proposed by Luhr et al. (Reference Luhr, Carmichael and Varekamp1984) for biotite thermometer was also used to check the crystallization temperatures. The biotite crystallization temperatures for the investigated plutonic rocks are in the range of 627–762ºC for granodiorite and 735–781 ºC for diorite (Table S8), consistent with those of amphibole–plagioclase thermometer.
Ilmenite–magnetite thermometer: The ILMAT program (Lepage, Reference Lepage2003) was used to calculate the temperature and oxygen fugacity values for the studied rocks. The approaches suggested by Spencer & Lindsley (Reference Spencer and Lindsley1981) and Andersen & Lindsley (Reference Andersen and Lindsley1985) were used to calculate the temperature values. The chemical compositions of magnetite and ilmenite give the mean crystallization temperatures in the range from 561 to 583 ºC according to Spencer & Lindsley (Reference Spencer and Lindsley1981)’ and from 567 to 591 ºC according to Andersen & Lindsley (Reference Andersen and Lindsley1985) (Table S9). The oxygen fugacity values are in the range of −18.35 to −17.04 for the diorites.
Zircon and apatite saturation temperatures calculated from whole-rock geochemical analysis of rock samples (Watson & Harrison, Reference Watson and Harrison1983; Hanchar & Watson, Reference Hanchar and Watson2003; Miller et al. Reference Miller, McDowell and Mapes2003) range from 767 to 802 °C and 886 to 900 °C for granite, 744 to 797 °C and 857 to 890 °C for granodiorite, 699 to 753 °C and 740 to 852 °C for diorite, respectively (Table S10).
The amphibole geothermometer and geobarometer: Crystallization temperature of magma is calculated by using the Si in amphibole (Mg hornblende in this study) according to the formula (T (°C) = −151.487 × Si* + 2041) of Ridolfi et al. (Reference Ridolfi, Renzulli and Puerini2010) (Table S11). The amphibole compositions of samples yield the crystallization temperatures in the range of 691 to 792 °C for the Dağdibi Pluton. There is a linear relationship between the total aluminium content of amphiboles and increasing pressure and temperature (Hammarstrom & Zen, Reference Hammarstrom and Zen1986; Hollister et al. Reference Hollister, Grisson, Peters, Stowel and Sisson1987; Johnson & Rutherford, Reference Johnson and Rutherford1989; Schmidt, Reference Schmidt1992). Al(T) in hornblende crystallized in granitoid magmas is known as the pressure indicator and used for pressure calculations with various calibrations. The pressure values of amphiboles, whose sub-species are determined as actinolite and Mg–hornblende, were calculated according to the Al–hornblende geobarometer of Hammarstrom & Zen (Reference Hammarstrom and Zen1986), Hollister et al. (Reference Hollister, Grisson, Peters, Stowel and Sisson1987), Johnson & Rutherford (Reference Johnson and Rutherford1989), Schmidt (Reference Schmidt1992) and Mutch et al. (Reference Mutch, Blundy, Tattitch, Cooper and Brooker2016), but in this study the pressure values calculated from Mg–hornblende were preferred (Table S11). The pressure conditions during the crystallization of amphiboles vary between 0.38 and 2.45 kbar according to Schmidt (Reference Schmidt1992) and 0.97 and 2.19 kbar according to Mutch et al. (Reference Mutch, Blundy, Tattitch, Cooper and Brooker2016). The cooling depth (1 kbar = 2.7 km) corresponding to these pressures ranges from 2.6 to 5.9 km. The negative and very low-pressure values of amphiboles are interpreted as the effect of alteration and a low degree of metamorphism and so were not used. Al content in Ca-amphiboles increases with increasing degree of metamorphism (Leake, Reference Leake1964; Graham, Reference Graham1974). The calculated pressures and temperatures of amphiboles from the Dağdibi Pluton show a linear relationship.
5. Discussion
5.a. Age of the pluton
Igneous activity that occurred in a time interval from the Late Cretaceous to the end of the Eocene occupies the largest area in the eastern Sakarya Zone (Fig. 1a). Considering that the region had a magmatic arc position in the Late Cretaceous and evolved into a syn to post-collisional setting in the Eocene, precise determination of the ages of the igneous rocks is of great importance. This discrimination becomes much more important when considering that the Late Cretaceous plutonic bodies were intruded later by magmas of the middle Eocene plutonic bodies in the inner-arc setting (Dokuz et al. Reference Dokuz, Aydin and Karslı2019).
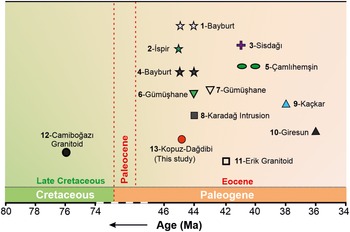
U–Pb zircon ages of 44.75 ± 0.92 and 45.01 ± 0.59 Ma refer the intrusion age of the parental magma for the Dağdibi Pluton to the middle Eocene. So, it is one of the numerous members of the post-collisional plutonic bodies of middle Eocene age in the eastern Sakarya Zone. The Sisdağı Pluton (41 Ma, Karslı et al. Reference Karslı, Dokuz, Uysal, Ketenci, Chen and Kandemir2012), Erik Granitoid (42 Ma, Sipahi et al. Reference Sipahi, Akpınar, Saydam Eker, Kaygusuz, Vural and Yılmaz2017), Kaletaş Pluton (44 Ma; Arslan & Aslan, Reference Arslan and Aslan2006), Karadağ Diorite (44 Ma, Sipahi et al. Reference Sipahi, Saydam Eker, Akpınar, Gücer, Vural, Kaygusuz and Aydurmuş2022) and Bayburt Plutons (44–45 Ma; Eyüboğlu et al. Reference Eyüboğlu, Dudas, Thorkelson, Zhu, Liu, Chatterjee, Yi and Santosh2017) are some other examples of this group in the surrounding region. Interestingly, while the Eocene magmatic activity in northwest Anatolia is mostly between 54 and 45 Ma (Okay et al. Reference Okay, Topuz, Kylander-Clark, Sherlock and Zattin2022), there is a significant number of the plutonic activities in the Sakarya Zone ranging in age predominantly from 46 to 36 Ma (Fig. 11).
The U–Pb zircon ages of the Eocene plutons from the eastern Sakarya Zone. 1-Bayburt: Kaygusuz et al. (Reference Kaygusuz, Yücel, Arslan, Sipahi, Temizel, Çakmak and Güloğlu2018, Reference Kaygusuz, Yücel, Arslan, Temizel, Yi, Jeong, Siebel and Sipahi2020); 2-İspir: Dokuz et al. (Reference Dokuz, Aydin and Karslı2019); 3-Sisdağı: Karslı et al. (Reference Karslı, Dokuz, Uysal, Ketenci, Chen and Kandemir2012); 4-Bayburt: Eyüboğlu et al. (Reference Eyüboğlu, Dudas, Thorkelson, Zhu, Liu, Chatterjee, Yi and Santosh2017); 5-Çamlıhemşin: Dokuz et al. (Reference Dokuz, Aydin and Karslı2019); 6-Gümüşhane: Arslan & Aslan (Reference Arslan and Aslan2006); 7-Gümüşhane: JICA (1986); 8-Karadağ Intrusion: Sipahi et al. (Reference Sipahi, Saydam Eker, Kaygusuz and Vural2018b); 9-Kaçkar: Boztuğ et al. (Reference Boztuğ, Jonckheere, Wagner, Erçin and Yeğingil2007); 10-Giresun: Boztuğ et al. (Reference Boztuğ, Jonckheere, Wagner and Yeğingil2004); 11-Erik Granitoid: Sipahi et al. (Reference Sipahi, Akpınar, Saydam Eker, Kaygusuz, Vural and Yılmaz2017); 12-Camiboğazı Granitoid: Kaygusuz et al. (Reference Kaygusuz, Arslan, Siebel, Sipahi, İlbeyli and Temizel2014); 13-Kopuz-Dağdibi: this study.

5.b. Mineral chemistry
Mg-rich biotite is rather known as the product of water-saturated magmatic systems (Patiño Douce & Johnston, Reference Patiño Douce and Johnston1991). The water in the system is supplied by the dehydration of the subducted material, and some of the Fe in the environment is used in the amphibole and Fe–Ti oxide is formed with the other Fe amount. The chemical composition of Mg-rich biotite implies that the pluton might have been formed from a water-saturated calc-alkaline magma in subduction-related setting.
Biotites crystallizing in calc-alkali, alkali and peraluminous granitic magmas differ significantly in their Al2O3, FeOt and MgO contents and therefore provide important information about the tectonic settings of magmas (Abdel-Fattah, Reference Abdel-Fattah1994). When biotites are put to the Al2O3-FeOt discrimination diagram, they have grouped in the field of subduction-related magmas (Fig. 4d; Abdel-Fattah, Reference Abdel-Fattah1994).
FeOt/MgO ratio of biotite crystallizing in anorogenic-alkaline magmas (forming A-type granites) is on average 7.04. While FeOt/MgO ratio in biotite crystallizing from the peraluminous magmas (S-type granites) is 3.48, this ratio of biotite in the calc-alkaline magmas (I-type granites) of orogenic belts decreases to 1.76 with the increasing Mg in biotite. The FeOt/MgO ratio in the studied biotite minerals ranges from 1.70 to 1.18, indicating that the biotite minerals were developed in I-type granitoid magmas with calc-alkaline nature in subduction-related setting. The compositions of biotites plot in the field III in the MgO-FeOt-Al2O3 triangle diagram (Speer, Reference Speer1987) where it is found with “hornblende, pyroxene, or olivine” (Fig. 4e).
5.c. Thermometer, pressure and oxygen fugacity
The temperature values obtained for the rocks of the Dağdibi Pluton are similar to those found in the Dölek, Sarıçiçek, Sorkunlu, Üzengili and Arslandede plutons (388–1196 °C, Eyüboğlu et al. Reference Eyüboğlu, Dudas, Thorkelson, Zhu, Liu, Chatterjee, Yi and Santosh2017).
Amphibole-plagioclase barometer yields pressure values for the Dağdibi Pluton similar to those of other Eocene plutons from Bayburt (0.1 to 2.2 kbar, Kaygusuz et al. Reference Kaygusuz, Yücel, Arslan, Sipahi, Temizel, Çakmak and Güloğlu2018), but lower than those of the Dölek-Sarıçiçek-Üzengil-Arslandede plutons (0.3 to 8.2 kbar, Eyüboğlu et al. Reference Eyüboğlu, Dudas, Thorkelson, Zhu, Liu, Chatterjee, Yi and Santosh2017). The crystallization depths (1 kbar = 2.7 km) estimated from the calculated pressure values of the amphiboles correspond to some places between 3 and 6 km in the upper crust.
Since the original oxygen fugacity of granitic magmas cannot be determined precisely due to slow cooling, only the relative approaches and calculations can be provided (Anderson & Smith, Reference Anderson and Smith1995; Kemp, Reference Kemp2004). Oxygen fugacity (log10ƒO2) values of the Dağdibi Pluton are in the range of −18 to −17 similar to those found in the Eocene Dölek-Sarıçiçek plutons (−15 to −21) and a granitoid body (−20 to −12) from Bayburt (Kaygusuz et al. Reference Kaygusuz, Yücel, Arslan, Sipahi, Temizel, Çakmak and Güloğlu2018).
There is no consensus on the water content of amphibole-containing magmas. It varies from 2 to 3 wt% according to Luhr (Reference Luhr1992) and is around 6 wt% on average, according to Merzbacher & Eggler (Reference Merzbacher and Eggler1984). Calculated H2O values of the amphibole in this study change from 1.68 to 4.17 wt%. The presence of hydrous mafic minerals (amphibole and biotite) and apatite in samples points to high water and volatile content of magma. If the temperature of magma is so high with such a high-water content, it can rise to the shallow depths of the continental crust without crystallizing completely (Helmy et al. Reference Helmy, Ahmed, El Mahallawi and Ali2004).
5.d. Petrogenesis of the Pluton
The Dağdibi Pluton has high K-calk-alkaline (Fig. 6c) and metaluminous (ASI<1) character. Two models have been proposed regarding the origins of high-K calc-alkaline magmas. These are (1) partial melting of basic lower crustal rocks at relatively high pressure (Roberts & Clemens, Reference Roberts and Clemens1993) and (2) mixture of magmas derived from crustal and mantle sources (Barbarin, Reference Barbarin1999).
The samples of the pluton display weak to moderate REE fractionations ((La/Yb)N = 5.90 to 21.31) in chondrite-normalized diagram, low Sr/Y ratios (6.67 to 24.16) and high Y (13.7 to 30.1 ppm) and Yb (1.48 to 3.29 ppm) contents. The rocks of the pluton display high-K calc-alkaline and I-type character and have relatively low Ni (1.6 to 113.9 ppm) contents with relatively low Mg-numbers (22–44) and a wide range of silica content (SiO2 = 52.36 to 71.81 wt%). The samples show enrichment in large ion lithophile (LIL) elements, negative Nb and Ta anomalies and positive Pb anomalies. Negative anomalies in Nb, P and Ti are the typical features of subduction-related magmas. Abundance of large ion lithophile elements in the mantle is usually revealed by the additions of solutions from the subducted slab (McCulloch & Gamble, Reference McCulloch and Gamble1991). All these data indicate that the rocks were formed by the mixing of melts derived from lower crust (amphibolitic) and lithospheric mantle sources.
5.d.1. Fractional crystallization and assimilation
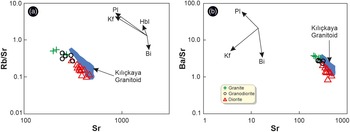
The positive and negative trends of some major and trace elements with the increasing SiO2 imply that FC has played an important role during the development of the pluton. High CaO and Sr contents and slightly negative Sr and Eu anomalies indicate plagioclase fractionation. The trends in the Rb/Sr versus Sr and Ba/Sr versus Sr diagrams suggest that plagioclase differentiation has played an important role in the formation of the present composition of the rocks (Fig. 12). The negative trends in Al2O3, MgO, CaO, Fe2O3t values against SiO2 and the increase in K2O and Ba contents can be attributed to amphibole and calcic plagioclase fractionation. The increase in K2O and Rb with increasing SiO2 indicates that they are the products of accumulation rather than fractionation of K-feldspar and biotite. The decrease in P2O5 and TiO2 contents with increasing SiO2 indicates apatite and titanite differentiation. The increase in Y and Zr indicates the accumulation of accessory minerals such as zircon and titanite.
Distributions of the samples in (a) Rb/Sr vs. Sr and (b) Ba/Sr vs. Sr diagrams. Kılıçkaya Granitoid (Kaygusuz & Öztürk, Reference Kaygusuz and Öztürk2015).

The most felsic granite specimen of the pluton has a high content of SiO2 (71wt%pri) and a low Mg-number (24), supporting that the mineral fractionation is an important process for the formation of felsic rocks. The most primitive sample has 52 wt% SiO2 and a Mg-number value of 31. If the primitive rocks of the pluton had been formed by direct partial melting of mantle peridotites, the Mg# values of the samples should have been higher than 65. Linear elemental variations (Fig. 7) along with low SiO2 values suggest that even the primitive rocks of the pluton might have been formed by crystal fractionation from a more primitive basaltic magma. An alternative way to produce such high-K calc-alkaline andesitic magmas is that they may have formed through high degree of partial melting of calc-alkaline mafic crustal rocks at lower crust (Roberts & Clemens, Reference Roberts and Clemens1993).
The negative Nb (Ta) and positive Pb anomalies (Fig. 8) point to subduction influence on the rocks and/or crustal contamination. Such depleted Nb values and other high-field strength elements may have also resulted from crustal contamination. This inference is consistent with the high Th (4.4 to 18 ppm) and Pb (1.5 to 30.6 ppm) contents of the samples that imply the contributions of crustal contamination since the crustal components are rich in Th (3.5 ppm) and Pb (8 ppm) (Taylor & McLennan, Reference Taylor and McLennan1985). The 87Sr/86Sr(i) ratios, on the other hand, are nearly constant against increasing SiO2, indicating that FC played a greater role than crustal contamination during the evolution of the Dağdibi Pluton.
5.d.2. Magma mixing
Some researchers (e.g, Grove & Donelly-Nolan, Reference Grove and Donnelly-Nolan1986; Hildreth & Moorbath, Reference Hildreth and Moorbath1988) suggest that I-type granitoids are generally resulted from the interaction of basaltic magma with crustal components via assimilation-fractional crystallization (AFC) or have formed by magma mixing. Nevertheless, some other researchers (Chappell & White, Reference Chappell and White1992; Rapela & Pankhurst, Reference Rapela and Pankhurst1996) have pointed out that relatively high siliceous magmas could have formed as a result of the FC of magmas derived from the lower crust. The presence of some disequilibrium textures (prismatic-cellular plagioclase growth, K-feldspars with poikilitic texture, etc.) in the rocks implies that interaction of two magmas with different chemical compositions have also played some role during the development of these rocks (Fig. 3). This inference is also confirmed by the presence of mafic microgranular enclaves.
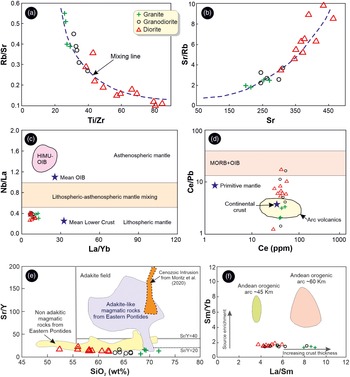
Curvilinear relationships between trace element ratios are also a feature of rocks formed as a result of magma mixing (Perugini & Poli, Reference Perugini and Poli2004). The curvilinear trends shown in the Rb/Sr versus Ti/Zr and the Sr/Rb versus Sr diagrams (Fig. 13a and b) also imply the contribution of mixing of two different end-member components during the generation of the pluton.
Distributions of the samples in various bivariation diagrams. (a) Rb/Sr vs Ti/Zr diagram, (b) Sr/Rb-Sr diagram of granitoid samples, (c) Nb/La vs La/Yb diagram, (d) Ce/Pb vs Ce diagram, (e) SiO2 vs Sr/Y discrimination diagram (Moritz et al. Reference Moritz, Popkhadze, Hässig, Golay, Lavoie, Gugushvili, Ulianov, Ovtcharova, Grosjean, Chiaradia and Dumitrica2020) and (f) La/Sm vs Sm/Yb diagram. Primitive mantle data from Hofmann (Reference Hofmann1988), continental crust, middle ocean rift basalt (MORB), ocean island basalts (OIB) and arc volcanic data from Schmidberger & Hegner (Reference Schmidberger and Hegner1999). Adakite field according to Richards & Kerrich (Reference Richards and Kerrich2007), Adakite-like rocks of the eastern Sakarya Zone from Topuz et al. (Reference Topuz, Altherr, Schwarz, Siebel, Satir and Dokuz2005, Reference Topuz, Okay, Altherr, Schwarz, Siebel, Zack, Satır and Şen2011) and Dokuz et al. (Reference Dokuz, Uysal, Siebel, Turan, Duncan and Akcay2013). Non-adakitic rocks of the eastern Sakarya Zone from Aydınçakır (Reference Aydınçakır2014), Kaygusuz & Öztürk (Reference Kaygusuz and Öztürk2015) and Dokuz et al. (Reference Dokuz, Aydin and Karslı2019). Andean orogenic arc data from Petford & Atherton (Reference Petford and Atherton1996) and Haschke et al. (Reference Haschke, Siebel, Günther and Scheuber2002).

5.e. Magma source
Low SiO2 (52 wt%) contents, calc-alkaline and I-type characteristics of the less fractionated rocks point to the involvement of metaigneous rocks as the source in the crust or lithospheric mantle. The mafic microgranular enclaves are the most important indicator of the mixture of newly advected basic magma derived from the mantle with the fractionated and partly crystallized previous magma (Barbarin & Didier, Reference Barbarin and Didier1992).
In the primitive mantle- and chondrite-normalized diagrams, pronounced negative anomalies are shown in Nb, P and Ti, and positive anomalies in Rb, Th, K and Pb, and enrichments in LILEs and light REEs relative to the HFSE and heavy REEs. These features are generally typical for the rocks with mantle wedge and crustal origin. I-type and high-K nature of the rocks can be formed by the partial melting of calc-alkaline basic and intermediate rocks in the crust (Roberts & Clemens, Reference Roberts and Clemens1993). Magmas derived from these sources may produce granitic rocks via FC and/or crustal contamination. Granitic composition may also be produced by low degree of partial melting of the basic lower crust (Roberts & Clemens, Reference Roberts and Clemens1993). The studied rocks display a wide range of Y/Nb ratio (1.73 to 5.48). This implies both the mantle and crustal origins for the rocks because Y/Nb ratio is lower than 1.2 for mantle rocks and higher than 1.2 for crustal rocks (Eby, Reference Eby1992). Nb/Ta ratio is 17.5 for the rocks originated from the mantle and is in between 11 and 12 for the magmas derived from the crustal igneous protoliths (Green, Reference Green1995). The Nb/Ta ratios of the studied samples are between 9.40 and 16.00, consistent with both the mantle and crustal rocks as a source. The absence of a clear differentiation in the medium and heavy REEs and low Sr/Y ratios (6.9 to 22.7) indicate that garnet was not a phase in the magma source (Fig. 8b).
The studied rocks are located in the lithospheric mantle field in the Nb/La versus La/Yb diagram (Fig. 13c) and close to the point of average lower crustal rocks. However, on the Ce/Pb versus Ce diagram (Fig. 13d), the samples display a large variation from MORB+OIB field to continental crust (arc volcanics) due to the decreasing Ce/Pb ratios.
The Eocene post-collisional magmatism in the eastern Sakarya Zone has been separated into two: an early Eocene adakite-like (Topuz et al. Reference Topuz, Altherr, Schwarz, Siebel, Satir and Dokuz2005, Reference Topuz, Okay, Altherr, Schwarz, Siebel, Zack, Satır and Şen2011; Dokuz et al. Reference Dokuz, Uysal, Siebel, Turan, Duncan and Akcay2013) and middle Eocene non-adakite-like (Aydınçakır, Reference Aydınçakır2014; Dokuz et al. Reference Dokuz, Aydin and Karslı2019). In the SiO2 versus Sr/Y diagram, our samples are located in the field of normal arc rocks but closer to the field of the early-middle Eocene adakitic rocks (Fig. 13e). The La/Sm and Sm/Yb ratios of the rocks vary from 3.75 to 8.97 and 1.38 to 1.92, respectively, while the adakitic rocks are in between 7.3 to 10.6 and 2.3 to 7.6 (Fig. 13f). These La/Sm and Sm/Yb ratios are different from those of the Andean-type arc rocks.
The Sm-Nd model ages of the studied rocks are Neoproterozoic (0.83 Ga) and Mesoproterozoic (0.81–1.02 Ga), and their Pb isotope compositions are characteristically similar to those of the sub-continental crust.
The samples having high and positive ϵHf(t) values (0.14 to 10.26; mean 4.53) match with those derived from an enriched mantle source and with minor crustal contamination. That ϵHf(t) values cluster between 4 and 7, while 1.07 and 12 are obtained only in one analysis; these values are consistent with zircon formation from relatively juvenile magmas. Consistent with Th/U values, much of which generally have Th/U < 0.1, indicative of a probable magmatic origin (Fig. 5c). All these features indicate the derivation of the Dağdibi Pluton from a juvenile source.
5.f. Tectonic setting
The rocks of the Dağdibi Pluton have I-type and high K calc-alkaline character. They are enriched in LREE (Rb, Ba and K) and poor in HREE (Nb and Ti). All these features are typical for the rocks formed in arc settings (Floyd & Winchester, Reference Floyd and Winchester1975; Rogers & Hawkesworth, Reference Rogers and Hawkesworth1989; Sajona et al. Reference Sajona, Maury, Bellon, Cotten and Defant1996). However, it is worth to remember here that the rocks formed during the post-collisional stages could also show subduction-related features (Roberts & Clemens, Reference Roberts and Clemens1993). Hence, the results obtained from the tectonic discrimination diagrams do not always provide a clear distinction for the middle Eocene rocks of the eastern Sakarya Zone and need to be evaluated together with sedimentological, stratigraphical and structural data.
5.g. Geodynamic implications
There is a substantial consensus on that the northern branch of the Neotethys Ocean was closed by a northward subduction beneath the Sakarya Zone in Turkey (Şengör & Yılmaz, Reference Şengör and Yılmaz1981) and can be followed by its oceanic remnants along the İzmir-Ankara-Erzincan Suture (Okay & Tüysüz, Reference Okay, Tüysüz, Durand, Jolivet, Hovarth and Séranne1999). Although docking of the Anatolides with the Sakarya Zone happened at a time around the Late Cretaceous (latest Campanian), the hard collision did not occur until the Palaeocene, based on the regional stratigraphy. This is the conclusion of almost all the geologists who studied the region (e.g., Şengör & Yılmaz, Reference Şengör and Yılmaz1981; Okay & Tüysüz, Reference Okay, Tüysüz, Durand, Jolivet, Hovarth and Séranne1999; Okay et al. Reference Okay, Tansel and Tüysüz2001; Topuz et al. Reference Topuz, Altherr, Schwarz, Siebel, Satir and Dokuz2005; Sosson et al. Reference Sosson, Rolland, Müller, Danelian, Melkonyan, Kekelia, Adamia, Babazadeh, Kangarli, Avagyan, Galoyan, Mosar, Sosson, Kaymakcı, Stephenson, Bergerat and Starostenko2010; Karslı et al. Reference Karslı, Ketenci, Uysal, Dokuz, Aydin, Chen, Kandemir and Wijbrans2011; Dokuz et al. Reference Dokuz, Aydin and Karslı2019; Kandemir et al. Reference Kandemir, Akbayram, Çobankaya, Kanar, Pehlivan, Tok, Hakyemez, Ekmekçi, Danacı and Temiz2019). Final igneous products of this oceanic closure display a relatively K-rich nature compared to those formed in its earlier stages (Karslı et al. Reference Karslı, Aydin, Uysal, Dokuz, Kumral, Kandemir, Budakoğlu and Ketenci2018; Aydın et al. Reference Aydın, Oğuz Saka, Şen, Dokuz, Aiglsperger, Uysal, Kandemir, Karslı, Sarı and Başer2020; Oğuz-Saka et al. Reference Oğuz-Saka, Aydin, Karsli, Dokuz, Aiglsperger, Miggins, Şen, Kandemir, Sarı and Koppers2023). The Sakarya Zone and the Anatolides have stayed under the effects of a compressional regime throughout the Palaeocene-early Eocene. (Kandemir et al. Reference Kandemir, Akbayram, Çobankaya, Kanar, Pehlivan, Tok, Hakyemez, Ekmekçi, Danacı and Temiz2019). Adakite-like rocks are the first igneous products of this syn- to post-collisional period (Dokuz et al. Reference Dokuz, Uysal, Siebel, Turan, Duncan and Akcay2013, Reference Dokuz, Aydin and Karslı2019; Gücer, Reference Gücer2021). They intruded into the crust in the early Eocene (55–50 Ma) following a magmatic lull up to 10 to 12 Ma after the final subduction-related products at around 72 Ma (Topuz et al. Reference Topuz, Altherr, Schwarz, Siebel, Satir and Dokuz2005; Eyüboğlu et al. Reference Eyüboğlu, Santosh and Chung2011; Karslı et al. Reference Karslı, Ketenci, Uysal, Dokuz, Aydin, Chen, Kandemir and Wijbrans2011). This period was followed by a non-adakitic igneous activity in the middle Eocene without any gap. The igneous products show a range in age from 50 to 43 Ma and carry more or less geochemical features identical to those formed in arc settings (Dokuz et al. Reference Dokuz, Aydin and Karslı2019; Sipahi et al. Reference Sipahi, Saydam Eker, Akpınar, Gücer, Vural, Kaygusuz and Aydurmuş2022; this study). The subduction imprints are diminished or completely erased in the rocks formed in the age span of 43 to 36 Ma (Eyüboğlu et al. Reference Eyüboğlu, Dudas, Thorkelson, Zhu, Liu, Chatterjee, Yi and Santosh2017; Dokuz et al. Reference Dokuz, Aydin and Karslı2019). The rocks of this time span commonly have hybrid geochemical characteristics taken from both the subduction and upwelling asthenosphere.
There are various geodynamic models proposed for the explanation of the Early Cenozoic post-collisional magmatism in the eastern Sakarya Zone. These are melting of lower crust due to the crustal thickening (Topuz et al. Reference Topuz, Altherr, Schwarz, Siebel, Satir and Dokuz2005), lithospheric delamination (e.g. Arslan et al. Reference Arslan, Temizel, Abdioğlu, Kolaylı, Yücel, Boztuğ and Şen2013; Temizel et al. 2016) and slab break-off (e.g. Keskin et al. Reference Keskin, Genç and Tüysüz2008; Dilek et al. Reference Dilek, Imamverdiyev and Altunkaynak2010; Altunkaynak et al. Reference Altunkaynak, Sunal, Aldanmaz, Genç, Dilek, Furnes, Foland, Yang and Yıldız2012; Dokuz et al. Reference Dokuz, Aydin and Karslı2019; Gücer, Reference Gücer2021). The authors consider that the slab-breakoff model best explains the Early Cenozoic post-collisional magmatism in the Sakarya Zone as outlined in Dokuz et al. (Reference Dokuz, Aydin and Karslı2019).
6. Conclusions
U–Pb SHRIMP zircon ages (45.01 ± 0.59 Ma and 44.75 ± 0.92 Ma) indicate that the Dağdibi Pluton in the eastern Sakarya Zone, Turkey, is one of the small members of the large plutonic activity in the middle Eocene. The rocks of the pluton vary in composition from diorite through granodiorite to granite and display high-K calc-alkali, metaluminous and I-type affinities. Plagioclase shows a compositional range from labradorite (An62) to oligoclase (An10). Fractionation of plagioclase, hornblende and Fe-Ti oxide was effective during the formation of the pluton. Disequilibrium textures, curvilinear variations of element ratios and mafic magmatic enclaves are regarded as the indicators of magma mixing. Mineral compositions and P–T estimations show that the parental magma of the pluton was emplaced at ∼3 to 6 km crustal depths and crystallized at temperatures of 625 and 792 °C. Slab breakoff, which occurred approximately 10 to 12 Ma after the collision of Anatolide-Tauride Block with the Sakarya Zone in the Late Cretaceous (late Campanian), is regarded as the geodynamic process responsible for the formation of the middle Eocene magmatism in the eastern Sakarya Zone.
Supplementary material
To view supplementary material for this article, please visit https://doi.org/10.1017/S001675682300033X
Acknowledgements
This study was supported by Gümüşhane University, Scientific Research Projects Coordination Department (Project numbers: 19.F5114.01.03 and 19.F5114.07.04) and a TÜBİTAK Project (number: 114Y099). Authors thank Tanju Aydurmuş for help during the field studies. Also, we would like to thank the editor, Dr. Tim Johnson, and the reviewers, Dr. Gültekin Topuz and Dr. Aral Okay, for their important contributions.