Implications
Life cycle assessment (LCA) was used to assess environmental impacts of contrasting pig farming systems. Results indicate that the ranking of system impacts depends on which functional unit is used. The degree of intensification is inversely proportional to environmental impacts expressed per kg of pig live weight produced but proportional to them when expressed per ha of land used. LCA appears suitable to assess environmental impacts of pig production systems and can contribute to the overall assessment of sustainability.
Introduction
World livestock production has major impacts on the environment because of its emissions into the environment, which affect air, water and soil quality, and the use of limited or non-renewable resources (Steinfeld et al., Reference Steinfeld, Gerber, Wassenaar, Castel, Rosales and de Haan2006). In this context, European Union (EU) pig production systems are facing major challenges. There is increasing public concern about the currently dominant intensive production systems (Petit and Van der Werf, Reference Petit and Van der Werf2003), mainly because of environmental and animal-welfare shortcomings (Krystallis et al., Reference Krystallis, Dutra de Barcellos, Kügler, Verbeke and Grunert2009). Moreover, owing to economic constraints and globalisation, pig production systems are similar throughout the world, with the same intensive conventional system prevailing in most countries. Concomitantly, there is a loss of systems adapted to local conditions and to the diversity of demands from society and consumers (Kanis et al., Reference Kanis, Groen and de Greef2003; Petit and Van der Werf, Reference Petit and Van der Werf2003; Krystallis et al., Reference Krystallis, Dutra de Barcellos, Kügler, Verbeke and Grunert2009; Bonneau et al., Reference Bonneau, Antoine-Ilari, Phatsara, Brinkmann, Hviid, Christiansen, Fàbrega, Rodríguez, Rydhmer, Enting, de Greef, Edge, Dourmad and Edwards2011). Although non-conventional production systems are often believed to be more sustainable (Degré et al., Reference Degré, Debouche and Verhève2007), their real benefits for the environment, animal welfare and product quality may be controversial (Basset-Mens and Van der Werf, Reference Basset-Mens and Van der Werf2005; Degré et al., Reference Degré, Debouche and Verhève2007).
An inventory at the farm level of pig farming systems, mainly from EU countries, was recently performed within the EU project ‘Q-PorkChains’ (Bonneau et al., Reference Bonneau, Antoine-Ilari, Phatsara, Brinkmann, Hviid, Christiansen, Fàbrega, Rodríguez, Rydhmer, Enting, de Greef, Edge, Dourmad and Edwards2011). Although this inventory was not exhaustive, 84 farming systems (40 conventional and 44 differentiated) were identified in 23 countries. Differentiated systems showed great diversity in animal welfare, environment and product-quality claims, and most claimed improvements in more than one category, compared with conventional systems. Hierarchical cluster analysis of the 84 systems resulted in three clusters: (i) intensive conventional systems oriented towards standard quality, (ii) differentiated systems, with characteristics indicative of more extensive and more welfare- and quality-oriented production and (iii) intermediate systems, with only minor differences from conventional systems.
This inventory was used to select contrasting systems that were evaluated in more detail within the Q-PorkChains project for different sustainability themes including animal welfare, market conformity (Gonzàlez et al., Reference Gonzàlez, Gispert, Gil, Hviid, Dourmad, de Greef, Zimmer and Fàbrega2014), meat safety, animal health, breeding programmes (Rydhmer et al., Reference Rydhmer, Gourdine, de Greef and Bonneau2014), economics (Ilari-Antoine et al., 2014), working conditions and environment. This evaluation was performed using a toolbox developed from the literature (Edwards et al., Reference Edwards, Dourmad, Edge, Fabrega, de Greef, Antoine-Ilari, Phatsara, Rydhmer and Bonneau2008; Bonneau et al., Reference Bonneau, de Greef, Brinkman, Cinar, Dourmad, Edge, Fàbrega, Gonzàlez, Houwers, Hviid, Ilari-Antoine, Klauke, Phatsara, Rydhmer, Van der Oever, Zimmer and Edwards2014a) and was finalised into an overall sustainability evaluation (Bonneau et al., Reference Bonneau, Klauke, Gonzàlez, Rydhmer, Ilari-Antoine, Dourmad, de Greef, Houwers, Cinar, Fàbrega, Zimmer, Hviid, Van der Oever and Edwards2014b). In this toolbox, the life cycle assessment (LCA) method was chosen to assess environmental impacts (Dourmad et al., Reference Dourmad, Hermansen and Bonneau2008). LCA is well-adapted for assessing environmental impacts of livestock farms (van de Werf and Petit, Reference Van der Werf and Petit2002; Halberg et al., Reference Halberg, Van der Werf, Basset-Mens, Dalgaard and de Boer2005) and has been widely used to do so (de Vries and de Boer, Reference de Vries and de Boer2010). The aim of the present study was to assess environmental impacts of selected contrasting pig farming systems in the EU studied for their global sustainability within the Q-PorkChains project.
Material and Methods
Goal definition
The goal of this study was to assess potential environmental impacts of different categories of pig farming systems in the EU, defined by the degree to which they differed from conventional systems.
System description and data collection
A total of 15 EU pig farming systems were chosen among the 84 systems inventory (Bonneau et al., Reference Bonneau, Antoine-Ilari, Phatsara, Brinkmann, Hviid, Christiansen, Fàbrega, Rodríguez, Rydhmer, Enting, de Greef, Edge, Dourmad and Edwards2011). One conventional and two differentiated systems were assessed from each of the five countries: Denmark, The Netherlands, Spain, France and Germany. The systems were classified according to the typology of Bonneau et al. (Reference Bonneau, Antoine-Ilari, Phatsara, Brinkmann, Hviid, Christiansen, Fàbrega, Rodríguez, Rydhmer, Enting, de Greef, Edge, Dourmad and Edwards2011, Reference Bonneau, Klauke, Gonzàlez, Rydhmer, Ilari-Antoine, Dourmad, de Greef, Houwers, Cinar, Fàbrega, Zimmer, Hviid, Van der Oever and Edwards2014b) into conventional (C, n=5), adapted conventional (AC, n=5), and differentiated, composed of organic (O, n=2, Denmark and Germany) and traditional (T, n=3, Spain, France and Germany). The inventory data needed for LCA calculations were obtained from surveys of 5 to 10 farms from each system. This survey collected the information required for global evaluation of multiple themes of sustainability (Bonneau et al., Reference Bonneau, Klauke, Gonzàlez, Rydhmer, Ilari-Antoine, Dourmad, de Greef, Houwers, Cinar, Fàbrega, Zimmer, Hviid, Van der Oever and Edwards2014b). Different types of farms were considered depending on the system and country: breeding farms, farrow-to-finish farms and fattening farms. Data collected for the environmental theme concerned: (i) animal performance, including sow productivity, mortality rates, pig growth and feed intake during post-weaning and fattening periods, and slaughter characteristics; (ii) feed composition, including metabolisable energy, CP and phosphorus (P) contents, and when available, feed-ingredient contents; (iii) animal housing, including type of housing (e.g. indoor, outdoor, free-range), type of floor (e.g. litter bedding, complete or partially slatted floor), and ambient temperature; and (iv) manure handling, including management in the building (e.g. liquid, solid, removal frequency) and during storage (type and duration of storage), manure treatment (composting, anaerobic or aerobic digestion) and type and distance of spreading.
From the data collected, an ‘average’ system was built for each farming system. Performance and nutrient flows and emissions were calculated for each production stage, that is, sows and their piglets until weaning, post-weaning piglets and fattening pigs. In this way, it was easy to aggregate up to entire production systems by considering the number of piglets weaned per sow per year and mortality rates of pigs during post-weaning and fattening periods.
System boundaries and functional units
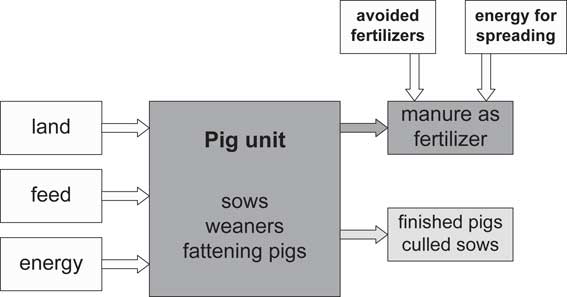
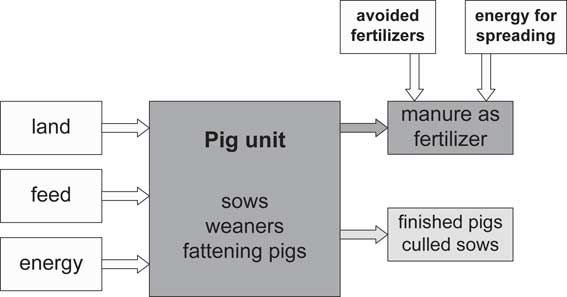
A cradle-to-farm-gate LCA was conducted for the entire pig production system, including reproducing sows and their piglets until weaning, post-weaning piglets and fattening pigs (Figure 1). System and subsystem boundaries were derived mainly from Basset-Mens and Van der Werf (Reference Basset-Mens and Van der Werf2005) and Nguyen et al. (Reference Nguyen, Hermansen and Mogensen2010, Reference Nguyen, Hermansen and Mogensen2011). The main subsystem is the pig unit that includes production of piglets and their raising until slaughter weight, which varied between systems. This unit is considered to be landless, as assumed by Nguyen et al. (Reference Nguyen, Hermansen and Mogensen2010), but it interacts with land use through the import of feed and the deposition/use of manure produced by the animals (Figure 1). Any land used for outdoor pig raising was also included within the system. The system includes production and delivery of feed produced off-farm, herd management, and emissions from the animals and manure storage. Environmental consequences of manure use were estimated using system expansion as described by Nguyen et al. (Reference Nguyen, Hermansen and Mogensen2010). Manure produced was assumed to replace a certain amount of mineral fertilisers. The mineral fertiliser equivalency (MFE) was assumed to be 75% for nitrogen (N), with 5% extra loss as nitrate compared with mineral fertiliser (Nguyen et al., Reference Nguyen, Hermansen and Mogensen2010). The MFE for P was assumed to be 100% (Nguyen et al., Reference Nguyen, Hermansen and Mogensen2011). Transport and slaughter of animals leaving the system was excluded. The functional units were 1 kg of live weight (LW) of pigs leaving the pig unit, including culled sows and slaughter pigs, and 1 ha of land used to produce feed and raise animals.
Simplified description and boundaries of the pig production system. A more detailed presentation of feed production is available in the study by Mosnier et al. (Reference Mosnier, Van der Werf, Boissy and Dourmad2011).
Life cycle inventory analysis
Production of feed and feed ingredients
The amount and nutrient contents of complete feed used by each category of pig was obtained from survey data. However, since information was generally lacking about the ingredient contents of feed, they were estimated in a way similar to that performed by Nguyen et al. (Reference Nguyen, Hermansen and Mogensen2010), assuming that complete feed was a mixture of cereals (wheat, barley and maize), protein-rich ingredients (soybean meal, rapeseed meal and peas) and minerals (phosphate and calcium carbonate). This calculation was performed for all diets used by each pig category.
LCA data on conventionally grown feed ingredients were based on Mosnier et al. (Reference Mosnier, Van der Werf, Boissy and Dourmad2011), who give a detailed description of the methodology used to evaluate impacts of producing non-organic feed ingredients. Soybean meal was assumed to come from soybeans grown in southern Brazil (i.e. no land-use change within the past 20 years). For other crops, inputs used were based on AGRESTE (2006). For the transformation of crop products into feed ingredients, data were based on the study by Nemecek and Kägi (Reference Nemecek and Kägi2007) for maize drying and Nemecek and Kägi (Reference Nemecek and Kägi2007) and Jungbluth et al. (Reference Jungbluth, Chudacoff, Dauriat, Dinkel, Doka, Faist Emmenegger, Gnansounou, Kljun, Schleiss, Spielmann, Stettler and Sutter2007) for the production of soybean meal, rapeseed meal and rapeseed oil. Data were also obtained for monocalcium phosphate (LCA Food Database, 2007). Data concerning resource use and emissions associated with the production and delivery of several inputs for crop production (fertilisers, tractor fuel and agricultural machinery) came from the ecoinvent database, version 2.0 (Nemecek and Kägi, Reference Nemecek and Kägi2007). The production of seed for sowing was taken into account assuming that inputs required for seed production were similar to those required for the corresponding crop. Values for organic feed ingredients used in organic pig production systems were based on the LCA Food Database (2007).
Production of pigs
Emissions to air were estimated for NH3, N2O, NO x and CH4. Emission of CH4 from enteric fermentation and manure management were calculated according to Rigolot et al. (Reference Rigolot, Espagnol, Pomar and Dourmad2010a and Reference Rigolot, Espagnol, Robin, Hassouna, Béline, Paillat and Dourmad2010b) and Intergovernmental Panel on Climate Change (IPCC, 2006). Direct N2O–N emissions from manure during in-house and outdoor storage and during field application were calculated according to IPCC (2006). Emissions of NO x were estimated according to Nemecek and Kägi (Reference Nemecek and Kägi2007). NH3–N emission during in-house storage, outside storage and field application of manure were calculated according to Rigolot et al. (Reference Rigolot, Espagnol, Pomar and Dourmad2010a and Reference Rigolot, Espagnol, Robin, Hassouna, Béline, Paillat and Dourmad2010b) according to type of effluent (slurry, solid manure), duration and type of storage and method of spreading.
Energy use in the building for light, heating and ventilation was considered, but not the emissions and resources used for the construction of buildings. Veterinary and cleaning products were also excluded because of lack of data from the surveys.
Life cycle impact assessment
The following impact categories were considered: climate change (CC), eutrophication potential (EP), acidification potential (AP), cumulative energy demand (CED) and land occupation (LO). The indicator result for each impact category was determined by multiplying the aggregated resources used and the aggregated emissions of each individual substance with a characterisation factor for each impact category to which it may potentially contribute. CC, EP, AP, CED and LO were calculated using the CML2 ‘baseline’ and ‘all categories’ 2001 characterisation methods as implemented in the ecoinvent v2.0 database. CC was calculated according to 100-year global warming potential factors expressed in kg CO2 equivalents (eq), CH4: 25, N2O: 298, CO2: 1 (IPCC, 2006). EP was calculated using generic EP factors in kg PO4-eq, NH3: 0.35, NO3: 0.1, NO2: 0.13, NO x : 0.13, PO4: 1 (Guinée et al., Reference Guinée, Gorrée, Heijungs, Huppes, Kleijn, de Koning, van Oers, Wegener Sleeswijk, Suh, Udo de Haes, de Bruijn, van Duin and Huijbregts2002). AP was calculated using average European AP factors in kg SO2-eq, NH3: 1.6, NO: 0.5, NO: 0.5, SO: 1.2 (Guinée et al., Reference Guinée, Gorrée, Heijungs, Huppes, Kleijn, de Koning, van Oers, Wegener Sleeswijk, Suh, Udo de Haes, de Bruijn, van Duin and Huijbregts2002). CED (MJ) was calculated according to version 1.05 as implemented in the ecoinvent v2.0 database. LO (m2 year) refers to on-farm and off-farm area used to produce feed and raise pigs. A description of the CML 2001 and CED methods can be found in Frischknecht et al. (Reference Frischknecht, Jungbluth, Althaus, Bauer, Doka, Dones, Hischier, Hellweg, Humbert, Köllner, Loerincik, Margni and Nemecek2007); because of a lack of data, terrestrial ecotoxicity and use of pesticides could not be assessed.
Some authors have suggested adapting the functional unit chosen to the impact category, that is, kg of product for global impacts and ha of land for local impacts (Haas et al., Reference Haas, Wetterich and Kopke2001; de Boer, Reference de Boer2003). We followed this approach to compare the non-conventional systems (AC, T and O) and define a smaller set of indicators to be used for an overall (environmental, economic, social) assessment of sustainability (Bonneau et al., Reference Bonneau, Klauke, Gonzàlez, Rydhmer, Ilari-Antoine, Dourmad, de Greef, Houwers, Cinar, Fàbrega, Zimmer, Hviid, Van der Oever and Edwards2014b). CC, AP, CED and LO were considered global impacts and expressed per kg product, while EP and AP were considered local impacts and expressed per ha. AP was considered to have both local and global impacts, because NH3 from an animal-production system is known to be deposited both near and far from the farm.
Multidimensional analysis
We performed multivariate Principal Component Analysis (PCA) analyses to evaluate correlations among variables measured in the study and their effects on system impacts using R software (version 2.8.1; R Development Core Team, 2008). The variables concerned the environmental impacts expressed per kg LW and per ha of land used and factors describing animal performance: number of piglets produced per sow per year (pigsow), piglet LW produced per kg sow (lwsow) or per ha (lwha), feed efficiency (lwfeed: inverse of feed-conversion ratio) and feed CP and P contents (feedcp and feedp, respectively).
Results
Animal performance and system description
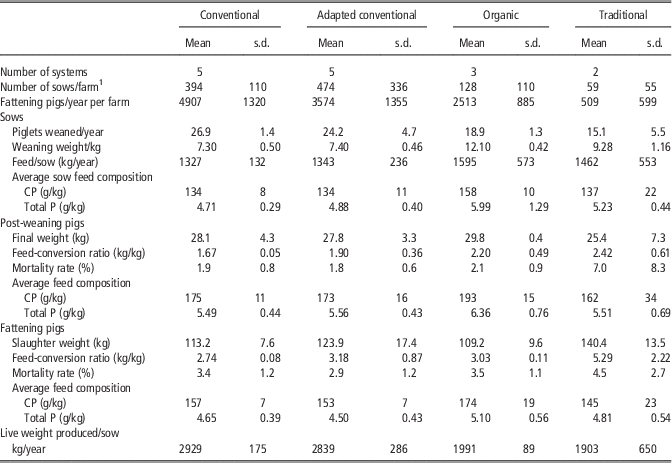
On average there were 313 sows in the farms with a farrowing unit (Table 1). Farms with a fattening unit produced a mean of 3264 pigs/year. Variability in mean farm size per system (±267 sows, CV=85% and ±1958 fattening pigs, CV=60%) was high, with large differences between systems. Herd size was highest for C and AC systems and lowest for T systems, with O systems being intermediate (Table 1).
Performance of sows, post-weaning pigs and fattening pigs and average composition of diets in the pig production systems studied

1 For farms with sows.
On average, sows weaned 22.6 piglets/year. The highest performance was measured in C systems (26.9). Performances were slightly lower in AC systems (24.2) and lowest in O and T systems (18.9 and 15.1, respectively). Annual feed consumption per sow was higher in T and O systems, where feed tended to have higher CP and P contents than that in C and AC systems.
Mean feed-conversion ratio during the post-weaning period was 1.96 (±0.44) kg/kg gain. It was lowest for C systems and highest for T systems (Table 1). Mortality rate (overall mean=2.9%) was markedly higher for T systems, with small differences among the other systems. Dietary CP content of post-weaning diets (overall mean=174 g/kg) was lowest in T systems (162 g/kg) and highest in O systems (193 g/kg). Total dietary P content was highest in O systems, with no marked difference among the other systems.
Mean pig slaughter weight was 113 kg in C systems, similar to that in O systems (109 kg). It was 11 and 27 kg higher in AC and T systems, respectively. Mean feed-conversion ratio during the fattening period was 3.44 (±1.37). It was lowest for C systems and highest for T systems (Table 1). Mortality rate (mean=3.5%) was higher for T systems, with small differences among the other systems. Dietary CP content of fattening diets (overall mean=155 g/kg) was lowest in T systems (145 g/kg) and highest in O systems (174 g/kg). Total dietary P content was highest in O and T systems, with no marked difference between C and AC. Mean pig LW produced per sow per year equalled 2569 kg. It was higher in C and AC systems (2929 and 2839 kg, respectively) and lower in O and T systems (1991 and 1903 kg, respectively).
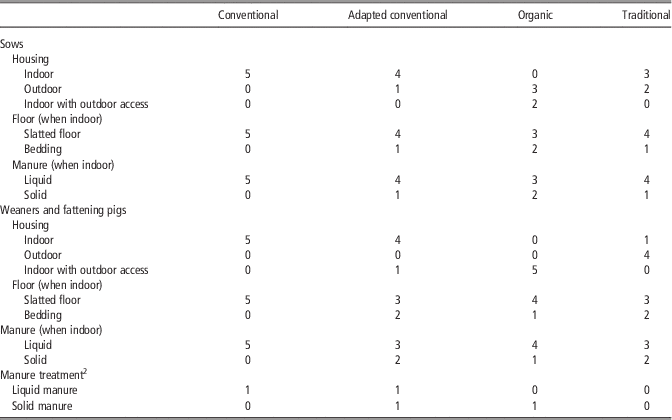
Table 2 reports housing and manure management of the farms studied. All conventional pigs were housed indoors, on slatted floors. Their manure was handled as slurry, only a small percentage of the slurry being treated. In AC systems, slatted floor was also the most frequent but in some cases sows and/or fattening pigs were raised on straw bedding with the production of solid manure. In O systems, animals were raised outdoors, or indoors with outdoor access. The use of slatted floor was the most frequent for fattening pigs. In T systems, sows were raised outdoors or indoors, but fattening pigs were most often raised outdoors.
Frequency of housing and manure management in studied farms by type of production systemFootnote 1
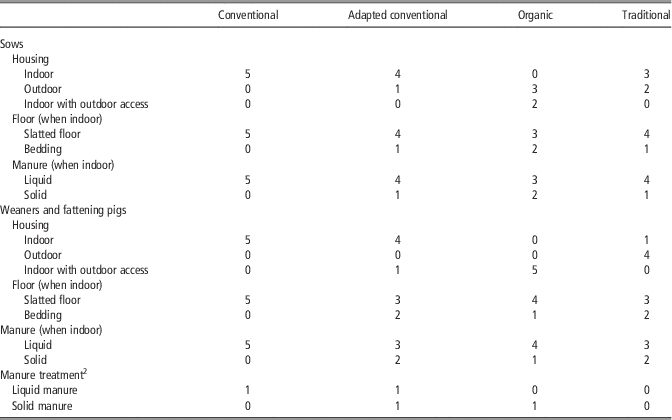
1 From 0 to 5 depending on the frequency of occurrence.
2 Aerobic or anaerobic digestion for liquid manure and composting for solid manure.
Environmental impacts of feed and feed ingredients
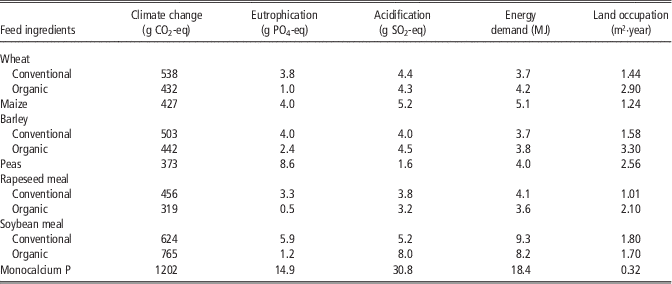
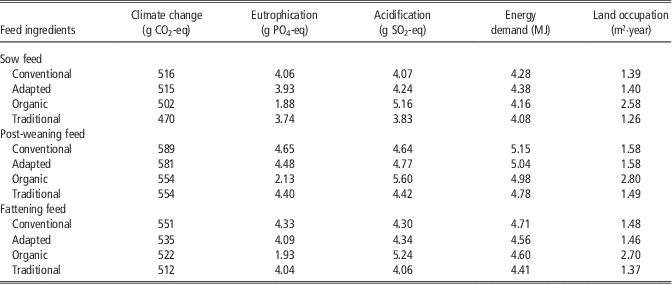
For cereals and rapeseed meal, CC and EP impacts were lower for organic feed ingredients than conventional ones; conversely, LO was higher for organic feed ingredients (Table 3). Potential impacts of production and delivery of all feed mixtures were similar for C and AC systems and 6% to 7% lower for T systems (Table 4). Compared with conventional feeds, organic feed mixtures had slightly lower (−5%) CC and much lower (−54%) EP impacts, but higher (+23%) AP and (+82%) LO impacts.
Potential environmental impacts of producing 1 kg of each feed ingredientFootnote 1
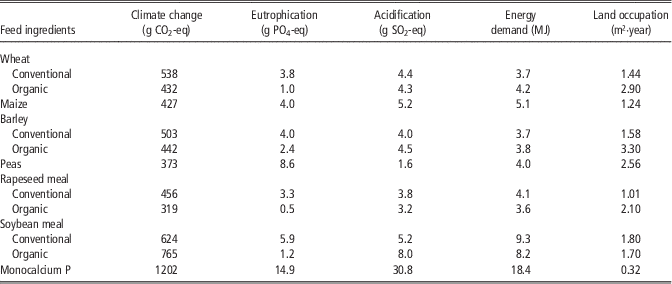
1 Data for conventional feed ingredients was adapted from Mosnier et al. (Reference Mosnier, Van der Werf, Boissy and Dourmad2011). Data for organic ingredients are for Denmark (adapted from the LCA Food Database, 2007).
Potential environmental impacts of producing 1 kg of feed mixture for sows, post-weaning and fattening pigs in the production systems

Environmental impacts of pig production
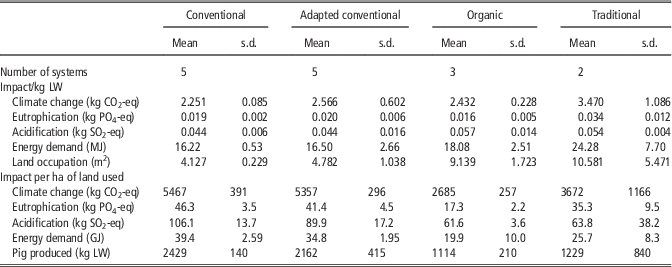
Table 5 shows environmental impacts of the systems per kg of pig LW produced and per ha of land used during a year (Table 5). There were large differences between systems for all impact categories expressed per kg LW. Mean (±CV) CC, EP, AP, CE and LO equalled 2.6 (±27%) kg CO2-eq, 0.02 (±41%) kg PO4-eq, 0.05 (±23%) kg SO2-eq, 18.2 (±26%) MJ and 6.6 (±56%) m2/kg LW, respectively. There were substantial differences between extreme values for all impacts (by factors of 2.1 to 4.0). Mean CC/kg LW was lowest for C and highest for T systems (+54% compared with C), with AC and O systems being intermediate. EP per kg LW was similar for C and AC systems but higher for T systems (+79%) and lower for O systems (−16%). Similarly, AC per kg LW was similar for C and AC systems and higher for T and O systems (+23% and +29%, respectively). CED per kg LW was lowest for C and AC systems and higher for O (+11%) and T (+50%) systems. Marked differences in LO were found between C and AC systems (4.1 and 4.8 m2/kg LW, respectively) and T and O systems (10.6 and 9.1 m2/kg LW, respectively).
Potential environmental impact expressed per kg pig live weight (LW) produced or per ha of land used

When expressed per ha of land used, there were also large differences between systems for all impact categories. Mean (±CV) CC, EP, AP and CE equalled 4677 (±26%) kg CO2-eq, 38.6 (±28%) kg PO4-eq, 86.3 (±30%) kg SO2-eq, 32 540 (±25%) MJ, respectively, while 1925 (±36%) kg pig LW were produced per ha. There were marked differences between extreme values for all impacts (by factors of 2.6 to 4.0). Mean CC per ha was lowest for O and highest for C and AC systems (+110% compared with O), with T systems being intermediate. EP per ha was substantially lower for O systems; it was highest for C systems (+170%), followed by AC and T. AP per ha was similar for O and T systems but higher for C and AC systems (+70% and +45%, respectively). CED per ha was lowest for O systems and higher for T (+29%), C (+98%) and AC (+75%) systems. Substantial differences in LW produced per ha land occupied, were found between C and AC systems (2429 and 2162 kg/ha, respectively) and T and O systems (1229 and 1114 kg/ha, respectively).
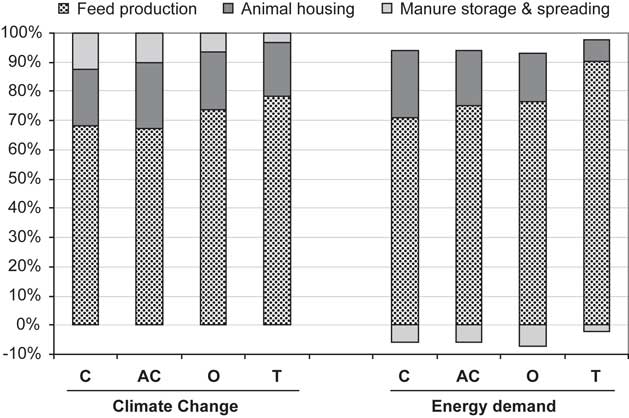
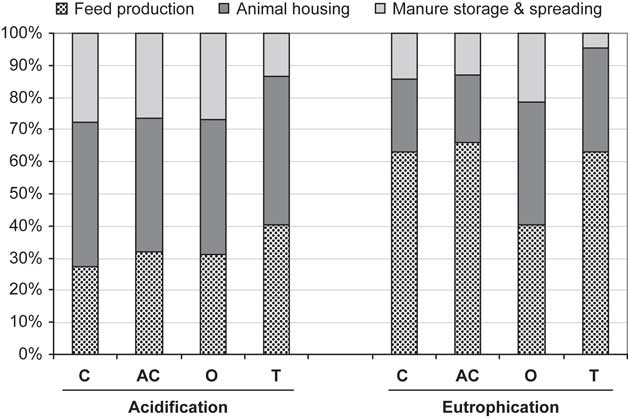
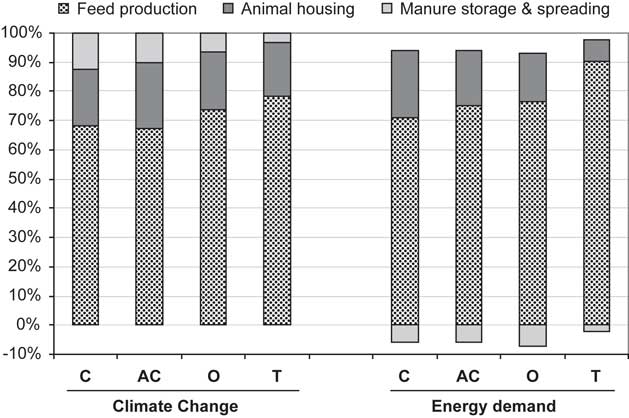
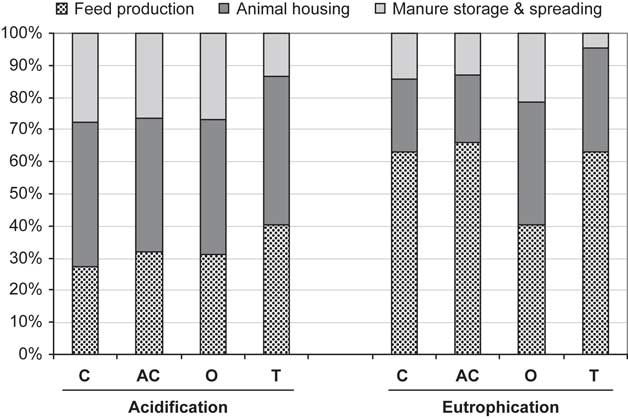
In all systems feed production contributed most to CC (65% to 75%), followed by animal housing and manure storage and spreading (Figure 2). Relative contributions of housing and manure tended to be lower for O and T systems than C and AC systems. Similarly, feed production contributed most to CED (Figure 2). The contribution of animal housing was lowest for T systems. The contribution of manure spreading to CED was negative because it replaced fertiliser applications. Animal housing contributed most to AP (40% to 50%), the relative contribution of feed production to AP (25% to 30%) being much less that for CC or CED (Figure 3). Feed production contributed most to EP, except for O systems (Figure 3).
Mean contribution of feed production, animal housing (including indoor manure storage) and outdoor manure storage and spreading to climate change and energy demand impacts of the four pig production systems studied. C=conventional; AC=adapted conventional; O=organic; T=traditional.
Mean contribution among feed production, animal housing (including indoor manure storage) and outdoor manure storage and spreading to acidification and eutrophication impacts of the four pig production systems studied (C=conventional; AC=adapted conventional; O=organic; T=traditional).
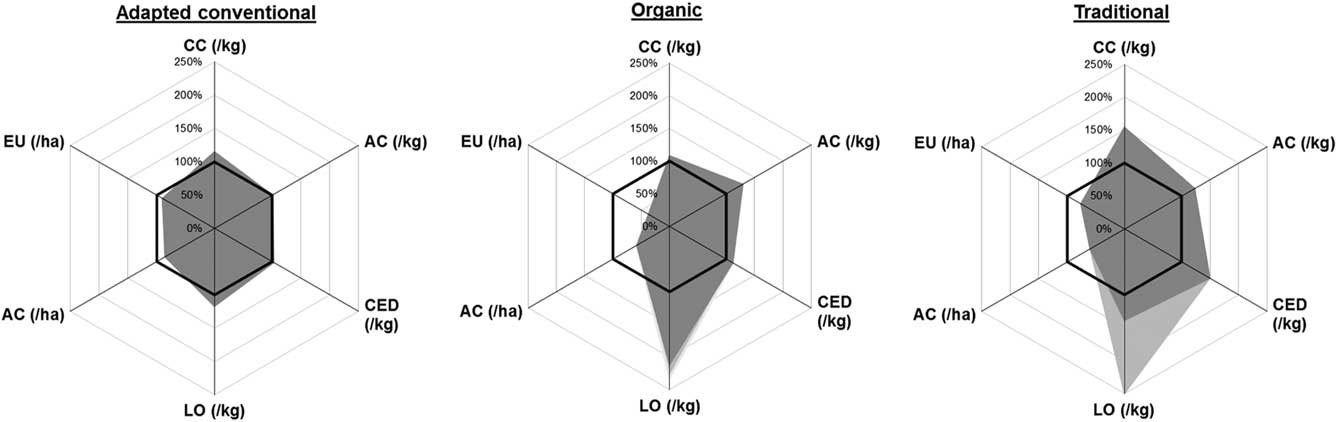
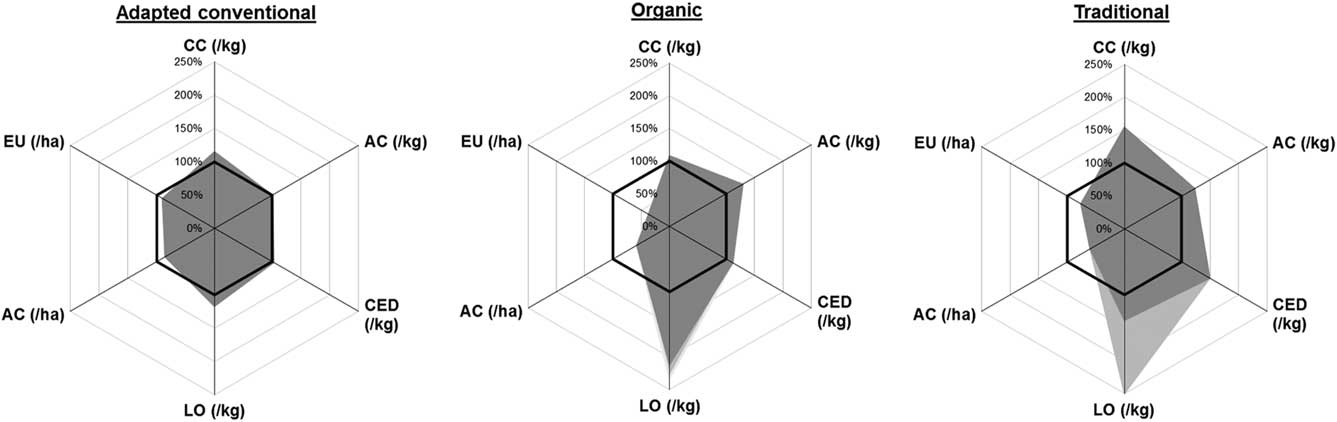
Compared with C systems, AC systems had slightly lower local (EU and AC per ha) but slightly higher global impacts (CC, LO, CED and AC per kg product), while T and O systems tended to have even lower local impacts and even higher global impacts (Figure 4). The EP of O systems was considerably lower.
Comparison of environmental impacts of the four types of systems (conventional, adapted conventional, traditional and organic). The values are expressed as percentage of the mean for the conventional system with a functional unit of either kg live weight (CC=climate change; AC=acidification; LO=land occupation; CED: cumulative energy demand) or ha of land used (EU=eutrophication; AC=acidification). For LO, dark grey corresponds to the land for feed production and light grey to the land for outdoor raising.
Multidimensional analysis
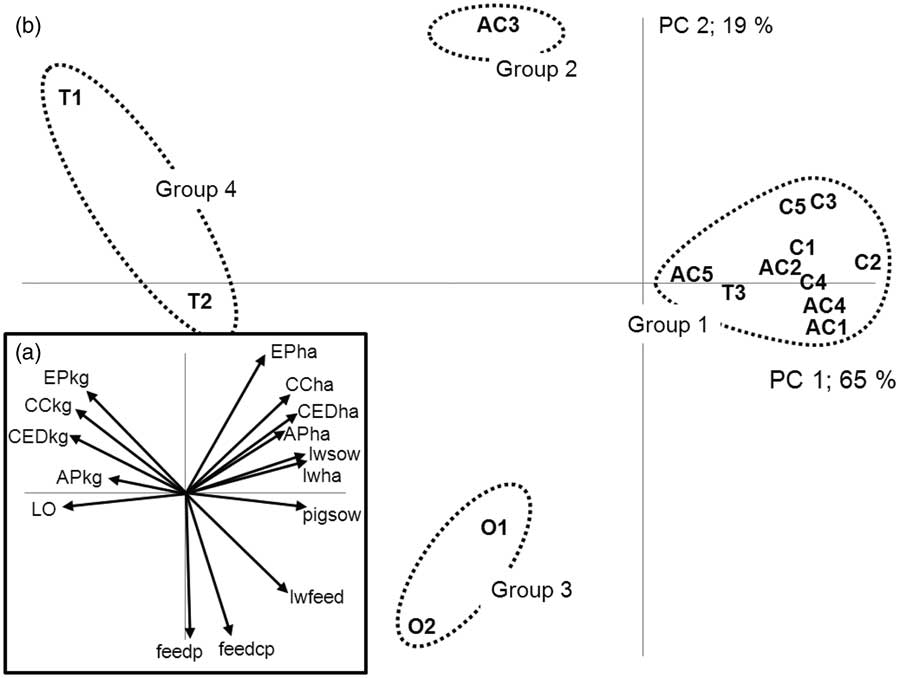
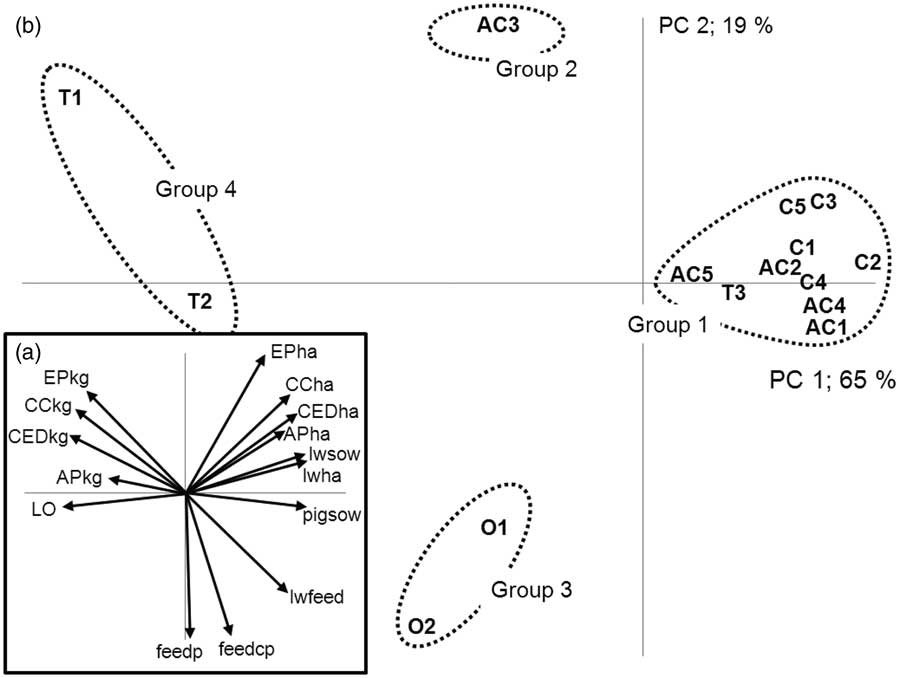
The first axis of the PCA clearly opposes, on one hand, environmental impacts expressed per kg LW and, on the other, animal performance, including feed efficiency, sow productivity and productivity of land (Figure 5a). Similarly, environment impacts expressed per ha are opposed to environmental impacts expressed per kg LW (Figure 5a). The graph of individual systems (Figure 5b) clearly differentiates the O systems, two of the three T systems (T1 and T2) and one AC system (AC5). While most C and AC systems are adjacent to each other, one T system (T3) is located among them.
Multidimensional principal component analyses (PCA) of environmental impacts and production characteristics, with (a) projection of variables on the first two axes and (b) projection of the 15 systems on the same axis.
Discussion
Comparison with previous studies
Environmental impacts of pig production estimated with LCA were recently reviewed by de Vries and de Boer (Reference de Vries and de Boer2010). CC values obtained in the present study (2.3 to 3.5 kg CO2-eq/kg LW) lie within the wider range of values (2.3 to 5.0 kg CO2-eq/kg LW) reviewed by de Vries and de Boer (Reference de Vries and de Boer2010). For C systems, this study’s mean CC (2.3 kg CO2-eq) is close to those of Basset-Mens and Van der Werf (Reference Basset-Mens and Van der Werf2005) and Nguyen et al. (Reference Nguyen, Hermansen and Mogensen2011): 2.3 and 2.2 kg CO2-eq, respectively. The mean CC for O systems (2.4 kg CO2-eq/kg LW) is lower than those of Halberg et al. (Reference Halberg, Hermansen, Kristensen, Eriksen, Tvedegaard and Petersen2010; 2.8 to 3.3 kg CO2-eq/kg LW) and Basset-Mens and Van der Werf (Reference Basset-Mens and Van der Werf2005; 4.0 kg CO2-eq/kg LW). The main reasons for the differences in O systems are likely the higher animal performance (i.e. sow productivity and feed efficiency) in our study and higher N2O emissions in the study by Basset-Mens and Van der Werf (Reference Basset-Mens and Van der Werf2005) owing to the use of straw bedding. Conversely, in agreement with our results, Williams et al. (Reference Williams, Audsley and Sandars2006) calculated similar CC values for C and O systems. T systems have higher CC impact per kg LW mainly because of their lower feed efficiency, related to the outdoor raising of traditional breeds. This results in a higher CC impact from feed production, which is only partially compensated by lower CH4 emissions owing to raising animals outdoors. AC systems have a slightly higher CC impact than C systems, mainly because of lower animal performance and more frequent use of straw bedding.
EP values obtained in the present study (0.016 to 0.034 kg PO4-eq/kg LW) lie within the range of values (0.012 to 0.038 kg PO4-eq/kg LW) reviewed by de Vries and de Boer (Reference de Vries and de Boer2010). For C systems, this study’s mean EP (0.019 kg PO4-eq) is close to those of Basset-Mens and Van der Werf (Reference Basset-Mens and Van der Werf2005) and Nguyen et al. (Reference Nguyen, Hermansen and Mogensen2011): 0.021 and 0.018 kg PO4-eq, respectively. The mean EP for O systems (0.016 kg PO4-eq/kg LW) is lower than those of Basset-Mens and Van der Werf (Reference Basset-Mens and Van der Werf2005; 0.022 kg PO4-eq/kg LW) and Halberg et al. (Reference Halberg, Hermansen, Kristensen, Eriksen, Tvedegaard and Petersen2010; 0.025 to 0.038 PO4-eq/kg LW), mainly because of higher animal performance in the present study. In the study by Williams et al. (Reference Williams, Audsley and Sandars2006), EP was reduced by 45% in O compared with C systems. Among the systems studied, O systems have the lowest EP owing to their much lower EP impacts of feed, resulting from the production of feed ingredients without mineral fertilisers, while T systems have the highest EP mainly because of their lower feed efficiency.
AP values obtained in the present study (0.044 to 0.057 kg SO2-eq/kg LW) also lie within the wider range of values (0.008 to 0.120 kg SO2-eq/kg LW) reviewed by de Vries and de Boer (Reference de Vries and de Boer2010). Mean AP for C and AC systems (0.044 kg SO2-eq) is essentially the same as those reported for similar systems by Basset-Mens and Van der Werf (Reference Basset-Mens and Van der Werf2005) and Nguyen et al. (Reference Nguyen, Hermansen and Mogensen2011): 0.044 and 0.043 kg SO2-eq, respectively. The mean AP for O systems (0.057 kg SO2-eq/kg LW) is higher than that of Basset-Mens and Van der Werf (Reference Basset-Mens and Van der Werf2005; 0.037 kg SO2-eq/kg LW) and similar to those of Halberg et al. (Reference Halberg, Hermansen, Kristensen, Eriksen, Tvedegaard and Petersen2010; 0.050 to 0.061 SO2-eq/kg LW). This is mainly related to the production of solid manure, which has lower NH3 emissions, in the study by Basset-Mens and Van der Werf (Reference Basset-Mens and Van der Werf2005).
CED values obtained in the present study (16 to 24 MJ/kg LW) lie within the wider range of values (10 to 25 MJ/kg LW) reviewed by de Vries and de Boer (Reference de Vries and de Boer2010). Mean CED for C and AC systems (16 MJ/kg LW) is close to those reported for similar systems by Basset-Mens and Van der Werf (Reference Basset-Mens and Van der Werf2005) and Nguyen et al. (Reference Nguyen, Hermansen and Mogensen2011): 15.9 and 13.6 MJ, respectively. The mean CED for O systems (18.1 MJ/kg LW) is slightly lower than that of Basset-Mens and Van der Werf (Reference Basset-Mens and Van der Werf2005; 22.2 MJ/kg LW). Because they use larger amounts of feed, T systems have the highest CED/kg LW in this study.
LO values obtained in the present study (4.1 to 10.6 m2/kg LW) lie partly outside the range of values (4.2 to 6.9 m2/kg LW) reviewed by de Vries and de Boer (Reference de Vries and de Boer2010) owing to the high LO values for T and O systems. For T systems, higher LO is because of outdoor fattening of pigs, which contributes almost 50% of LO/kg LW. Conversely, for O systems, higher LO is mainly because of the higher LO of feed production resulting from lower yields of organic crops. The mean LO for C systems (4.1 m2/kg LW) is close to the values reported for similar systems by Basset-Mens and Van der Werf (Reference Basset-Mens and Van der Werf2005) and Nguyen et al. (Reference Nguyen, Hermansen and Mogensen2011): 5.4 and 4.4 m2/kg LW, respectively. The mean LO for O systems (9.1 m2/kg LW) is close to the values published for this system by Basset-Mens and Van der Werf (2005; 9.9 m2/kg LW) and Halberg et al. (Reference Halberg, Hermansen, Kristensen, Eriksen, Tvedegaard and Petersen2010; 6.9 to 9.2 m2/kg LW).
When impacts are expressed per ha of land used, the ranking of systems changes greatly for most impacts. They are generally lowest for O systems, followed by T systems and highest for C systems, AC systems remaining close to C. The same effect of the functional unit on results was reported by Basset-Mens and Van der Werf (Reference Basset-Mens and Van der Werf2005) when comparing three production systems with characteristics similar to our definitions of C, AC and O systems.
Multidimensional analysis
Multidimensional analysis clearly indicates that systems with lower animal productivity per sow, per kg of feed or per ha have higher environmental impacts per kg LW but lower impacts per ha. Feed CP and P contents seem to have only limited influence on the results and mainly differentiate the O system. Among individual systems, T3 was classified as traditional because of cross breeding with a local breed, but its performance and housing were similar to those of C systems. Conversely, systems T1 and T2 differed greatly, with the use of local purebred pigs and free ranging during the fattening period. The location of AC3 closer to the T systems could be explained by its use of slow-growing animals with lower feed efficiency; however, its housing was similar to that of intensive systems, for which it was classified as AC.
Functional unit and comparison of systems
The use of multiple functional units is common in agricultural LCAs but remains under debate. For example, Haas et al. (Reference Haas, Wetterich and Kopke2001) used land area, livestock units and the amount of milk produced as functional units for dairy production. Similarly, Basset-Mens and Van der Werf (Reference Basset-Mens and Van der Werf2005) used 1 kg of pig LW and 1 ha as functional units for pig production. As suggested by some authors (Nemecek et al., Reference Nemecek, Frick, Dubois and Gaillard2001; Payraudeau and Van der Werf, Reference Payraudeau and Van der Werf2005), these functional units refer to two essential functions of agriculture: food production and land preservation. Our results clearly indicate that the choice of functional unit has a major effect on the ranking of environmental impacts of systems (Haas et al., Reference Haas, Wetterich and Kopke2001; Cederberg and Darelius, Reference Cederberg and Darelius2002; Basset-Mens and Van der Werf, Reference Basset-Mens and Van der Werf2005). The degree of intensification inversely correlates with the environmental impact per kg, whereas the opposite is found when the impact is expressed per ha. This illustrates that neither intensive nor extensive farming systems have inherently lower environmental impacts (Nemecek et al., Reference Nemecek, Frick, Dubois and Gaillard2001). For example, EP per kg LW is lowest for C systems, which are generally located in regions with high densities of animal production that have significant eutrophication problems (Peyraud et al., Reference Peyraud, Cellier, Aarts, Béline, Bockstaller, Bourblanc, Delaby, Donnars, Dourmad, Dupraz, Durand, Faverdin, Fiorelli, Gaigné, Girard, Guillaume, Kuikman, Langlais, Le Goffe, Le Perchec, Lescoat, Morvan, Nicourt, Parnaudeau, Peyraud, Réchauchère, Rochette, Vertes and Veysset2012). Conversely, T systems, with the highest EP per kg LW, are more often located in regions with low production intensities and no eutrophication problems. O systems have much lower EP mainly because of the lower EP of organic feed ingredients. For T systems, lower local impacts are mainly because of higher LO (outdoor fattening of pigs), while higher global impacts are mainly because of the low feed efficiency of animals.
Although the number of systems is limited, the results also give some indication about the variability of impacts within category of system. For instance, variability is much lower for C systems than AC systems (CV of 4% v. 23% for CC, 14% v. 36% for EP and 4% v. 16% for CED, respectively). Variability in impacts is also higher for non-conventional (T and O) than conventional systems. This indicates that, on average, C systems have relatively similar environmental impacts among countries, whereas the other systems differ from each other much more. This is related, on one hand, to animal performance, which is much less homogenous in non-conventional systems and, on the other, to their larger diversity in type of housing and manure management, which affects the emission factors of several gases. This is in line with the results of Bonneau et al. (Reference Bonneau, Antoine-Ilari, Phatsara, Brinkmann, Hviid, Christiansen, Fàbrega, Rodríguez, Rydhmer, Enting, de Greef, Edge, Dourmad and Edwards2011), who observed a wide diversity of differentiation claims in differentiated systems, associated with diversity in pig genotypes, type of housing and manure management. However, a precise statistical evaluation of environmental impacts, and their variation factors, within and between systems would require the use of individual data from a larger number of farms.
Conclusion
The diversity of pig farming systems considered in the present study results in large variability in all environmental impacts; however, the ranking of the systems depends on impact category and which functional unit is used. The degree of intensification inversely correlates with environmental impact per kg LW produced, whereas the opposite is found when the impact is expressed per ha land used. There is a clear distinction between the types of systems depending on the type of impact considered (local v. global). This would indicate that the choice of the best system is highly dependent on local circumstances, especially the sensitivity of the environment to local impacts. According to the results of this study, LCA appears suitable for assessing environmental impacts of pig production systems and can contribute to the overall assessment of sustainability when different functional units are used for global and local impacts, as presented in a companion article (Bonneau et al., Reference Bonneau, Klauke, Gonzàlez, Rydhmer, Ilari-Antoine, Dourmad, de Greef, Houwers, Cinar, Fàbrega, Zimmer, Hviid, Van der Oever and Edwards2014b).
Acknowledgement
The authors gratefully acknowledge European Community financial support from the Sixth Framework Programme for Research, Technological Development and Demonstration Activities for the Integrated Project Q-PorkChains (FOOD-CT-2007-036245).
Disclaimer: The views expressed in this study are the sole responsibility of the authors and do not necessarily reflect the views of the European Commission. Neither the European Commission nor any person acting on behalf of the Commission is responsible for the use that might be made of the information. The information in this study is provided as it is, and no guarantee is given that the information is fit for any particular purpose. The user, therefore, uses the information at its sole risk and liability.