Introduction
Diabetes mellitus (DM) is a metabolic disease caused by various factors and is characterized by chronically high blood glucose with disturbances in carbohydrate, fat and protein metabolism. These disorders occur due to decreased insulin secretion, decreased insulin function or both (Cole and Florez, Reference Cole and Florez2020). It is estimated that 382 million people worldwide suffer from diabetes and its prevalence is 8.3% (Assaad-Khalil, Reference Assaad-Khalil2020). Type 2 diabetes (T2DM) is caused by insulin resistance, which may be associated with a relative decrease in insulin secretion (Holst, Reference Holst2020). This condition may lead to long-term damage and malfunction of different organs. Some of these complications affect the male reproductive system and may result in sexual dysfunction or (sub)infertility (Habadi et al., Reference Habadi, Alrashidi, Mutaki, Alshammari, Alothayqi, Alenezi, Hethwell, Alruwaily, Aloufi, Almulla and Al-Bogami2021).
Many studies have reported the adverse effects of diabetes on sexual function that appear in sperm parameters, DNA fragmentation and chromatin quality (Kilarkaje et al., Reference Kilarkaje, Al-Hussaini and Al-Bader2014; Imani et al., Reference Imani, Talebi, Fesahat, Rahiminia, Seifati and Dehghanpour2021; Simas, et al., Reference Simas, Mendes, Fischer, Vendramini and Miraglia2021). Diabetes can also affect the epigenetic profile during spermatogenesis and this epigenetic disorder might be inherited through the germ cell line and be passed on to future generations (Ding et al., Reference Ding, Liu, Liu, Pan, Guo, Sheng and Huang2015). Proper germ cell function is paramount for fertility, embryogenesis and child health. Infertility, is generally defined as failure to successfully conceive after at least 12 months of regular unprotected sexual intercourse. Almost half of infertility cases are male originated (Fields et al., Reference Fields, Chard, James, Treasure and Development Group2013). Epidemiologically, the male factor of infertility is influenced by environmental and lifestyle factors such as obesity, smoking and exposure to toxic substances such as organophosphates (Mima et al., Reference Mima, Greenwald and Ohlander2018). There is a scientific background that suggests that the sperm of subfertile males might carry a high frequency of abnormally imprinted genes. Conversely, assisted reproductive technology (ART) may predispose the spermatozoa or even the offspring to epigenetic alterations due to environmental and iatrogenic factors (Gosden et al., Reference Gosden, Trasler, Lucifero and Faddy2003). These observations drew attention to the epigenetic role in human spermatozoa (Åsenius et al., Reference Åsenius, Danson and Marzi2020).
Epigenetics refers to inherited mitotic or meiotic changes in the gene expression that do not involve changes in DNA sequence. The term generally refers to three distinct but related mechanisms that alter chromatin access to the transcriptional machinery or regulate gene expression at the post-translational level: DNA alterations, CpG methylation, post-translational modifications of histones and non-coding RNAs (Desai et al., Reference Desai, Jellyman and Ross2015). Among these, DNA methylation has been further investigated due to its relative stability and the availability of inexpensive tools for its analysis (Daxinger and Whitelaw, Reference Daxinger and Whitelaw2012).
In non-human mammals, sperm methylation has been shown to respond to environmental and physiological changes such as changes in diet, toxins and psychological stress (Dias and Ressler, Reference Dias and Ressler2014; Radford et al., Reference Radford, Ito, Shi, Corish, Yamazawa, Isganaitis, Seisenberger, Hore, Reik, Erkek, Peters, Patti and Ferguson-Smith2014; de Castro Barbosa et al., Reference de Castro Barbosa, Ingerslev, Alm, Versteyhe, Massart, Rasmussen, Donkin, Sjögren, Mudry, Vetterli, Gupta, Krook, Zierath and Barrès2016; Youngson et al., Reference Youngson, Lecomte, Maloney, Leung, Liu, Hesson, Luciani, Krause and Morris2016; Sakai et al., Reference Sakai, Ideta-Otsuka, Saito, Hiradate, Hara, Igarashi and Tanemura2018; Watkins et al., Reference Watkins, Dias, Tsuro, Allen, Emes, Moreton, Wilson, Ingram and Sinclair2018). In addition, some studies have shown that acquired traits can induce epigenetic changes in the spermatozoa of mice (Wei et al., Reference Wei, Yang, Wei, Zhao, Hou, Schatten and Sun2014; Huypens et al., Reference Huypens, Sass, Wu, Dyckhoff, Tschöp, Theis, Marschall, Hrabě de Angelis and Beckers2016). Unfortunately, compared with somatic tissues, such as blood, little information is available on sperm methylation.
At this time, the significant increase in diabetes prevalence is also very important in the field of infertility due to its effects on factors affecting the germ cell line. Although much attention has been paid to the possible effects of transgenerational inheritance on human health, few studies have been conducted in this area. Accordingly, the aim of this case–control study was to evaluate the alteration in methylation status of the H19 differentially methylated region (H19-DMR), MEST-DMR, and SNRPN-DMR in the sperm of men with T2DM.
Materials and methods
Ethical considerations
The samples used in this study were collected from individuals who had been referred to the infertility clinic of Royan Research Institute, Iran during the period 2019–2021 and who had signed an informed consent. This research and the consent forms were approved by the National Committee of Ethics in Biomedical Research with the ethics code IR.ACECR.ROYAN.REC.1398.60.
Study participants
In total, 42 men (27–40 years old) participated in this study, 14 individuals were assigned to each group. Three groups were defined: normozoospermic non-diabetic (control), normozoospermic diabetic (D.N) and non-normozoospermic diabetic (D.Non-N). According to World Health Organization (WHO) 2010 guidelines, normal sperm parameters were considered to be semen volume ≥ 1.5 ml, sperm concentration ≥ 15 × 106 ml, progressive motility ≥ 32%, motility ≥ 40% and normal morphology ≥ 4%, and vitality ≥ 58% (Cooper et al., Reference Cooper, Noonan, von Eckardstein, Auger, Baker, Behre, Haugen, Kruger, Wang, Mbizvo and Vogelsong2010). All of the individuals had a normal body mass index (BMI) (18.5–25), were nonsmokers, non-alcoholics, and had no history of cancer, autoimmune disease, varicocelectomy or pelvic surgery. In addition, patients treated with insulin were excluded and only patients with diabetes who were orally treated and under control were included. A questionnaire was completed for each patient that included demographic information (age, height and weight, duration of DM, medicine consumption, environmental exposures, smoking, alcohol consumption, and medical history). Then, BMI was calculated using the equation in which the weight is divided by height squared (kg m−2).
Sample collection
Blood samples were collected after 12 h of fasting and poured into ethylenediamine tetraacetic acid (EDTA)-coated tubes. Blood samples were centrifuged for 15 min at 3000 rpm for serum isolation. Semen samples were collected after 2–5 days of sexual abstinence.
Determination of serum biochemical factors
Serum fasting blood sugar (FBS) and glycosylated haemoglobin (HBA1c) levels were measured using the Pars Azmoun-Iran and NycoCard-Norway kits, respectively, according to the manufacturers’ instructions.
Evaluation of semen and sperm parameters
After collection of each sample volume, pH was assessed. Once the liquefaction was complete through keeping the sample at 37°C for 30 min, 10 µl of semen sample was placed in a sperm counting chamber. The analysis of sperm parameters including sperm count, total motility and progressive motility was commenced under a light microscope equipped with a computer-assisted sperm analysis system (CASA, version 5.1; Microptic, Barcelona, Spain) in at least five microscopic fields. In addition, the achieved data of each patient were considered according to the 5th edition of the WHO guidelines.
Morphology and viability
Sperm morphological evaluation was performed using the Papanicolaou staining technique on smears of unwashed semen following the protocol outlined in the WHO guidelines 5th edition. For viability assessment, equal volumes of eosin Y–nigrosin dyes and the unwashed semen sample were mixed to a final 10-μl volume (5 μl dye mixture + 5 μl semen). After 30 s, a smear was prepared and was left to air dry. A bright field optic microscope and ×100 magnification (LABOMED CxL) were applied to determine live and dead cells. At least 200 spermatozoa were evaluated per slide.
Assessment of sperm DNA fragmentation
The sperm DNA fragmentation (SDF) index was evaluated using the sperm chromatin structure assay technique. For this purpose, sperm samples were diluted to 1 × 10⁶ cells in 100 μl human tubal fluid (HTF) medium to a final volume of 200 μl. Then, the samples were mixed for 30 s with an acidic solution containing 150 mM NaCl, 0.08 N HCl molar, and Triton X-100. Then the slides were stained with 6 µg/ml acridine orange for 3 min. In total, 5000–10,000 spermatozoa were examined using flow cytometry and the percentage of spermatozoa with DNA fragmentation was determined by evaluating the increase in red fluorescence signals. Phosphate-buffered saline (PBS) solution along with the dye solution was used as the control. Finally, the results of flow cytometry readings were evaluated using FlowJo software and reported as the percentage of fragmentation (Ribas-Maynou et al., Reference Ribas-Maynou, García-Peiró, Fernández-Encinas, Abad, Amengual, Prada, Navarro and Benet2013).
Evaluation of global methylation
The degree of global methylation in spermatozoa was measured using the 5-methyl cytosine antibody (ab73938) (Abcam, Cambridge, UK) as the primary antibody. Samples were fixed with 100 μl 95% ethanol for 15 min, then centrifuged and the cell precipitate was washed with 200 μl PBS-T. Then, it was incubated with 100 μl retrieval antigen (sodium citrate buffer) for 20 min at room temperature. After washing, a 15-min incubation with Triton X-100 2% was performed at room temperature. It was washed again and incubated with 3–5% blocking solution (5% bovine serum albumin or goat serum) at 4°C for 1 h. Primary antibodies were then added to the samples and incubated at 4°C overnight. After this incubation and washing, the secondary antibody (ab96879) was added and the mixture was incubated at 4°C for 4 h. After three washes, flow cytometry measurements were performed.
Evaluation the methylations of imprinting genes
Semen processing
The simple wash method was used to remove the remaining plasma. After washing, the samples were examined under a microscope to ensure that no cellular contaminants were present. The isolated spermatozoa were added to HTF medium supplemented with 10% human serum albumin and stored in an incubator at 37°C and 5% CO2 until further examination.
DNA extraction
Processed semen samples as mentioned earlier, were used to extract sperm genomic DNA (Montjean et al., Reference Montjean, Ravel, Benkhalifa, Cohen-Bacrie, Berthaut, Bashamboo and McElreavey2013). As Luján and colleagues described, freeze and thaw were performed to remove any sample contamination with somatic cells (Luján et al., Reference Luján, Caroppo, Niederberger, Arce, Sadler-Riggleman, Beck, Nilsson and Skinner2019).
The DNAs of peripheral blood mononuclear cells (PBMCs) were extracted from blood samples of normal males to serve as the control. DNA extraction from blood was done through the salting-out method.
Bisulfite conversion
In total, 2 μg of genomic sperm DNA were treated with the sodium sulfite kit (Epitect Bisulfite, Qiagen, Germany) according to the manufacturer’s protocol. In this method, the methylated cytosines are not changed, but the unmethylated cytosines are converted to uracil and then to thymidine through replication. The quality of genomic DNA of sperm and blood and their bisulfite-modified DNA was assessed using agarose gel electrophoresis.
Methylation-sensitive high-resolution melting (MS-HRM)
The Step-One plus Real Time PCR method (Applied Biosystems, USA) was used to perform PCR amplification and HRM analysis. PCR was performed in a final volume of 20 μl with 4 μl 5× HOT FIREPol EvaGreen qPCR Mix Plus (ROX) (Solis BioDyne, Estonia), 0.5 μM forward primer, 0.5 μM reverse primer and 20 ng bisulfite converted DNA, and H2O. All of the assays were done in technical duplicates. PCR cycling and melting conditions were as follows; one cycle of 95°C for 12 min; 45 cycles of 95°C for 15 s, annealing temperature of each gene for 30 s, 72°C as extension temperature for 30 s; one cycle of 95°C for 15 s, 60°C 1 min, a melt from 60°C to 95°C rising 0.3°C s−1, and 95°C 15 s. Methylation level of imprinting genes H19, MEST and SNRPN in samples were assumed in comparison with prepared methylation serials MS-HRM v.3.0.1 software (Applied Biosystems, USA). Methylation percentages of the samples were calculated using the Polyfit interpolating function in MATLAB software compared with the methylation standards (Rahat et al., Reference Rahat, Mahajan, Bagga, Hamid and Kaur2017).
Preparation of methylation standards
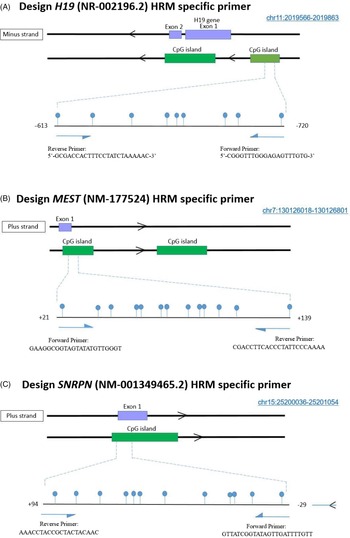
Methylation standards consisting of fully methylated and fully non-methylated strands were prepared prior to the reaction. At the first step, DNA was extracted from PBMCs using the salting-out method. For the non-methylated standard, whole genome amplification (WGA) was performed two times consecutively using the REPLI-g Mini kit (Qiagen, Germany) on peripheral blood DNA to replace all of the nucleotides with new non-methylated ones provided through WGA. For preparation of the methylated standard, blood DNA was subjected to full methylation using the M.SssI kit (CpG methyltransferases, Thermo Fisher Scientific). Then, these standards were also treated with bisulfite. By combining appropriate ratios of fully methylated and fully unmethylated DNA, a series of standard reference DNAs was prepared for each gene with different methylation percentages ranging from 0% to 100%. Firstly, a control of 50% adjusted fully methylated and 50% adjusted fully unmethylated (50%:50%) was prepared and the appropriate temperature at which the methylated PCR product and the non-methylated PCR product amplified to the same extent and the produced peaks of equal size were determined, according to Wojdacz’s protocol (Wojdacz et al., Reference Wojdacz, Dobrovic and Hansen2008). The methylation series and patient samples were then brought to the temperature mentioned. The schematic view of the CpG islands probed from the DNA of each gene for methylation and methylated cytosines in this region using Human Assembly: Feb. 2009 (GRCh37/hg19) is shown in Figure 1.
Schematic representation of the studied CpG islands in the (A) H19, (B) MEST and (C) SNRPN genes. The number and location of each CpG are shown as a lollipop.

Due to hypermethylation of the H19 gene in human sperm, a series with 50, 75, 90, 95, 96, 97, 98 and 99% methylation was prepared after the preparation of controls (0% and 100% methylation). For the gene MEST, due to its hypomethylation in sperm, a serial methylation was prepared as 50, 25, 10, 5, 4, 3, 2 and 1% using 0% and 100% methylation controls. For the SNRPN gene, serial methylation was prepared as 50, 25, 10, 5, 4% 3, 2 and 1% using 0% and 100% methylation controls. The MS-HRM reaction was performed for the MEST and SNRPN genes using specific primers (Table 1) and based on the principles given by Wojdacz, a primer was also designed for the H19 gene. To amplify the methylated and non-methylated sequences to the same extent, primers containing at least one CpG in the primary nucleotides at the 5′ head of each primer were used.
Sequence of primers used in MS-HRM technique

Statistical analysis
Statistical analysis of the achieved data was performed using SPSS software (version 16), and GraphPad Prism (version 5.0). All values in this study are reported as mean ± standard error (SE). Normal distribution of each data was assessed using the Kolmogorov–Smirnov test. For normal distributed variables, the one-way analysis of variance (ANOVA) test was done followed by Tukey’s post-hoc test. For the rest of the variables, the Kruskal–Wallis test was done to calculate significant differences of the means, followed by Dunne’s post-hoc and Bonferroni correction. The data are reported with a confidence interval of at least 95%.
Results
Demographic and biochemical characteristics
Age, BMI, biochemical characteristics, and duration of T2DM of the study participants are presented in Table 2. There was no significant difference between the ages of the study subjects. BMI of the D.Non-N group was higher than that of the control group (P < 0.05). Generally, FBS and HBA1c were significantly higher in both diabetes groups (P < 0.01) but the two were not significantly different from each other. Diabetes mellitus duration was significantly longer in D.Non-N group compared with the D.N group (P < 0.01).
Demographic and biochemical characteristics of the study participants

Demographic characteristics of 42 participants in the study (14 control, 14 D.N, 14 D.Non-N). BMI, body mass index; FBS, fasting blood sugar; HBA1c, glycosylated haemoglobin. Control: normozoospermic non-diabetic individuals; D.N: normozoospermic T2DM patients; D.Non-N: non-normozoospermic T2DM patients. Data are presented as mean ± SE.
a,b Different letters indicate significant differences among the groups.
Sperm parameters
To determine the study groups and measure the effects of diabetes on sperm parameters of patients, semen analysis was done. Table 3 shows the sperm parameters in each group, which indicate similarity between the control and D.N group except for semen pH. There was a significant difference between all parameters of the D.N and D.Non-N group mentioned in this table with the exception of seminal pH (P < 0.01).
Sperm parameters including semen volume, pH, sperm concentration (×106/ml), morphology, progressive motility, total motility and viability and also SDF in the control and study groups

SDF, sperm DNA fragmentation. Control: normozoospermic non-diabetic individuals; D.N: normozoospermic T2DM patients; D.Non-N: non-normozoospermic T2DM patients. Data are presented as mean ± SE.
a,b Different letters indicate significant differences among the groups.
Sperm DNA fragmentation
The results showed that SDF was higher in both diabetic groups compared with the control (P < 0.01). This rate was slightly higher in D.Non-N individuals, but the trend did not reach statistical significance (Table 3).
Global methylation
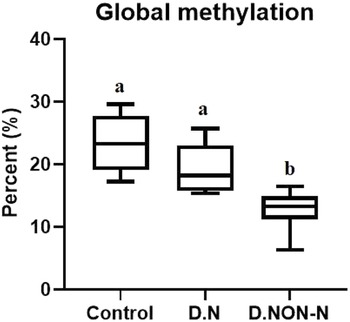
The percentage of global methylation was higher in the control group compared with the two diabetic groups, but this difference reached significance only for D.Non-N (P < 0.01) (Figure 2).
Box-and-whisker plot shows the comparison of global methylation levels in the studied groups (P < 0.01). Control group was normozoospermic non-diabetic individuals, D.N stands for normozoospermic type 2 patients and D.Non-N stands for non-normozoospermic type 2 diabetic patients. a,bDifferent letters in the columns indicate a significant difference among the groups.

Methylation status
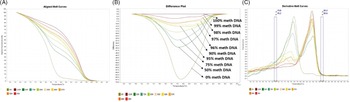
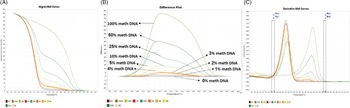
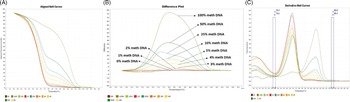
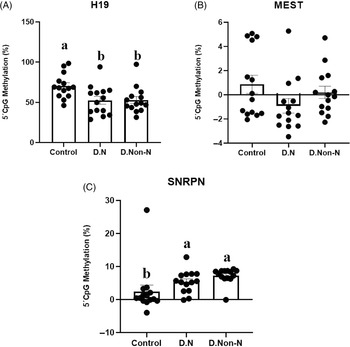
Methylation levels of the DMRs of H19, MEST, and SNRPN genes were evaluated using standard plots of the methylation series generated for each gene (Figures 3, 4 and 5, respectively). The results, as shown in Figure 6, indicated that H19-DMR had significant hypomethylation in the D.N and D.Non-N groups compared with the control (P < 0.05). Moreover, in the D.N and D.Non-N groups MEST-DMR was hypomethylated, but the hypomethylation was more dramatic in the D.N group (P < 0.07). SNRPN-DMR showed significant hypermethylation in the D.N and D.Non-N groups compared with the control (P < 0.01).
MS-HRM standard curves of H19 promoter region. (A) Aligned melt curves, (B) difference plot and (C) derivative melt curves of 100, 99, 98, 97, 96, 95, 90, 75%, and 50% and 0% methylated DNA standards, normalized to the 100% methylated DNA. Aligned melt curves (A) show that the 100% methylated DNA had a higher melting temperature compared with unmethylated DNA. The melting temperatures of 99, 98, 97, 96, 95, 90, 75%, and 50% methylated DNA standards were between the 100% and unmethylated DNA standards related to the percentage methylation. (C) Negative first derivative of the melting curve (C) means that the 100% methylated and unmethylated DNA had one peak, but 99, 98, 97, 96, 95, 90, 75%, and 50% standards had two melt peaks demonstrating each DNA standard.

MS-HRM standard curves of MEST differentially methylated region (DMR). (A) Aligned melt curves, (B) difference plot and (C) derivative melt curves of 100, 50, 25, 10, 5%, 4% 3, 2, 1% and 0% methylated DNA standards, normalized to the 0% methylated DNA. Aligned melt curves (A) show that the 100% methylated DNA had a higher melting temperature compared with unmethylated DNA. The 50, 25, 10, 5, 4, 3, 2 and 1% methylated DNA standards had a melting temperature between the 100% and unmethylated DNA standards representative of the methylation percentage. (C) Negative first derivative of the melting curve (C) and shows that only the 100% methylated and unmethylated DNA had one melt peak, and the rest had two melt peaks respective of each of the DNA standards.

MS-HRM standard curves of SNRPN differentially methylated region (DMR). (A) Aligned melt curves, (B) difference plot and (C) derivative melt curves of 100, 50, 25, 10, 5, 4, 3, 2, 1% and 0% methylated DNA standards, normalized to the 0% methylated DNA. Aligned melt curves (A) show that the 100% methylated DNA had a higher melting temperature compared with unmethylated DNA for each gene analyzed using MS-HRM. The 50, 25, 10%, 5, 4, 3, 2% and 1% methylated DNA standards had a melting temperature situated between the 100% and unmethylated DNA standards that is related to the percentage methylation of the sample. The graph of the negative first derivative of the melting curve (C) shows that the 100% methylated and unmethylated DNA had only one melt peak, whereas 50, 25, 10, 5, 4, 3, 2% and 1% standards had two melt peaks representative of each of the DNA standards.

Comparison of (A) H19 (P < 0.05), (B) MEST (P = 0.07) and (C) SNRPN (P < 0.01) CpG methylation percentage between the studied groups. Control group was normozoospermic non-diabetic individuals, D.N stands for normozoospermic type 2 diabetic patients and D.Non-N stands for non-normozoospermic type 2 diabetic patients. n = 14 in each group. Different letters on columns indicate significant difference among the groups.

Discussion
Identification of novel biomarkers associated with male infertility is an important topic in health studies. Spermatozoa are the most differentiated mammalian cells that use their stored energy to survive and successfully transfer male haploid DNA (Rodriguez-Martinez, Reference Rodriguez-Martinez2007). Spermatozoa also require energy to move to the epididymis after puberty (Satouh and Ikawa, Reference Satouh and Ikawa2018). With the exception of some metabolites, such as lactate and citrate, spermatozoa mainly use sugar as fuel (Bucci et al., Reference Bucci, Spinaci, Galeati and Tamanini2020). Therefore, glucose metabolism disorders may affect sperm function. Investigating the mechanisms involved in such diseases on sperm may contribute to a better understanding of their pathogenesis and the development of more efficient treatments.
In the present study, we focused on the global methylation and methylation alterations of some imprinting genes in sperm and semen quality indices in T2DM patients. For this purpose, sperm quality indices of case and control subjects were first determined. Then, global methylation of samples was measured using flow cytometry. In the next step, methylation of DMRs of the three imprinting genes H19, MEST and SNRPN were evaluated. The results showed that the global methylation and the methylation level of H19 and MEST genes were diminished in patients suffering from T2DM, whereas the SNRPN gene was hypermethylated.
Although T2DM is known to cause many systemic problems, male fertility disorders were not considered as its noticeable consequences until recently. Moreover, diabetes has been scarcely studied as a cause of infertility due to the paucity of reports and lack of consistent results (La Vignera et al., Reference La Vignera, Condorelli, Vicari, D’Agata and Calogero2012). However, this view has changed after the discovery of molecular changes that affect sperm quality and function in T2DM. It is worth mentioning that the duration of T2DM may play a role in the intensity of testosterone shortage or even most of the fertility adverse effects of diabetes. Therefore the patients suffering from T2DM who had normal sperm parameters have been diagnosed with T2DM for a shorter period compared with the other diabetic group and also showed less prominent changes in sperm factors.
Mitochondrial membrane potential (MMP) is the most important parameter that determines mitochondrial function and regulating sperm motility. It has been shown that, in diabetic patients, decreased progressive sperm motility is associated with an increase in the number of sperm with low MMP (Amaral et al., Reference Amaral, Lourenço, Marques and Ramalho-Santos2013). This was consistent with the reduction of total sperm motility and percentage of progressively motile spermatozoa in D.Non-N group. Semen volume was also estimated to be lower in patients with diabetes compared with the control group. This might be attributable to testosterone levels. Seminal vesicles, which produce ∼60% of ejaculate volume, are dependent on testosterone. Patients with T2DM produce less total testosterone, which could explain the low sperm volume (Ali et al., Reference Ali, Shaikh, Ashfaqsiddiqi and Siddiqi1993).
It has been shown that global sperm DNA methylation is negatively correlated with sperm chromatin density and DNA integrity. The probable reason might be that proper sperm DNA methylation provides chromatin compression and contributes to sperm DNA protection (Miller, Brinkworth et al., Reference Miller, Brinkworth and Iles2010). DNA damage, such as oxidative damage, can also inhibit sperm DNA methylation (Tunc and Tremellen, Reference Tunc and Tremellen2009). It has been shown that oxidative DNA damage in somatic cells can disrupt normal DNA methylation (Valinluck et al., Reference Valinluck, Tsai, Rogstad, Burdzy, Bird and Sowers2004). Global sperm DNA methylation has been reported to have strong correlation with chromatin density, which suggests that chromatin formation and proper DNA methylation is closely associated with spermatogenesis. However, the timing of these events is not yet known (Montjean et al., Reference Montjean, Zini, Ravel, Belloc, Dalleac, Copin, Boyer, McElreavey and Benkhalifa2015).
The H19 gene is one of the imprinting genes that has been investigated in many studies about infertile men (Ghafouri-Fard et al., Reference Ghafouri-Fard, Esmaeili and Taheri2020). In humans, H19 is expressed in a limited number of organs over a restricted period of embryonic life. During embryonic life, expression of H19 is required for fetal growth and differentiation (Santi et al., Reference Santi, De Vincentis, Magnani and Spaggiari2017). This activity suggests that H19 is primarily involved in tissue differentiation. Although the gene MEST is involved in embryonic development, adipocyte differentiation and angiogenesis, its essential molecular activity is still unknown. Alteration of the MEST gene methylation pattern has been associated with certain cancers in animal models (Velker et al., Reference Velker, Denomme, Krafty and Mann2017). SNRPN also encodes small nucleus ribonucleotide polypeptide N, which plays an important role in tissue differentiation and organ specificity (Zhao et al., Reference Zhao, Chang, Liu, Wang, Zhang, Lu, Zhang, Zhang and Wang2020).
It has been suggested that alterations in paternal H19 methylation may be associated with male infertility (Marques et al., Reference Marques, Costa, Vaz, Carvalho, Fernandes, Barros and Sousa2008). Sperm concentration and motility are the two parameters most affected by H19 methylation. Moreover, a positive and significant correlation was observed between H19 methylation and sperm count in oligozoospermic individuals and also with sperm motility in asthenozoospermic individuals (Dong et al., Reference Dong, Wang, Zou, Chen, Shen, Xu, Zhang, Zhao, Ge, Gao, Hu, Song and Wang2017). Hypomethylation of the paternal imprinting of the H19 gene is associated with a decrease in sperm count whereas, for the MEST and SNRPN genes, hypomethylation of the maternal imprinting can reduce sperm motility and normal morphology (Dong et al., Reference Dong, Wang, Zou, Chen, Shen, Xu, Zhang, Zhao, Ge, Gao, Hu, Song and Wang2017; Nasri et al., Reference Nasri, Gharesi-Fard, Namavar Jahromi, Farazi-Fard, Banaei, Davari, Ebrahimi and Anvar2017). The association between aberrant methylation of imprinted genes and oligozoospermia has been reported previously (Hammoud et al., Reference Hammoud, Purwar, Pflueger, Cairns and Carrell2010). But in the current study, abnormal DNA methylation was observed in the normozoospermic diabetic patients as well. This observation can be considered as a first report.
Kobayashi and colleagues reported that most men with moderate or severe oligozoospermia have a specific methylation pattern in both the paternal and maternal gene series (Kobayashi et al., Reference Kobayashi, Sato, Otsu, Hiura, Tomatsu, Utsunomiya, Sasaki, Yaegashi and Arima2007). Marques and co-authors compared the methylation profiles of H19 and MEST in patients with oligozoospermia with normal individuals. They found that the H19 gene was hypomethylated or completely unmethylated in patients with moderate to severe oligozoospermia, while the methylation of the MEST gene showed no difference (Marques et al., Reference Marques, Costa, Vaz, Carvalho, Fernandes, Barros and Sousa2008). Alterations in methylation of MEST-DMR was not significant in our study and it is consistent with Marques and colleagues’ results in oligozoospermic men. Hammoud and co-authors examined the maternal methylation of SNRPN and MEST and the paternal methylation of H19 in patients with oligozoospermia and showed that the SNRPN and MEST genes were hypermethylated and the H19 gene was hypomethylated (Hammoud et al., Reference Hammoud, Purwar, Pflueger, Cairns and Carrell2010). Our findings are partially in accordance with previous reports.
For example our MS-HRM results showed the mentioned DMR of H19 was hypomethylated and the DMR of SNRPN was hypermethylated, which was similar to the reports of Hammoud et al. (Reference Hammoud, Purwar, Pflueger, Cairns and Carrell2010), Kläver et al. (Reference Kläver, Tüttelmann, Bleiziffer, Haaf, Kliesch and Gromoll2013) and Li et al. (Reference Li, Hao, Wang, Yi and Jiang2016).
Changes in methylation of H19, MEST and SNRPN genes have been addressed in many studies in people with fertility problems (Marques et al., Reference Marques, Costa, Vaz, Carvalho, Fernandes, Barros and Sousa2008; Hammoud et al., Reference Hammoud, Purwar, Pflueger, Cairns and Carrell2010; Poplinski et al., Reference Poplinski, Tüttelmann, Kanber, Horsthemke and Gromoll2010; Kläver et al., Reference Kläver, Tüttelmann, Bleiziffer, Haaf, Kliesch and Gromoll2013; Li et al., Reference Li, Hao, Wang, Yi and Jiang2016), but not in patients with diabetes. The value of these findings is that they provide suitable markers for the assessment of fertility status in T2DM. Alternatively, understanding the mechanisms involved in the occurrence of subfertility or infertility in patients with diabetes may help to provide treatment strategies. Our results confirmed the effect of diabetes on epigenetic programming of spermatozoa, which may ultimately lead to subfertility. It could also account for the process of intergenerational effect of diabetes on infertility. One of the limitations of the present study was the small number of participants, therefore further investigations with bigger study populations are recommended to gain deeper knowledge of this phenomenon.
In conclusion, in fertility clinics we have patients with diabetes with no clear aetiology for infertility and unfortunately their treatment procedure ends up in failure. It seems that epigenetics is the missing link of the fertility chain and we suggest reconsidering male fertility evaluations in ART centres for cases of T2DM. Assessment of DNA methylation in some genes, especially imprinting ones, is a good candidate for epigenetic tests in these infertile/subfertile men. A threshold for methylation level of male fertility-related genes can be determined and we hope this would be a step closer to the therapeutic goals.
Acknowledgements
This research was performed as part of a doctoral thesis in reproductive biology at the Royan Institute, Tehran, Iran, and was financially supported by a grant from the research deputy of the Royan Institute (grant number 97000124).
Conflict of interest
There are no conflicts of interest.