Introduction
With the rapid growth of environmental concerns, there is a great requirement for more advanced energy storage devices with high performance [Reference Liu, Yu, Shen, Chen, Shen, Zhao, Fu, Yu and Bao1]. As a class of promising energy storage devices, supercapacitors are one of the most interesting electrical energy storage devices because of their great advantages such as high power density, operation over a wide temperature range, no memory effect, long life cycle, and good stability [Reference Brownson, Kampouris and Banks2, Reference Chen, Liu, Shen, Bao, Zhao and Wu3]. In recent years, carbon-based supercapacitors, as ideal energy-storage devices for fast storage and release of energy, have attracted great attention for energy management in the future electricity-powered world [Reference Strauss, Marsh and Kowal4, Reference Jin, Qiao, Zhou, Wu, Cui and Fan5]. Thus, the carbon electrode material, as the key contributor of energy storage of supercapacitors, is attracting considerable research interest in the materials science and energy storage fields [Reference Huang, Qiao, Sumpter and meuniera6, Reference Mondal, Kretschemer, Zhao, Liu, Wang, Sun and Wang7, Reference Li, Li, Zhao and Xu8]. Among the various candidates available, carbon-based materials ranging from activated carbons [Reference Madhu, Sankar, Chen and Selvan9] to graphene [Reference Mousavikhoshdel, Targholi and Momeni10] have attracted extensive attention in many energy-related applications, and are the most widely available electrodes due to their high surface area, good electrical conductivity, and low cost [Reference Liu, Shi, Gao, An, Cao and Liu11]. Recently, novel carbon nanomaterials, such as hierarchical porous carbon or heteratom doped carbon, have been widely applied in supercapacitor electrodes owing to their high surface area and excellent physicochemical properties. [Reference Sun, Zhou, Li, Yu, Zhang, Liu and Zhou12].
Porous carbon materials are promising candidates for supercapacitor electrodes due to their good chemical stability, fine conductivity, and high specific surface area [Reference Ma, Chen, Long, Wang, Qiao and Ling13]. Traditionally, microporous carbons prepared through physical activation or chemical activation are widely explored as electrode materials for supercapacitors [Reference Wang, Qiu, Feng, Sakai and Komiyama14]. Although these activation methods aim to improve the specific surface area and porosity of carbon materials, it seems hard to form special hierarchical architecture [Reference Tee, Tallo, Kurig, Thomberg, Janes and Lust15, Reference Wang, Yi, Zhu, Wang and Fan16]. In addition, formed micropores in porous carbons are not accessible to the electrolyte, lacking ion transportation channels and limiting the ion transportation, so the specific capacitance of microporous carbons decreases sharply at higher discharge current density [Reference Su, Poh, Chen, Xu, Wang, Li and Lin17]. Compared with micropores, mesopores in porous carbons can improve the rate capability by facilitating the diffusion of electrolyte ions into inner micropore adsorption sites and can act as ions transport pathways for further improving the performance of supercapacitor [Reference Cheng, Gao, Zang, Yang, Bai, Xu, Liu and Lei18, Reference Tang, Hu, Dai, Yi, Gordin, Chen, Song and Wang19]. All these efforts aim to provide efficient ions/electrons transfer path and high charge storage capability; therefore, it is desirable to build hierarchically porous architectures comprising of micropores, mesopores, and macropores in carbon materials to fabricate high-performance supercapacitors [Reference Li, Cheng, Dong, Wang, Chen, Huang, Wei, Feng, Jia and Zhou20]. So far, various hierarchically porous carbonaceous materials such as activated carbon, templated carbon, carbon nanotube, carbon nanofiber, graphene, and biomass-derived carbon have been explored as electrode material for supercapacitors [Reference Wang and Liu21, Reference Xiao, Zeng, Long, Chen, Ding, Wang and Wang22, Reference Wang, Yan, Tu, Cheng and Zhang23].
In addition to the above choice for advancing the supercapacitive performance of carbon-based materials, doping heteroatoms (N, B, P, and S) in carbon materials has also been known as an effective strategy to enhance supercapacitive performance [Reference Chen, Yu, Xing, Wang, Li and Li24]. The incorporation of heteroatoms into the carbon framework would cause the shift of the fermi level, increase the electrical conductivity, improve charge transport sites and surface wettability as compared with the nondoped carbon materials [Reference Sun, Gao, Pi, Wang, Yang, Qu and Wu25]. This will ensure a fast transfer rate of electrolytic ions in microporous and small mesoporous, improving the availability of surface area and enhancing supercapacitance performance of porous carbon materials [Reference Zhou, Pu, Wang and Guan26]. To date, a lot of researches have been succeed in doping heteroatoms into the carbon materials, including post-treatment of carbon materials and direct carbonization or activation of heteroatoms-containing precursors, demonstrating improved performance in various fields [Reference Zhao, Lai, Lyu, Jiang, Xie, Wang, Wu, Yang, Jin, Ma, Liu and Hu27, Reference Hou, Cao, Idrees and Ma28]. Motivated by these interesting works, we successfully used hydroxymethyl melamine precursor and F127 as soft template to synthesize the 3D-HNCMs with rich pores by simple KOH activation. And 3D porous nitrogen-doped carbon materials (3D-PNCMs) with excellent electrochemical properties as a contrast were also synthesized. The pore size was verified to less than 10 nm, which exhibits higher specific surface area (2094.28 m2/g) and better conductivity. The electrochemical performance of the prepared 3D-HNCMs was systematically investigated as a supercapacitor electrode material. The results of 3D-HNCMs demonstrated a high specific capacitance (409 F/g at the current density of 0.5 A/g), good cycle stability (the capacitance rentention of 98% after 10,000 cycles), and excellent rate capability, so that the capacitance remains up to 320 F/g at the current density of 20 A/g. The two carbon materials were synthesized with melamine as precursor, and the structural and performance differences between the two materials were analyzed. This is a meaningful work for studying similar 3D porous carbon network structure materials as electrode material for supercapacitors.
Results and discussion
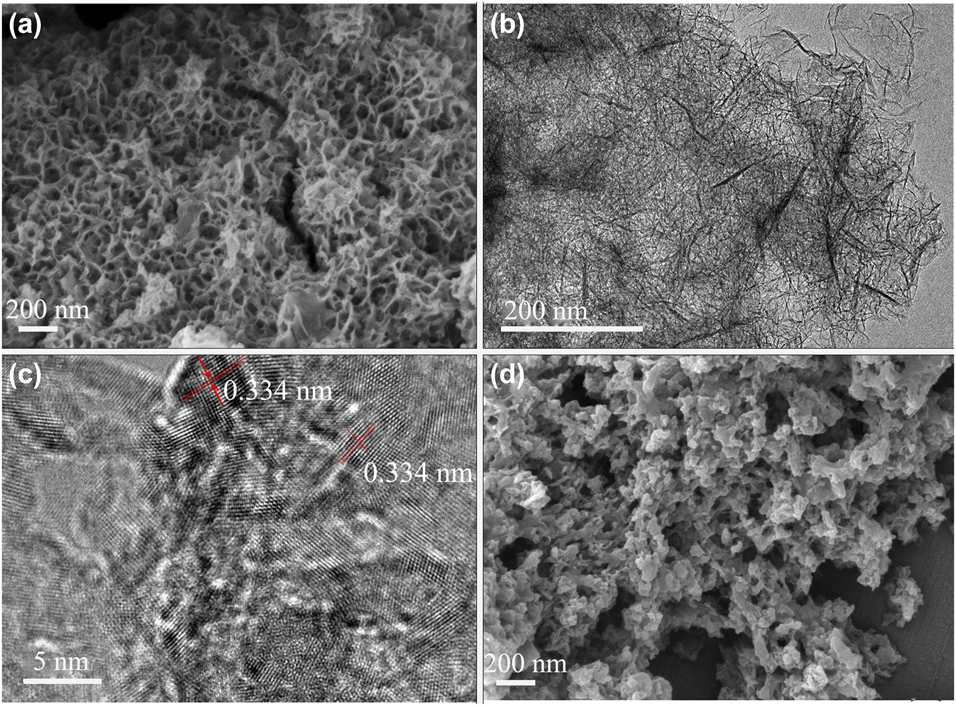
To examine the morphology and structure of the prepared 3D-HNCMs and 3D-PNCMs, SEM and TEM were performed at different magnifications. The SEM images showed a three dimension structure consisting of carbon materials. The SEM image is displayed in Fig. 1(a), the honeycomb structure can shorten the diffusion path of electrolyte ions, which is critical to the energy storage and conversion devices. In addition, this honeycomb ordered mesoporous carbon can also produce a large specific surface area, providing more active sites to obtain higher specific capacitance [Reference Wu, Jiang, Long and Fan29]. Figure 1(b) further confirms that the samples possessed network structure with an ultrathin sheet-like pore wall. As shown in high-resolution transmission electron microscopy (HRTEM) images of the nanosheet edge of 3D-HNCMs in Fig. 1(c), the ordered graphitic layers and corresponding lattice fringes can be clearly observed and the interplanar distance is measured to be 0.334 nm, suggesting a quite high degree of graphitization. The highly edge graphitic structure is expected to enhance electric conductivity of 3D-HNCMs [Reference Wang, Qiu, Feng, Sakai and Komiyama14]. As presented in Fig. 1(d) with higher magnification, the prepared samples possess well-defined disordered porous structure. The resin microspheres are sporadically attached to the relatively rough surface of the base material, mainly for the F127 particles wrapped by molecular melamine and phenolic resin, and the micelles were formed by the driving of hydrogen bonds. Amazingly, the incorporation of potassium hydroxide to the hydroxymethyl melamine results in a highly ordered self-assembly honeycomb mesoporous carbon materials.
(a) SEM image of as-prepared 3D-HNCMs. (b, c) TEM images of 3D-HNCMs (different magnications). (d) SEM image of 3D-PNCMs.

SEM was also used to examine the morphology of as-prepared 3D-HNCMs with different reaction conditions. During the experiment, we found that the activation temperatures and alkali activation ratios had significant effect on the morphology of sample 3D-HNCMs. Figures S1(a)–S1(c) represent images of 3D-HNCMs (A and KOH in a weight ratio of 1:3) at different carbonization temperatures of 600 °C, 700 °C, and 800 °C, labeled as 3D-HNCMs-600, 3D-HNCMs-700, and 3D-HNCMs-800, respectively. Figures S1(d)–S1(f) represent images of 3D-HNCMs (carbonization temperature at 700 °C) with different alkali ratios of 1:2, 1:3, and 1:4, labeled as 3D-HNCMs-1:2, 3D-HNCMs-1:3, and 3D-HNCMs-1:4, respectively. As shown in Figs. S1(a)–S1(c), honeycomb structures appeared at different carbonization temperatures, but the three-dimensional honeycomb structure of the sample is clearest at 700 °C. The three-dimensional honeycomb structure of the sample appears weakly collapse when the temperature at 800°, and the structure of Fig. S1(c) was destroyed and some honeycomb fragments were observed. Moreover, from Fig. S1(d) with the increase of the weight ratio of A and KOH at 700 °C, the 3D-HNCMs-1:2 agglomerated and showed less three-dimensional network structure, indicating that the amount of KOH was small and the activation of the sample was insufficient. With the reducing of the weight ratio of A and KOH, the 3D-HNCMs-1:4 has a rich network structure and some thin-film structures appeared, indicating that the activation degree of sample was more sufficient, causing the three-dimensional honeycomb structure destroy, and the three-dimensional honeycomb structure was not obvious. Therefore, the three-dimensional network honeycomb structure of the sample is ideal when the activation temperature is 700 °C with an activation ratio of 1:3, and the results were shown in Fig. S1(b).
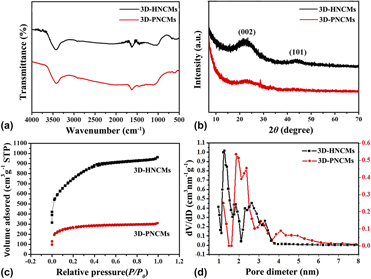
Figure 2(a) shows the Fourier transform infrared spectra (FTIR) spectra of 3D-HNCMs and 3D-PNCMs. It is shown clearly that the absorption peaks of both carbonaceous materials are similar, and the absorption peak of 3500–3230 cm−1 was assigned to the characteristic groups of the NH–H of samples and O–H bond of the adsorbed H2O. The peak at 1584 cm−1 was assigned to the C=C and C=N bonds of the benzene ring conjugate structure. Figure 2(b) shows the X-ray diffraction (XRD) patterns for the samples. The wide and shallow (002) peaks locating around 22.5° as well as the inconspicuous (101) peaks locating at approximately 43.5° were observed in all the samples, indicating that the 3D-HNCMs and 3D-PNCMs samples were almost in amorphous structure but with small regions of crystallinity. Further information about the porous properties of 3D-HNCMs and 3D-PNCMs composites was obtained by nitrogen adsorption–desorption isotherm and pore size distribution curves. All the isotherms in Fig. 2(c) were assigned to a typical type I and showed a rapid uptake at low relative pressure (p/p 0) bond, indicating a microporous feature of the sample. The adsorption quantity of 3D-HNCMs and 3D-PNCMs was increased gently in the low pressure stage, and no observed adsorption limited in the higher relative pressure region. The pore size distribution of product 3D-HNCMs in Fig. 2(d) was determined based on the desorption data, which shows the pore size of 1.2–7.5 nm indicating the as-prepared 3D-HNCMs have well-developed micropore and mesopore structures. This result indicates that the mesopores of composite were preserved during the chemical activation. These features complement the ultrathin sheet-like pore wall structure in the TEM Fig. 1(b), and confirm the honeycomb structure of 3D-HNCMs. The pore size distribution of the 3D-PNCMs is mainly between 6 and 10 nm to denote the sample consists of the mesoporous structure. It was expected that these micropores were formed while KOH corroded the mesopore wall of carbon materials at high temperature and the micropore generation did not ruin the mesopore structure of carbon materials [Reference Wang, Zhang, Kuang, Zhou, Xing and Zhou30]. Therefore, the as-prepared honeycomb nitrogen-doped carbon materials contain abundant mesopores and micropores, which have an important contribution to the capacitance of the supercapacitor. The uniform micropores can provide abundant electroactive sites for the formation of electrical double layers while the mesopores will serve as continuous ion-highways, benefiting to constructing large ion-accessible surface area. At present, KOH-activated carbonaceous materials are widely used for supercapacitor applications [Reference Wang and Kaskel31].
(a) IR spectra of 3D-HNCMs and 3D-PNCMs. (b) XRD patterns of 3D-HNCMs and 3D-PNCMs. (c) N2 dsorption/desorption isotherms of 3D-HNCMs and 3D-PNCMs. (d) Pore-size distributions of 3D-HNCMs and 3D-PNCMs.

Although the KOH activation is a well-known method to generate the porous in carbon materials, nevertheless the activation mechanism has not been well understood. Otowa et al. [Reference Otowa, Tanibata and Itoh32] proposed that the activation process consists of several simultaneous/consecutive reactions, as shown in Eqs. (1)–(4),
 $$2{\rm{KOH}} \to {{\rm{K}}_2}{\rm{O}} + {{\rm{H}}_2}{\rm{O}}\quad ,$$
 $${\rm{C}} + {{\rm{H}}_{\rm{2}}}{\rm{O}} \to {\rm{CO}} + {{\rm{H}}_2}\quad ,$$
 $${\rm{CO}} + {{\rm{H}}_{\rm{2}}}{\rm{O}} \to {\rm{C}}{{\rm{O}}_{\rm{2}}} + {{\rm{H}}_2}\quad ,$$
 $${\rm{C}}{{\rm{O}}_{\rm{2}}} + {{\rm{K}}_{\rm{2}}}{\rm{O}} \to {{\rm{K}}_2}{\rm{C}}{{\rm{O}}_{\rm{3}}}\quad .$$
Even though the real reaction processes and activation mechanisms are not only depending on the carbon sources but only the reaction various parameters, this method is still an effective way to develop the porous carbon materials. Pore-structure parameters of the nitrogen-doped carbon materials are listed in Table SI. The specific surface area of the 3D-HNCMs and 3D-PNCMs was 2094.28 m2/g and 943.43 m2/g, and the total pore volume of 3D-HNCMs and 3D-PNCMs was 1.26 cm3/g and 0.48 cm3/g, respectively. Compared to the reported literature [Reference Guan, Dang, Chen, Dong and Wang33], the as-prepared 3D-HNCMs have a great advantage in the supercapacitor application due to the large specific surface area and pore volume.
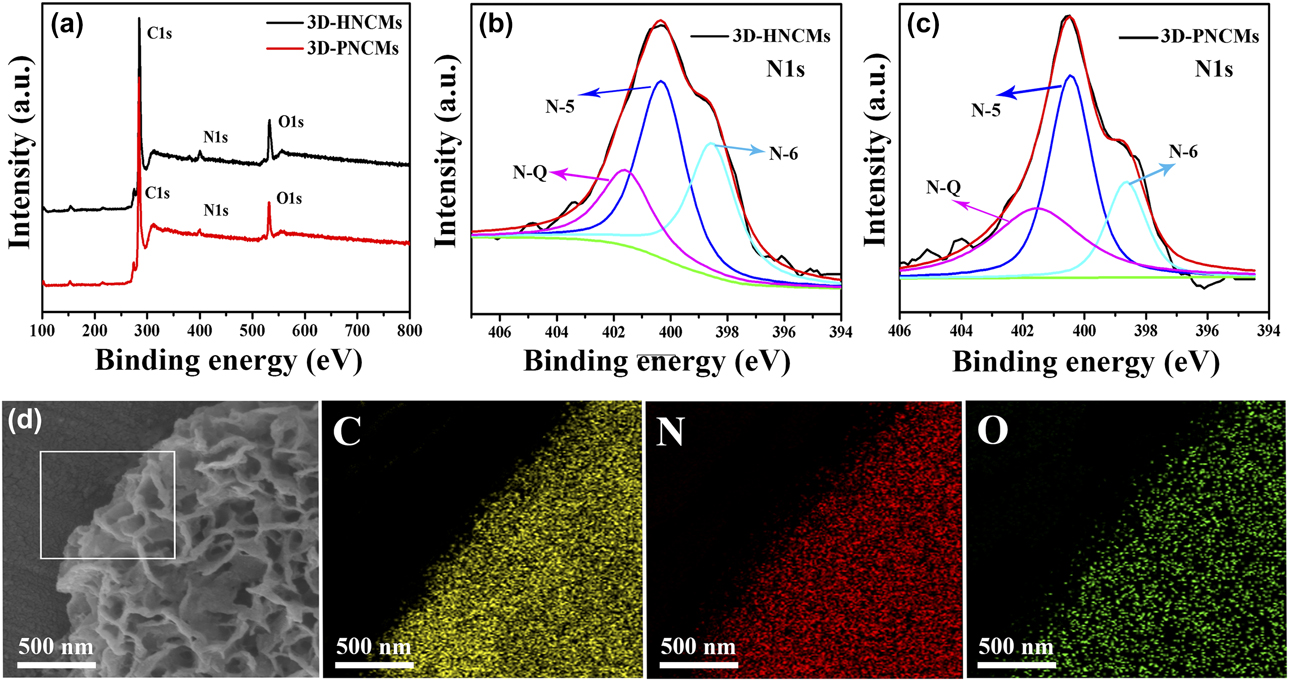
X-ray photoelectron spectroscopy (XPS) is carried out to characterize the chemical state of nitrogen in the 3D-HNCMs and 3D-PNCMs. As shown in Fig. 3(a), the survey spectrum shows the presence of carbon, nitrogen, and oxygen elements in the as-prepared sample. Based on the XPS results, nitrogen-doping of the prepared carbon materials is confirmed. The existence of numerous nitrogen atoms is confirmed from the IR results above, which further demonstrated the incorporation of nitrogen atoms into carbon materials. The C 1s main peak at 284.5 eV corresponds to the sp 2 C, indicating the most of the C atoms in the samples are arranged in a conjugated honeycomb lattice. The small peaks at 285.5 eV and 286.4 eV are ascribed to the C–N bonding structure of N-sp 2 C and N-sp 3 C bonds, respectively [Reference Okpalugo, Papakonstantinou, Murphy, Mclaughlin and Brown34]. The O 1s peak arises from the oxygen or absorbed water. The element composition of the prepared samples is determined by EDS measurements and the content of different elements is listed in Table SII. Based on the EDS results, we calculated the N-doping levels to be 5.59 wt% and 2.81 wt% for 3D-HNCMs and 3D-PNCMs, respectively, which indicate that the surface nitrogen content of the material is higher than the internal, and vice versa.
(a) XPS spectra over a wide range of binding energies of 3D-HNCMs and 3D-PNCMs. (b, c) The fine-scanned N 1s XPS spectra of 3D-HNCMs and 3D-PNCMs. (d) SEM element mapping images of 3D-HNCMs (selected from the square region).

To further characterize the nature of nitrogen in the materials, fine scans of the N 1s XPS spectra of the 3D-HNCMs and 3D-PNCMs in Figs. 3(b) and 3(c) were performed and deconvoluted into three different peaks locating at 398.5, 400.5, and 401.5 eV, which maybe, respectively, attributed to pyridinic N (N-6), pyrrolic nitrogen (N-5), and quaternary nitrogen (N-Q) types [Reference Rao, Gopalakrishnan and Govindaraj35, Reference Maiti, Lee, Lee, Oh, Kim, Kim, Shim, Han and Kim36]. The binding energies and relative surface nitrogen source ratio of products are shown in Table SIII, indicating most of N atoms are substitutionally doped into the carbon materials and mainly in the form of Pyrrolic N and arranged in a conjugated honeycomb lattice. The small ratio at 398.5 and 401.5 eV reflected to the N-6 and N-Q, respectively, and the ratio of N-6 of 3D-HNCMs is higher than that of 3D-PNCMs, and the supercapacitor performance of this 3D-HNCMs increases with the ratio increases, which indicated that N-6 plays a dominant role in its superior conductivity and high specific capacitance. Meanwhile, the N-6 are easy to be removed from the carbon network under higher carbonization temperature due to their less stability [Reference Yan, Kong, Shen, Dai, Shi, Hu, Luo and Kang37], and this manifested the N-6 of the 3D-HNCMs which prepared by us are more stable than the 3D-PNCM. N-6 and N-5 provide N atoms, which located in a π system with one or two p-electrons to form a conjugated system. Thus, the synergistic effect of N-6, N-5, and N-Q improves the pseudo-capacitance behavior of porous nitrogen-doped carbonaceous materials. In addition, the elemental spatial distribution of individual components, such as carbon, oxygen, and nitrogen in 3D-HNCMs, is shown in Fig. 3(d). The uniform distribution of green dots suggests that nitrogen is uniformly doped in N-HMNC skeleton.
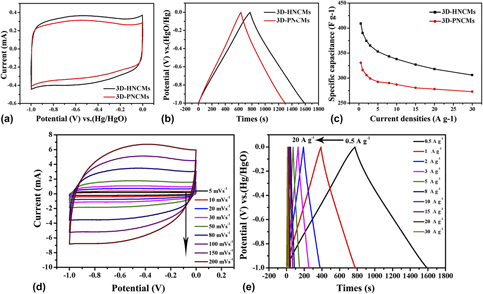
3D-HNCMs were used as electrode materials of supercapacitor, and their capacitive performance was studied in 6 M KOH eletrolyte employing a standard three-electrode system. Figure 4(a) shows the cyclic voltammetry (CV) curves of 3D-HNCMs and 3D-PNCMs at a scan rate of 10 mV/s. The CV curves of the carbon materials show rectangular shape and a big hump is observed in mid-voltage, indicating that these two carbon materials possess excellent capacitive behavior and the presence of pseudo-capacitance effect could be attributed to the complex and overlapped redox reactions introduced by N, O-doped species. A larger area of the CV curve of 3D-HNCMs shows a higher specific capacitance of the capacitors than that of 3D-PNCMs. The GCD curves of 3D-HNCMs and 3D-PNCMs at a current density of 0.5 A/g are presented in Fig. 4(b). The curves exhibit a nearly triangular shape with a large deviation from linearity, implying good capacitive behaviors originating from the combination of electric double layer capacitance and pseudo-capacitance. Some reported studies proposed that different nitrogen types located at the edges of graphene layers, such as pyridinic nitrogen and pyrrolic nitrogen, can generate pseudo-capacitance, which is corresponding to the above cyclic voltammogram [Reference Xu, Zheng, Jia, Cao and Yang38]. The excellent performance of the 3D-HNCMs can be attributed to the good combination of the honeycomb structure of effective surface area and surface accessibility, and the nitrogen type functional groups inducing the additional pseudo-capacitance as well as improving the wettability of the electrode material. In order to further investigate the capacitive performance of 3D-HNCMs, CV curves at scan rates between 5 and 200 mV/s are shown in Fig. 4(d). When the scan rate increases to 200 mV/s, the CV curves still maintain rectangular shape with little distrotion, and the good capacitive behavior of carbon is attributed to its 3D honeycomb bicontinuous porosity, polar surface property, and high nitrogen content in 3D-HNCMs, which can promote ion diffusion and electrolyte/electrode wettability. The micropores of 3D-HNCMs are favorable for enlarging the specific surface area, the mesopores offer large channels for electrolyte access and ion transport, and the diffusion distance from mesopores to micropores is short, resulting in a very low diffusion resistance. The GCD curves at different current densities are presented in Fig. 4(e). All curves show nearly triangular shapes, indicating the ideal capacitor behavior and the specific capacitance of 3D-HNCMs is calculated as 409 F/g at a density of 0.5 A/g. Besides, it displays good rate capability of 78.3% capacitance retention at various current densities increased from 0.5 to 20 A/g.
(a) CV curves of 3D-HNCMs and 3D-PNCMs at a scan rate of 10 mV/s. (b) GCD curves of 3D-HNCMs and 3D-PNCMs at a current density of 0.5 A/g. (c) The specific capacitance of 3D-HNCMs and 3D-PNCMs at current densities in the range of 0–30 A/g. (d) CV curves of 3D-HNCMs at different scan rates. (e) GCD curves of 3D-HNCMs at different current densities.

Moreover, the specific capacitances of the 3D-HNCMs and 3D-PNCMs at different current densities are exhibited in Fig. 4(c). The specific capacitance only decreases slightly with the increasing of charge/discharge current, and even when the current loading increases to 20 A/g, the specific capacitance of 3D-HNCMs is still kept as high as 320 F/g. This is a common feature of real supercapacitor due to the electrolyte ions which they have no enough time to diffusion into the entire pore surface and narrow micropore surface at higher charge current densities. This is also a reason for the low utilization of the porous and surface in a real supercapacitors. The 3D-HNCM electrode offers the bigger specific capacitance of 409 F/g than that of 3D-PNCMs electrode (335 F/g) at 0.5 A/g. Meanwhile, the 3D-PNCMs electrode displayed 78.5% capacitance retention as the current density increased from 0.5 to 20 A/g, and the results could be attributed to the better electrical conductivity, porosity, and nitrogen contents.
The two-electrode symmetric supercapacitor was also fabricated to further investigate the electrochemical performance and the potential application of our materials in supercapacitors, and the obtained 3D-HNCMs as an electrode material for supercapacitor were evaluated by CV and GCD tests in 6M KOH aqueous solution. Figure S2(a) shows the CV curves of 3D-HNCMs which show rectangular-like shape with weak redox peaks, indicating excellent capacitive behavior and the presence of pseudo-capacitance effect. The CV curves of as-assembled 3D-HNCMs//3D-HNCMs supercapacitor retain rectangle-like shapes even at a high scan rate of 200 mV/s, indicating an ideal electrochemical capacitive behavior. Compared with three-electrode system, 3D-HNCMs in two-electrode symmetrical supercapacitor exhibit better capacitive behavior. It may be caused by the smaller electrochemical impedance in two-electrode system than three-electrode system [Fig. 4(d)]. Figure S2(b) shows the GCD measurements for 3D-HNCMs supercapacitor, and the GCD curves at different current densities displayed almost symmetric. Fig. S2(c) shows the energy-power density performance for the 3D-HNCMs//3D-HNCMs symmetric supercapacitor. It could be seen that the ragone plots gradually slope down as the increase of power density, which means less energy can be released at higher power output [Reference Zhou, Zhang, Xing, Yu, Han, Si and Zhuo39]. The energy density can reach 15.37 W h/kg at the power density of 1 kW/kg. With high power densities of 40.3 kW/kg, the energy density of 8.96 W h/kg is still retained for 3D-HNCMs//3D-HNCMs supercapacitor. Thus, the 3D-HNCMs exhibited superior energy and power properties, as revealed by GCD measurements [Fig. 4(b)]. These results demonstrate that the 3D-HNCMs material could be a promising electrode material in supercapacitors.
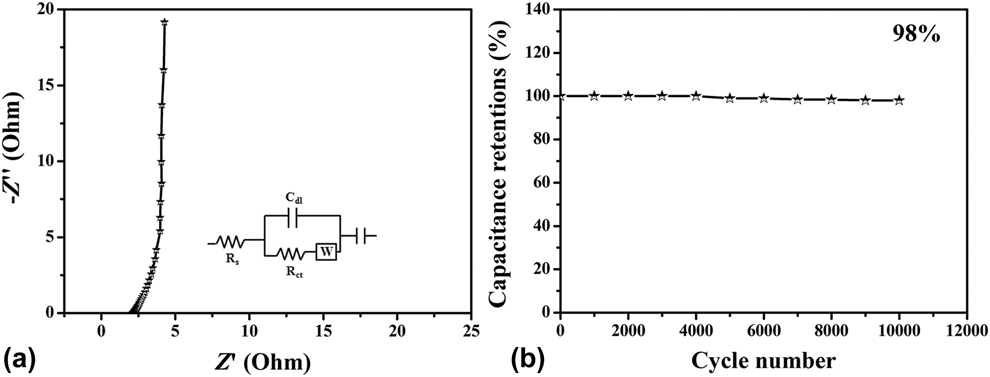
The electrochemical impedance spectroscopy (EIS) was carried out to investigate the kinetics of the electrochemical process for the 3D-HNCM electrode. Figure 5(a) shows the Nyquist plot of the 3D-HNCM electrode in the 6 M KOH solution employing a two-electrode system. It consists of a vertical line, an almost 45° diagonal line, and a quasi-semicircle, the slope of the vertical line indicated a fast ion transport. Furthermore, electrode shows small equivalent series resistances 2.1 Ω and charge transfer resistances 0.93 Ω, which are important for a high rate capability. Figure 5(b) presents the long-term stability of the 3D-HNCM electrode evaluated at a current density of 3 A/g. There about 2% capacity decay was observed after 10,000 cycles, and these results clearly indicated that 3D-HNCMs have a good cycling stability.
(a) Nyquist plot simulation of 3D-HNCMs (inset: equivalent circuit, where C dI is the constant phase element, R s is the solution resistance, R ct is the interfacial charge transfer resistance, and W is the Warburg resistance.). (b) Cycling stability of 3D-HNCMs measured at 3 A/g in the 6 M KOH solution employing a two-electrode system.

Conclusions
In summary, the 3D-HNCMs and 3D-PNCMs were fabricated via a solution chemical method combined with template process with a low cost and large-scale commercial F127 as a soft template and KOH activation treatment. The observations have been elucidated by various spectroscopic and microscopic analyses. The 3D-HNCMs show a large specific surface area, and N content is revealed to be 5.59 wt%. The corresponding BET surface area and total pore volume are up to 2094.28 m2/g and 1.256 m3/g, respectively. Simultaneously, these 3D nanomaterials showed the excellent capacitive performance with high specific capacitance, good power capability, and outstanding electrochemical cyclability performance. These good capacitive performances closely relate to the synergistic effect of the richly porosity, high effective surface area, and nitrogen atom doped. Besides, the honeycomb 3D network could serve as an efficient charge-transport network with sufficient interconnected pathways. Coupling with the nitrogen doping enhances electric conductivity and secures the fast transport of electrons. It is believed that 3D nitrogen-doped carbon nanostructure is suitable for supercapacitor but also other electrochemical devices.
Methodology section
Synthesis of 3D-HNCMs
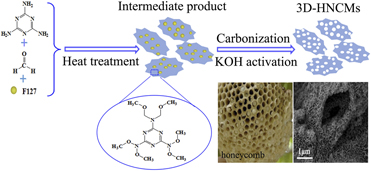
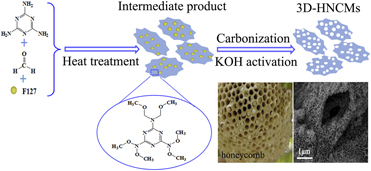
Figure 6 illustrated the fabrication procedure for constructing the 3D-HNCMs. The procedure as following steps: (i) A mixture of 5 mL 0.5 g/mL melamine aqueous solution and 5 mL of formaldehyde (37 wt%) was prepared at room temperature. And the mixture with stirring for 30 min at 70 °C formed bright aqueous solution. Subsequently, adjusting the pH of the solution with aqueous hydrochloric acid until the pH value of the solution reached 4.5 with a pH meter. Afterward, 10 mL of ethanol solution containing 1.44 g of F127 was added slowly under continuous stirring at room temperature for 30 min. Finally, the obtained product was washed by deionized water and dried at 60 °C under vacuum conditions. (ii) The above product were calcined in nitrogen atmosphere with a heating rate of 10 °C/min from room temperture to 350 °C for 1 h and then heated to 750 °C maintained for 2 h in a tube furnace. After cooling to room temperature, the solid sample were ground and rinesd with deionized water and ethanol to remove the excess medicine, then the resulting powders were dried at 60 °C under vacuum, marked the powders sample as A. Thereafter, in order to activate the powder products, the A was added in an aqueous solution of potassium hydroxide (A and KOH in a mass ratio of 1:3), uniformly mixed, and evaporated until there is no significant moisture. Finally, 3D-HNCMs were prepared by annealing mixture at 700 °C for 2 h in a tube furnace, under nitrogen gas with a heating rate of 5 °C/min, followed by natural cooling to room temperature. The final 3D-HNCMs was repeatedly washed with 0.5 M HCl solution followed by deionized water and ethanol for several times to remove any salts, and then dried in a vacuum oven at 60 °C for 12 h.
Schematic illustration of fabrication procedure for 3D-HNCMs.

Synthesis of 3D-PNCMs
In a comparison, the synthetic method of 3D-PNCMs was similar to the preparation of 3D-HNCMs: briefly, the bright color aqueous solution of the mixture of melamine and formaldehyde was adjusted with sodium hydroxide solution until the pH value of the solution reached 8.5. In addition, 1.6 g of resorcinol and 4.5 mL of formalin (37 wt%) were dispersed in 4 mL of deionized water and reacted at 70 °C with stirring for 30 min. Next, mixed the two solutions obtained above, and magnetic stirring at room temperature for 2 h. Then, 10 mL of ethanol solution containing 1.44 g of F127 was added slowly to the mixture under continuous stirring for 1 h. After the reaction completed, the obtained product washed with 4 mL of acetic acid and with the obtained product via the same method as step (ii) of preparation 3D-HNCMs, and the sample was denoted as 3D-PNCMs.
Experimental
Materials
Melamine, formaldehyde, and resorcinol were purchased from China National Pharmaceutical Group, Shanghai, China. Potassium hydroxide (KOH) and hydrochloric acid (HCl) were supplied by BeiYin LiangYou Chemical reagents Co., Ltd., BeiYin, GanSu, China, F127 obtained from Sahn Chemical Technology (Shanghai) Co., Ltd, Shanghai, China. All chemicals were analytical grade and used without further purification. Deionized water was used for preparation of all aqueous solutions.
Morphology and structure characterizations
The morphology and structure of prepared materials were investigated by a field emission scanning electron microscopy [FESEM JSM-6701F], Japan Electronics Co., Ltd., (JEOL), Japan and a high-resolution transmission electron microscopy [HRTEM, JEOL JEM-2010], Japan Electronics Co., Ltd., (JEOL), Japan. The crystallite phase compositions of samples were examined by X-ray diffraction (XRD) measurements using a D/Max-2400 powder diffractometer with Cu Kα X-ray sources (Japanese Physical Company). Fourier transform infrared spectra (FTIR) were obtained by using EQUINOX55 FTIR spectrometer (Thermo Fisher Scientific, Shanghai, China) with KBr pellets. Nitrogen adsorption–desorption isotherms were collected at 77 K using a TriStar II 3020 system, McMurray (Shanghai) Instrument Co., Ltd., Shanghai, China. The specific surface area was calculated from the Brunauer–Emmett–Teller (BET) analysis and the pore volume, pore diameter, and pore size distribution were determined by the density functional theory (DFT) method based on the adsorption and desorption data. The obtained samples were also characterized by X-ray photoelectron spectroscopy (XPS) with an axis ultraspectrometer using mono Al Kα radiation at a vacuum pressure of 10−9 bar, 15 kV, and 15 mA, and the deconvolution of the peaks was performed with XPSpeak 4.1 software.
Electrode performance
All electrochemical measurements were carried out in CHI660E (Shanghai Chenhua instrument Co., Ltd., Shanghai, China) electrochemical workstation at room temperature. A three-electrode cell was chosen to test the electrochemical performance of the materials with KOH solution (6 M) as the electrolyte. The glassy carbon electrode (5 mm) was used as the substrate for preparation of the prepared electrode, a carbon rod was used as the counter electrode, and the Hg/HgO as the reference electrode. The electrode materials prepared as follows: 5 mg of the prepared electrode material are add into 5 mL of 0.25% Nafion (5%, Du Pont Corp.) alcohol solution and uniformly dispersed by ultrasound. Subsequently, 5 µL of the above mixed dispersion was cast onto the purified glassy carbon electrode by a drop-coating method. When the dispersion on the surface of glassy carbon electrode was naturally dried and uniform film was formed, and the coating was repeated once more. A two-electrode supercapacitor consists of two working electrodes, and the two layers of filter paper as a diaphragm. The working electrode prepared by dissolving prepared electrode material, polyvinylidene fluoride, and commercial acetylene black in a ratio of 8:1:1 to dimethylpyrrolidone. The electrochemical performances of the prepared electrodes were characterized by the CV, the galvanostatic charge–discharge (GCD) measurement, as well as the EIS. The specific capacitance of three-electrode system was obtained from the GCD measurement according to the following equation: C(F/g) = IΔt/ΔV × m, where C, I, Δt, ΔV, and m represent the specific capacitance, the current loaded, the discharge time, the potential change during the discharge process and the mass of active electrode material, respectively. Meanwhile, C′(F/g) = IΔt/(m′ × ΔV) for the two-electrode cells, where I, m′, Δt, and ΔV represent the constant current, the total mass of positive and negative electrodes, discharge time, and the voltage change during the discharge process. The specific energy density (E, W h/kg) and power density (P, W/kg) for a symmetric supercapacitor were calculated using equation: E = 1/2C′V 2 and P = E/t, C′ is the specific capacitance of symmetric supercapacitor, V is voltage change during the discharge process, and t is the corresponding discharge time.
Supplementary material
To view supplementary material for this article, please visit https://doi.org/10.1557/jmr.2019.86.
Acknowledgment
The authors are grateful for financial aid from Research Center of Gansu Military and Civilian Integration Advanced Structural Materials, the National Natural Science Foundation of China (51262027), the financial support of the Natural Science Foundation of Gansu Province (1010RJZA023), the Science and Technology Tackle Key Problem Item of Gansu Province (2GS064-A52-036-08), and the fund of the State Key Laboratory of Solidification Processing in NWPU (SKLSP201754).